

Abstract
Cortical thickness (CT) and surface area (SA) are altered in many neuropsychiatric disorders and are correlated with cognitive functioning. Little is known about how these components of cortical gray matter develop in the first years of life. We studied the longitudinal development of regional CT and SA expansion in healthy infants from birth to 2 years. CT and SA have distinct and heterogeneous patterns of development that are exceptionally dynamic; overall CT increases by an average of 36.1%, while cortical SA increases 114.6%. By age 2, CT is on average 97% of adult values, compared with SA, which is 69%. This suggests that early identification, prevention, and intervention strategies for neuropsychiatric illness need to be targeted to this period of rapid postnatal brain development, and that SA expansion is the principal driving factor in cortical volume after 2 years of age.
Keywords: brain development, cerebral cortex, gray matter, human, magnetic resonance imaging
Introduction
Cortical thickness (CT) and surface area (SA) are important components of cortical structure and are related to normal development and aging, cognitive functioning, as well as to neuropsychiatric disease. Abnormalities of CT and SA are commonly observed in neurodevelopmental disorders, including schizophrenia (Rapoport et al. 2012; Rimol et al. 2012), autism (Courchesne et al. 2007; Hazlett et al. 2012), and attention deficit hyperactivity disorder (Shaw et al. 2007, 2012). CT has been positively linked to IQ as well as the general factor of intelligence (g) in healthy individuals in late childhood, adolescence, and adulthood (Narr et al. 2007; Karama et al. 2011). Developmental trajectories of CT in frontal regions have been shown to be predictive of cognitive outcomes in typically developing children and adolescents (Shaw et al. 2006).
The first 2 years of life are an exceptionally dynamic period of structural and functional development in the human brain. The infant brain reaches 80% of adult volume by age 2 years, with a doubling of cortical gray-matter volume in the first year of life (Knickmeyer et al. 2008; Gilmore et al. 2011). Increasing evidence suggests that many neurodevelopmental and psychiatric disorders are the result of abnormal brain development in this stage of rapid cortical growth in early childhood, though very little is known about CT growth and SA expansion in this important period. Previous studies of childhood development of CT have been limited to late childhood and adolescence, and find that CT generally peaks around puberty and thins thereafter, exhibiting a regionally heterogeneous pattern in which association cortices reach peak values after sensory or motor cortices (Sowell 2004; Shaw et al. 2008). Studies of SA have found a 2- to 4-fold expansion between infancy and adulthood (Hill et al. 2010), with regionally heterogeneous expansion in the first 2 years of life (Li et al. 2013). Peak overall SA is reached in late childhood, similar to CT (Raznahan et al. 2011). The trajectory of CT in later childhood is less clear as some studies find CT peaks around puberty at age 8 or later (Shaw et al. 2006; Raznahan et al. 2011), though others indicate that CT peaks earlier (Sowell 2004; Brown et al. 2012).
This study is the first comprehensive investigation of longitudinal development of CT growth and SA expansion from birth to 2 years of age using 3-T magnetic resonance imaging (MRI) scans. We employed a novel image analysis approach that utilized subject-specific atlases that allowed for longitudinal registration and segmentation of scans in this challenging period of rapid growth and changing tissue contrasts. Our primary aim was to characterize the healthy developmental trajectories of regional CT and SA in the first 2 years of life and to determine the proportion of lifetime cortical growth that occurs in the first 2 years of life by comparing 2 year olds to healthy adults. We also studied the relationship between CT growth and SA expansion during infant brain development and explored gender differences in longitudinal growth patterns.
Methods
The Institutional Review Board of the University of North Carolina at Chapel Hill approved this study. Subjects were part of large prospective studies of early childhood brain development in healthy singletons and twins (Gilmore et al. 2007, 2010, 2011; Knickmeyer et al. 2008). Subjects were recruited prenatally and scanned shortly after birth, and at ages 1 and 2 years, and assessed with the Mullen Scales of Early Learning at 1 and 2 years of age (Mullen 1995). Children with a complete sets of successful longitudinal scans were included in this study; exclusion criteria were 1) gestational age at birth <32 weeks, 2) stay in the neonatal intensive care unit for more than 1 day, 3) abnormality on MRI other than a minor intracranial hemorrhage, common in the neonatal period (Looney et al. 2006), 4) major medical or neurologic illness after birth, or 5) Mullen Early Learning Composite score of <71 (Mullen 1995).
The primary study population consists of 40 typically developing singletons and a replication population consisting of 31 typically developing “single” twins randomly selected from pairs. Thirty-seven subjects (20 singletons; 17 twins) were included in a previous analysis of regional gray-matter development (Gilmore et al. 2011) and vertex-based analyses of SA expansion and structural cortical asymmetries (Li, Nie, Wang, Shi, Lin et al. 2013; Li, Nie, Wang, Shi, Lyall et al. 2013). Adult subjects (n = 44) were part of a previous study of adult brain development (Bullitt et al. 2005). Demographic information for the 2 infant cohorts and the adult cohort can be found in Supplementary Table 1.
Image Acquisition
Image were acquired on a Siemens head-only 3T scanner (Allegra, Siemens Medical Systems, Erlangen, Germany). Children were scanned unsedated while asleep, fitted with ear protection and with their heads secured in a vacuum-fixation device. T1-Weighted structural pulse sequences were a 3D magnetization prepared rapid gradient echo (MP-RAGE TR = 1820 ms, inversion time = 1100 ms, echo time = 4.38 ms, flip angle = 7°, resolution = 1 × 1 × 1 mm3). Proton density and T2-weight images were obtained with a turbo-spin echo sequence (TSE, TR = 6200 ms, TE1 = 20 ms, TE2 = 119 ms, flip angle = 150°, resolution = 1.25 × 1.25 × 1.95 mm3). For neonates who failed or were deemed likely to fail due to difficulty sleeping, a “fast” T2 sequence was done with a 15% decreased TR, smaller image matrix and fewer number of slices (5270 ms, 104 × 256 mm, 50 slices); 28 T2 fast scans (14 singleton; 14 twin) were performed. Potential differences resulting from the T2 scan sequences were controlled using a covariate in the statistical modeling.
Adult scans were performed on the same 3T scanner and were provided by the CASILab at The University of North Carolina at Chapel Hill and were distributed by the MIDAS Data Server at Kitware, Inc. (Bullitt et al. 2005). T1-Weighted structural imaging used a 3D spoiled gradient echo pulse sequence, fast low angle shot (FLASH TR = 14 ms, echo time = 7.7 ms, flip angle = 25°, resolution = 1 × 1 × 1 mm3). T2-Weighted images were obtained with a turbo-spin echo sequence (TSE, TR = 7780 ms, TE = 80 ms, flip angle = 180°, resolution = 1 × 1 × 1 mm3).
Image Analysis
All images in this study were visually checked and rated for motion artifacts using a 4-point visual scale [none 1), mild 2), moderate 3), severe 4)] based on Blumenthal et al. (2002). Of the 213 pediatric scans in the study, 150 (70.5%) had no motion artifacts, 47 (22%) had mild motion artifacts, 16 (7.5%) had moderate motion artifacts, and no scans had severe motion artifacts. Our average motion artifact rating for this study was 1.37 for both samples and 1.41 and 1.31 for singletons and twin cohorts, respectively.
Images were resampled into 1 × 1 × 1 mm3 resolution, skull-stripped, and then had the cerebellum and brain stem removed (Shi et al. 2012). Automated segmentation of neonatal brain images remains a challenging problem due to low tissue contrast, low spatial resolution, and high within tissue intensity variability. Segmentation of neonatal images is specifically challenging due to image signal contrast changing dramatically from birth to 2 years of age (Dietrich et al. 1988; Prastawa et al. 2005). In order to overcome these challenges, a novel longitudinally guided level-set-based method specifically designed for consistent image segmentation of gray matter, white matter, and cerebrospinal fluid (CSF) during infancy was jointly applied on T2-weighted images from neonates and T1-weighted images from 1 and 2 years olds (Wang et al. 2013). Major steps include: 1) performing an adaptive fuzzy c-means segmentation algorithm on both the neonate/1-year and 2-year-old images of the same subject, which integrates both bias correction and tissue classification into a single framework; 2) using of coupled level sets for initial neonatal segmentation; and 3) applying longitudinal information from later time points using nonlinear HAMMER registration (Shen and Davatzikos 2002) to guide the neonatal/1-year image segmentation. Utilization of later time point images to guide neonatal segmentation provides increased accuracy and produced more longitudinally consistent results. Subject-specific priors allow for less anatomical variability with the to-be-segmented image than previously employed methods utilizing atlases generated from randomly selected images (Wang et al. 2013).
Inner and outer cortical surfaces were first constructed using the process described in Li et al. (2012) with the inner cortical surface defined by the interface between white matter and gray matter, and the outer cortical surface is defined by the interface between gray matter and CSF (Li et al. 2012). The surface reconstruction includes the following steps: 1) performing topology-correction of white matter to ensure a spherical topology; 2) utilizing the Marching cubes method to convert the boundary of the corrected white matter to an explicit surface representation; 3) applying the deformable surface method driven by a force derived from the Laplace's equation to obtain the refined inner surface and outer surface. CT and SA were measured after the surface reconstruction. The CT for each vertex was computed as the average value of the minimum distance from inner to outer surfaces and the minimum distance from outer to inner surfaces.
A prior 90-region parcellation atlas (76 cortical and 14 subcortical regions; Tzourio-Mazoyer et al. 2002) was transformed to infant space (Shi et al. 2011) and used to generate surface-based regions of interest (ROIs). The neonate, 1-year, and 2-year parcellation atlas images were registered to individual subjects with nonlinear HAMMER registration and atlas label maps were transformed accordingly. Cortical ROIs were first projected onto the inner cortical surface and then mapped to the outer cortical surface to obtain surface-based ROIs. The average CT and SA were calculated within each ROI. All adult images were processed with the same algorithm using the original atlas on adult space without the temporal constraint. Total cortical volume is defined as the volume of the cerebrum, as the cerebellum and the brain stem were removed during processing.
To validate the cortical surface measure computation results, a single rater (AEL) performed 14 manual segmentations (5 at neonate, 5 at 1 year, and 4 at 2 years). CT and SA values and were compared with those generated from the automated segmentation. Intraclass correlations (ICC) were calculated for whole brain and regional CT and SA. Whole-brain ICC for CT and SA were 0.975 and 0.986, respectively. ICCs for all 76 cortical regions averaged 0.87 for CT (range 0.40–0.98) and 0.91 for SA (range 0.39–0.99). Heat maps of ICCs across cortical brain regions are presented in Supplementary Figure 1. One region had no correlation between manual segmentations for CT measurements: the left middle temporal pole.
Statistical Analysis
All statistical analyses were performed using SAS statistical software, version 9.3. For demographic variables, frequency distributions were calculated for categorical variables, and means (standard deviations) were calculated for continuous variables. The least-squared means (standard error) were also calculated for the 76 ROIs for cortical surface measures, CT, and SA. Mixed models were used to calculate the least-squared means for CT and SA in the 76 ROIs at years 0, 1, and 2, and corresponding percent changes for years 1 and 2. An autoregressive covariance structure was used, as data were longitudinal. The mixed models included neonatal total cortical volume, year, gender, neonatal T2 scan status (fast vs. routine), and the interaction between gender and year as covariates. Neonatal total cortical volume is the sum of all gray, white, and cerebrospinal fluid labels from the segmentation subtracting the cerebellum. All statistical hypothesis tests were two-tailed and conducted at a significance level of 0.05. P values were not corrected for multiple comparisons, as this study is primarily hypothesis generating; all comparisons were analyzed in the replication sample of single unpaired twins.
Linear relationships between SA and CT growth rates were analyzed by calculating correlations between growth rates for each year. For the comparison of CT and SA values between 2 year olds and adults, least-squared means were calculated in a model, which included age at MRI, and gender. Rates of change between genders were compared using a longitudinal model that included gender, year, total neonatal cortical volume, and the interaction between gender and year as covariates. Intraclass correlations were calculated for the validation analysis between the automated segmentation algorithm and the manual segmentations and can be seen in Supplementary Figure 1 (Shrout and Fleiss 1979; Simpson et al. 1998).
Results
CT Growth
CT growth was studied in 40 typically developing children (22 males, 18 females) with longitudinal MRI scans done at ∼3 weeks, 1, and 2 years of age (Supplementary Table 1). We confirmed our results in a second cohort of 31 children (15 males, 16 females) from a related study of twin brain development (Supplementary Table 1). Plots of average global CT and total global SA for all children included in both cohorts can be seen in Supplementary Figure 2.
There are marked regional differences in CT in neonates; these regional variations are generally consistent from birth to 2 years (Fig. 1A, Supplementary Table 2). Thinnest cortices include primary sensory and motor cortices such as the precentral gyrus, postcentral gyrus, paracentral lobule, olfactory gyrus, Heschl's gyrus, and many regions in the occipital lobe (Fig. 1A, Supplementary Table 2). Thicker cortices include the medial superior frontal gyrus; the superior, medial, middle, and inferior orbitofrontal gyrus; the superior and middle temporal poles and the insula (Fig. 1A).
Figure 1.
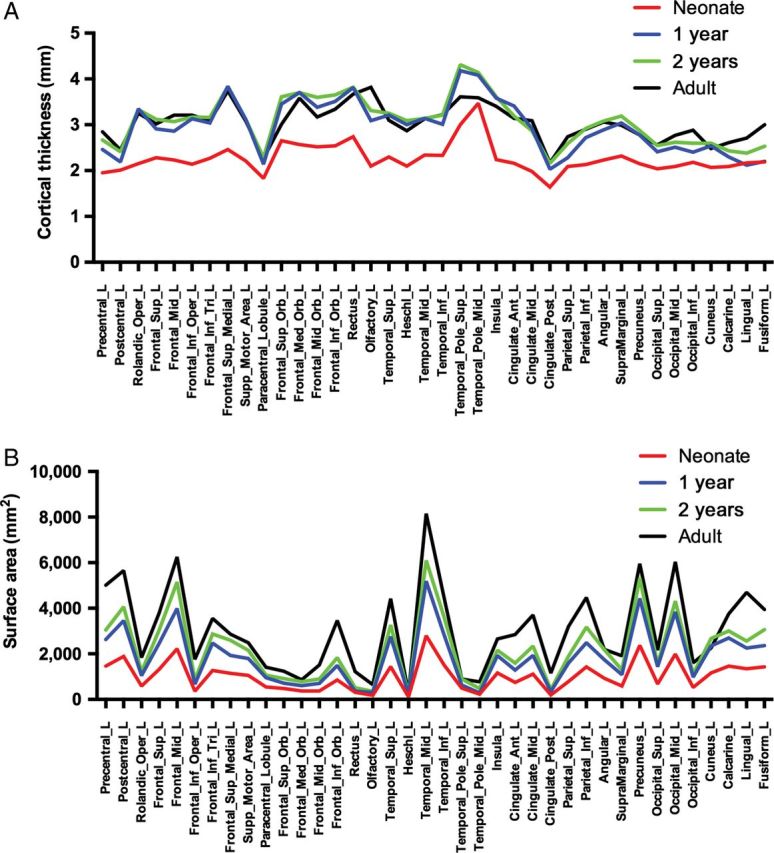
Regional growth of CT and SA over time. (A) CT anatomical LS means at neonate (blue), 1 year (red), 2 years (green), and adult (black); (B) SA anatomical LS means at neonate (blue), 1 year (red), 2 years (green), and adult (black). Only left hemispheric ROIs are shown; ROIs for both CT and SA exhibited symmetry. Quantitative results can be found in Supplementary Table 2 (CT), Supplementary Table 4 (SA), Supplementary Table 8 (Adult CT), and Supplementary Table 9 (Adult SA). (Note: SA values are determined by the size of the ROI as defined by the parcellation atlas).
There is robust and regionally heterogeneous growth of CT averaging 31% per ROI in the first year (range −2.50–65.83%), and 4.3% in the second (range −6.83–17.78%) (Fig. 2A,B, Supplementary Table 2). Overall, from birth to 2 years, CT increases an average of 36.08% (range 6.04–68.11%) (Fig. 2C, Supplementary Table 2). To better highlight the distinct regional differences in CT occurring during the second year of life, a supplementary figure was generated with a heat map more suitable for the range of growth occurring in this developmental time period (Supplementary Fig. 3).
Figure 2.
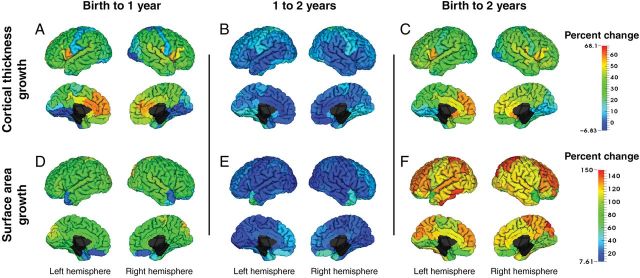
Early cortical surface measures development from birth to 2 years. Regional percent change for CT. (A–C) and SA (D–F) from birth to 1 year (A, D), 1 to 2 years (B, E), and birth to 2 years (C, F). Warmer colors indicate larger percent changes than cooler colors. Quantitative results can be found in Supplementary Tables 2–5.
In the first 2 years of life, regions experiencing the greatest degree of CT growth (top 25%) include primary auditory cortex (Heschl's gyrus, R superior temporal gyrus) and the Rolandic operculum, regions involved with speech and language development, as well as higher order association areas such as the inferior frontal operculum, medial superior frontal gyrus. The insula and anterior and middle cingulate gyrus, components of the limbic system, were also among the fastest growing regions. Regions experiencing the least amount of CT growth (bottom 25%) include primary sensory (postcentral gyrus) and sensory association (superior parietal gyrus) areas, multiple primary and secondary visual areas in the occipital lobe, and the middle temporal pole. Six regions experienced significant cortical thinning in the second year of life, including the left and right anterior cingulate gyrus, left and right middle cingulate gyrus, right gyrus rectus, and the left Rolandic operculum. Regional patterns of CT growth were very similar in our replication sample (Supplementary Table 3). ROI percent change comparisons between the singleton and twin cohorts show high correlations for both age ranges (birth to 1 year: r2 = 0.93; 1–2 years: r2 = 0.88) and are presented in Supplementary Figure 4.
Cortical Surface Expansion
There is also robust and regionally heterogeneous expansion of SA, averaging 76.35% per ROI in the first year (range 15.46–120.50%) and 22.51% in the second (range 7.61–66.73%) (Figs 1B, 2D, and 3E; Supplementary Table 4). Overall, cortical SA increases an average of 114.56% in the first 2 years of life (range 64.55–149.57%) (Fig. 2F and Supplementary Fig. 3 and Table 4). Supplementary Figure 3 presents regional differences of 1- to 2-year change with a heat map that provides better visualization of the regional differences. High-expanding regions (top 25%) in the first 2 years of life include regions in the lateral frontal lobes (superior, mid, and inferior operculum), lateral parietal (superior parietal and angular gyrus), mid orbital frontal, and occipital lobes (cuneus and superior occipital gyrus), as well as left Heschl's and left inferior temporal gyri. Low-expanding regions (bottom 25%) include multiple regions of the orbital surface of the frontal lobes, superior temporal poles, occipital regions (lingual, R calcarine, R fusiform), and the insula. Overall SA expansion in the first 2 years of life reflects growth rates in the first year in which the majority of expansion takes place. Regional patterns of SA expansion were very similar in our replication sample (Supplementary Table 5). ROI percent change comparisons between the singleton and twin cohorts show high correlations for both age ranges (birth to 1 year: r2 = 0.88; 1–2 years: r2 = 0.84) and can be visualized in Supplementary Figure 4.
Figure 3.
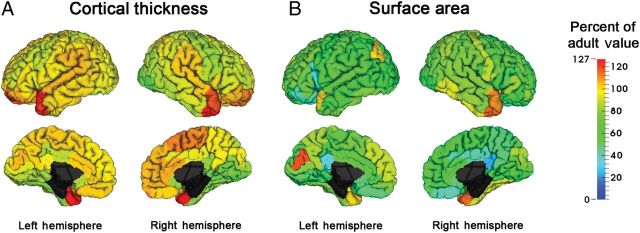
Comparison of 2 year old to adult cortical surface measure values. Percent of adult values for CT (A) and SA (B). For each ROI, we calculated the percent of adult value at 2 years of age. Warmer colors indicate larger percent of adult values than cooler colors. Quantitative results can be found in Supplementary Tables 8 and 9.
Gender Differences
While this study is not adequately powered to detect sexual dimorphism, we explored gender differences in CT growth and SA expansion. At birth, the left fusiform gyrus was the only region with replicated significant differences in CT between males and females when controlling for neonatal total cortical volume (Supplementary Table 6). There were no significant replicated differences in SA (Supplementary Table 6). There were no significant gender differences in CT growth rates between birth and 2 years of age for any ROI (Supplementary Table 6). For SA, males had a significantly faster rates of SA expansion compared with females in 7 ROIs: the left precentral gyrus, left superior frontal gyrus, left middle frontal gyrus, left olfactory gyrus, left insula, left superior parietal gyrus, and right calcarine gyrus (Supplementary Table 6). In the second year, males had a faster rate of growth in the right middle temporal gyrus. Our findings are consistent with a study by Raznahan et al. (2011) that found gender differences in late childhood and adolescence were primarily driven by changes in SA and not thickness.
Comparison Analysis: 2 years to Adult
Figure 1 clearly shows the spatial variation across the cortex tends to be generally set at birth and remains consistent through infancy into adulthood. Figures 1 and 3 also indicate that by 2 years of age, CT has generally reached adult-like values while SA continues to grow into adulthood. To demonstrate the proportion of lifetime cortical growth that occurs in first 2 years of life, we compared cortical surface measures at 2 years of age to those of 44 healthy adults (21 males, 23 females, mean age at scan 29.44 years). As the adult cohort is different from the infant cohort and scanned with a different sequence, results from this analysis have limitations, however, do provide a general comparison of infant and adult brain structure. Average ROI CT at 2 years of age was 97.1% of adult values (range 75.48–126.84%) (Fig. 3A, Supplementary Table 7). Only 4 regions had CT values significantly greater in 2 year olds than adults (temporal poles and left superior orbital gyrus), while 16 2-year-old regions had significantly thinner CT than adult values, including many regions of the occipital lobe, the bilateral pre-and right postcentral gyri, and right inferior temporal gyrus and bilateral middle lateral frontal gyri. In contrast to CT, SA at 2 years of age averages 69.1% of adult values (range 22.5–116.7%) (Fig. 3B, Supplementary Table 8). In 2 year olds, 57 of 76 cortical regions had significantly smaller SA compared with adults; no 2-year-old regions had significantly larger SAs. These findings suggest that CT develops earlier than SA and that overall cortical growth after age 1 is principally driven by increases in SA.
Relationships of Cortical Measures During Early Development
The relationship of how CT and SA relates to overall cortical volume has not been studied in this developmental window. In Figure 4, log–log plots demonstrate there is little to no relationship between CT and cortical volume. Conversely, there is a strong and significant relationship between total SA and total cortical volume for both singleton and twin cohorts (Fig. 4B). The similarity between the 3 cohorts of unrelated individuals across multiple time points suggests a fixed and constant relationship in healthy individuals between total cortical volume and total SA. The relationship of log(CV) to log(total SA) and log (mean CT) was compared with predicted scaling exponents—1/3 power of ICV for CT and 2/3 power of ICV for SA—as outlined in Im et al. (2008). In the combined sample, we found significant differences from the predicted scaling relationships for CT at all time points. There were also significant differences from the predicted scaling relationship for SA at neonate, 2 years, and adult and a trend-level significance at 1 year (P = 0.06; data not shown).
Figure 4.
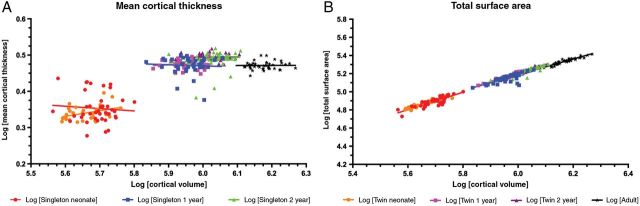
Relationship of CT and SA to cortical volume. Raw data values for each cohort are plotted at each time point. (A) The log–log relationship of mean CT to cortical volume is shown for neonate singletons (red), neonate twins (orange), 1-year singletons (blue), 1-year twins (pink), 2-year singletons (green), 2-year twins (purple), and adults (black). Regression analysis r2 values at neonate (singleton: r2 = 0.0061; twin: r2 = 0.1327), 1 year (singleton: r2 = 0.0033; twin: r2 = 0.0099), 2 years (singleton: r2 = 0.0196; twin: r2 = 0.0001), as well as in the adult cohort (r2 = 5.98E−5) are not significantly different from zero. (B) The log–log relationship of total cortical SA to cortical volume is shown for neonate singletons (red), neonate twins (orange), 1-year singletons (blue), 1-year twins (pink), 2-year singletons (green), 2-year twins (purple), and adults (black). Linear regression r2 values at neonate (singleton r2 = 0.7177; twin r2 = 0.8691), 1 year (singleton r2 = 0.5924; twin r2 = 0.9324), 2 years (singleton r2 = 0.8395; twin r2 = 0.9558), and adult (r2 = 0.8907) are each significantly different from zero (P < 0.0001).
Similarly, the relationship between CT and SA growth has not been studied in the first 2 years of life. The correlation between CT and SA growth rates were calculated for each ROI (Supplementary Table 9). Correlations of CT and SA growth were nonuniform and highly variable across the cortex. Overall, there were few regions with significant correlations and little replication in our twin sample, suggesting that CT growth and SA expansion in the first years of life are not related (Supplementary Table 9).
Discussion
Our results show that CT and SA have distinct and regionally heterogeneous patterns of development that are exceptionally dynamic, especially in the first year of life. SA expansion is more robust compared with CT growth, with an average expansion of 114.6% compared with 36.1% for CT. By age 2, CT is roughly 97.1% of adult values, compared with 69.1% for SA. This suggests that CT is relatively more established than SA at birth. Our study also suggests that the majority of CT growth is complete by age 2, while cortical surface expansion accounts for most of cortical volume growth after 1 year of age. Regional patterns of CT and SA growth were different from one another. The lack of clear regional correlations between CT and SA growth indicates that different genetic, environmental, and experience-dependent processes likely drive the development of these 2 components of cortical volume. These results provide an improved framework for understanding abnormalities of CT and SA observed in neurodevelopmental disorders as well as their potential relationship to cognitive and functional development.
Overall regional patterns of CT in early postnatal life are similar to those observed in older children and adults. Sensory and primary visual processing areas tended to have thinner cortices whereas thicker cortices tended to be in the medial frontal, temporal, and orbital regions. Similarities between our findings and previous postmortem (Economo and Koskinas 1925) and imaging studies (Fischl and Dale 2000; Sowell 2004) indicate that the overall pattern of CT is established within the first year of life. Growth rates observed for CT in the first 2 years of life dwarf those observed later in childhood, with CT growing 31% in the first and 4.3% in the second year of life. Maximal annual rates of change in late childhood are about 0.5% (Raznahan et al. 2011). Imaging studies in older children and adolescents indicate that CT displays regionally heterogeneous patterns of development with association cortices reaching peak values later than sensory or motor cortices (Sowell 2004; Shaw et al. 2008; Brown et al. 2012). From birth to age 2 years, primary and secondary sensory cortices tended to be slower growing, while regions involved with speech and language, some higher order association areas, and the insula and cingulate cortex were faster growing. We found that the left and right anterior cingulate gyrus, left and right middle cingulate gyrus, right gyrus rectus, and the left Rolandic operculum exhibited significant cortical thinning in the second year of life in both cohorts, suggesting that these regions may experience an early childhood wave of synaptic pruning prior to that already described in adolescence.
Less is known about SA expansion in childhood. Hill et al. (2010) found nonuniform 2- to 4-fold expansion between birth and adulthood; low-expanding regions included occipital, insular and medial temporal regions, while high-expanding regions included lateral temporal, lateral parietal, and medial prefrontal regions. Our results are generally consistent with these findings, with the exception of the occipital lobe, in which we found areas of both high and low expansion. A vertex-based analysis of cortical SA expansion from birth to 2 years of age in a sample that overlaps with this sample found similar patterns of cortical SA expansion, including differential rates in the occipital lobe, supporting this ROI-based analysis (Li et al. 2013). Mismatch between results for the temporal pole and caudal prefrontal cortices from this study and the previous analysis by Li et al. (2013) could be due to the decreased reliability of segmentations for the bilateral temporal poles and orbitofrontal cortices, 2 regions that are difficult to segment in young children (Kim et al. 2013); regions that we found have low correlations between manual and automatic segmentations (Supplementary Fig. 1). Very little is known about region-specific SA growth rates between age 2 and adulthood. Overall SA has been shown to peak at 9.7 years in males and 8.1 years in females (Raznahan et al. 2011), suggesting that SA expansion from the 69% of adult values we found at age 2, must occur between 2 years and 8–9 years of age at a considerably slower annual rate. Previous research has found that interindividual variation in adult brain size is almost exclusively due to SA rather than CT (Pakkenberg and Gundersen 1997), and our results demonstrate that these differences likely emerge very early in development. The appearance of early postnatal interindividual differences within our study cohorts can be seen in Figure 4B, which clearly shows that individuals with larger total cortical volume have larger total cortical SA at birth. Visual inspection of Supplementary Figure 2 shows that individuals with larger SA at birth continue to have relatively larger SA s at age 1 and 2.
It has been estimated that adult human cortical gray-matter volume is composed of 30% dendrites and 29% axons, while neuronal cell bodies, synapses, and glial cells contribute only 7.8, 6, and 14%, respectively (Bennett 2011). At birth, neurogenesis, cortical lamination, and gyrification are largely complete, and the rapid postnatal CT growth and SA expansion are likely the result of increases in dendritic arborization, axonal elongation and thickening, synaptogenesis, and glial proliferation. Synapse densities increase rapidly after birth with regional variability (Huttenlocher and Dabholkar 1997). Spine density in prefrontal cortex increases rapidly in early childhood, peaking at over 200% of adult values in later childhood (Petanjek et al. 2011). The complexity of the basal dendritic tree of pyramidal neurons in prefrontal cortex also increases rapidly after birth, with segment numbers reaching adult values by 1 month of age, and dendrite elongation reaching adult values by 12–15 months for layer V neurons and 2.5 years for layer IIIC neurons (Petanjek et al. 2008). Maturation of dendritic arborization and synapse and spine development are likely significant contributors to the increased CT and SA observed on our study. Other contributors would include glia cell proliferation and cortical axon development and myelination, though developmental studies in postnatal human cortex are lacking.
The principal element of cortical architecture is the cortical minicolumn (Buxhoeveden and Casanova 2002; Rakic 2009). CT has been found to be evolutionarily conserved, exhibiting only a ∼2-fold increase compared with a mouse while cortical SA exhibits a ∼1000-fold increase (Rakic 2009). In humans, this dramatic cortical SA expansion compared with other species is due to the addition of minicolumns within the cortical surface (Buxhoeveden and Casanova 2002; Rakic 2009). At birth, the width of the cortical minicolumn is approximately one-third adult size (Buxhoeveden and Casanova 2002), which is consistent with our results that find a 111% expansion of SA to 69% of adult values by age 2.
Previous studies of scaling relationships in the adult human brain have demonstrated that human cortices are not scaled versions of each other (Im et al. 2008; Toro et al. 2008). Brains with increased cortical volume have been shown to have greater numbers of neuronal and glial cells as well increased SA, increased sulcal depth, and increased region-specific cortical folding complexity (Pakkenberg and Gundersen 1997; Rilling and Insel 1999; Im et al. 2008; Toro et al. 2008). However, it has not known whether this relationship is present during the earliest stages of development. Our study shows that a strong and “adult-like” scaling relationship between total cortical volume and total cortical SA is already present at birth and persists through the period of rapid postnatal development. Mean CT, on the other hand, appears to have little relationship to total cortical volume at any age.
We found very different and noncorrelated growth patterns for CT and SA. A variety of studies indicate that CT and SA have distinct genetic underpinnings. Twin studies have shown high, though somewhat inconsistent, regional heritability for both SA and CT with apparently unrelated genetic correlation (Panizzon et al. 2009). A recent twin study utilizing a data-driven genetic clustering algorithm showed very little overlap between estimated genetic correlations for CT and SA (Chen et al. 2013). Most importantly, this study showed that even if clusters were anatomically overlapping that the underlying genetic influences appeared to be quite distinct (Chen et al. 2013). Differences in regional SA have been linked to polymorphisms of MECP2 and microcephaly genes in humans (Joyner et al. 2009; Rimol et al. 2010). In animal models, manipulation of transcription factors Ngn1/2 and Tlx in intermediate progenitor cells results in changes to thickness, but not to SA (Pontious et al. 2008). Alternatively, beta-catenin overexpression in rodent models leads to increased cortical SA but unchanged CT (Chenn and Walsh 2003). Arealization and expansion of specific cortical areas such as primary visual or sensory areas are also affected by specific genetic mutations of early developmental regulatory genes Emx2 and Pax 6 in rodents (Bishop et al. 2002). Recent studies in monozygotic healthy twins suggest that differences in birth weight can influence SA but not CT indicating that pre- and perinatal environmental influences may also have a different effects (Raznahan et al. 2012).
Comparison with genetic regionalization in human brain as evidenced in twin and transcriptome studies suggests that factors other than gene expression, such as functional circuit activity, may account for the observed differences in regional cortical growth rates in the first 2 years of life. Recent studies using a twin design have found that SA and CT have up to 12 measure-specific regional clusters of genetic correlations (Chen et al. 2011, 2012, 2013). While direct comparison is difficult due to different methodology, SA expansion rates in the first 2 years of life appear to reflect some of the observed genetic regional clusters (Chen et al. 2012), with some exceptions, such as the occipital cortex and perisylvian cortex which show genetic correlation, though have locally heterogeneous rates of SA expansion. Evidence from human transcriptome analyses also demonstrates regionalization of gene expression in the cortex, with related expression in primary sensorimotor cortices, including the pre- and postcentral cortices, Heschl's gyrus, and primary and secondary visual areas (Hawrylycz et al. 2012). In the first 2 years of life, these regions with similar gene expression profiles have variable growth rates for both CT and SA.
CT and SA are differentially affected in neurodevelopmental disorders. Children with ADHD show a developmental lag in CT and SA maturation compared with typically developing children (Shaw et al. 2007, 2012). Studies in schizophrenia have primarily seen patterns of cortical thinning in both childhood-onset and adult-onset cases (Rapoport et al. 2012; Rimol et al. 2012), though marginal reductions in SA have also been described (Gutiérrez-Galve et al. 2010; Rapoport et al. 2012). Brain overgrowth in autism is one of the most consistent findings in children between the ages of 2 and 4, and this cerebral enlargement is not present at birth yet emerges between 9 and 18 months (Courchesne et al. 2007). It is unclear whether or not overgrowth is due to aberrant increases in CT or SA, as studies have provided evidence for both (Hazlett et al. 2011; Mak-Fan et al. 2012). However, a recent study has called this into question, suggesting that the early brain overgrowth may not be a disease-specific biomarker but instead due to head circumference population norm biases in previous studies (Raznahan et al. 2013), at least with head circumference studies.
An interesting finding in this study was that sensory-specific association cortices, such as the superior occipital gyrus (visual association), superior/middle temporal gyrus (auditory association), and superior parietal gyrus (sensory/tactile association/spatial correspondence) all exhibited large growth in cortical SA. Evidence exists that each of these areas house topographic or representative maps for each corresponding sense (Romani et al. 1982; Silver and Kastner 2009). Rapid growth of SA in early childhood may reflect expansion of topographic maps, which are highly plastic and reorganized and refined with increased experience (Pienkowski and Eggermont 2011). Remarkably, many of these regions do not experience large amounts of CT growth, suggesting that topographic map plasticity may be regulated primarily by SA expansion. An exception to this general pattern is the insula, which houses a topographic map for viscerosensation, thermosensation, and nociception, important functions to a developing infant (Stephani et al. 2011) but does not experience rapid SA growth in early development. A potential hypothesis for this contradictory behavior could be that the insular cortex, due to its location, experiences growth restrictions and is therefore potentially limited to growth in a singular direction. There are 2 potential explanations: 1) due to the apparent structural importance of cortical lamination, the insula may grow predominantly in thickness as opposed to SA or 2) it is possible that the insula may increase in SA later in development. Future study on this important structure, which has been implicated in a variety of functions and neurodevelopmental disorders, is necessary to understand its role in cortical development and cortical networks (Nagai et al. 2007; Takahashi et al. 2009; Uddin and Menon 2009).
Image signal contrast changes dramatically from neonates to 1 or 2 year olds, which presents a challenge for tissue segmentation (Prastawa et al. 2005) and poses a potential limitation for this work. CT is defined by the segmentation's definition of the white–gray-matter boundary and the gray-pial surface boundary and is thus potentially sensitive to these changing contrasts. However, to address this issue, we employed a longitudinally guided segmentation algorithm (Wang et al. 2013) that we show is highly consistent with our manual segmentations (Supplementary Fig. 1). In this algorithm, the white–gray-matter boundary is defined by myelinated white matter at 1 and 2 years of age and by unmyelinated white matter at neonate, both of which have distinctly different intensity profiles from gray matter at each age (Dietrich et al. 1988).
Our study indicates that there is rapid development of the cortex in the first 2 years of life, with CT approaching 97% of adult values and SA approaching 70% of adult values. Periods of rapid growth are considered to be highly susceptible to genetic and environmental insults; the first years of life may be a period of high vulnerability. Interestingly, white-matter maturation follows a similar pattern, with rapid and tract-specific development of white-matter tract microstructure in the first 2 years of life (Geng et al. 2012) with much more slow and gradual maturation thereafter (Faria et al. 2010). Recent studies also indicate that most resting-state functional networks, including the default and attention control are established by age 2 years (Gao et al. 2011). These clinical studies, combined with postmortem studies of neuronal dendritic complexity and synapse development (Huttenlocher and Dabholkar 1997; Petanjek et al. 2008, 2011) suggest that by age 2 years, the fundamental structural and functional stage is largely set for future learning and neuroplasticity that will occur later in childhood. It is also likely that abnormal structural and functional networks associated with neuropsychiatric disorders are established in the first 2 years of life, and that interventions to modify abnormal development will need to be targeted to this period of rapid postnatal brain development.
Supplementary Material
Supplementary material can be found at: http://www.cercor.oxfordjournals.org/
Funding
This work was supported by NIH grants HD053000 (J.H.G.); MH070890 (J.H.G.); MH064065 (J.H.G.), EB006733 (D.S.), EB008374 (D.S.), EB009634 (D.S.), AG041721 (D.S.), MH100217 (D.S.), AG042599 (D.S.).
Notes
Conflict of Interest: None declared.
Supplementary Material
References
- Bennett MR. 2011. The prefrontal-limbic network in depression: a core pathology of synapse regression. Prog Neurobiol. 93:457–467. [DOI] [PubMed] [Google Scholar]
- Bishop KM, Rubenstein JLR, O'Leary DDM. 2002. Distinct actions of Emx1, Emx2, and Pax6 in regulating the specification of areas in the developing neocortex. J Neurosci. 22:7627–7638. [DOI] [PMC free article] [PubMed] [Google Scholar]
- Blumenthal JD, Zijdenbos A, Molloy E, Giedd JN. 2002. Motion artifact in magnetic resonance imaging: implications of automated analysis. Neuroimage. 16:89–92. [DOI] [PubMed] [Google Scholar]
- Brown TT, Kuperman JM, Chung Y, Erhart M, McCabe C, Hagler DJ, Venkatraman VK, Akshoomoff N, Amaral DG, Bloss CS, et al. 2012. Neuroanatomical assessment of biological maturity. Curr Biol. 22:1693–1998. [DOI] [PMC free article] [PubMed] [Google Scholar]
- Bullitt E, Zeng D, Gerig G, Aylward S, Joshi S, Smith JK, Lin W, Ewend MG. 2005. Vessel tortuosity and brain tumor malignancy: a blinded study. Acad Radiol. 12:1232–1240. [DOI] [PMC free article] [PubMed] [Google Scholar]
- Buxhoeveden DP, Casanova MF. 2002. The minicolumn hypothesis in neuroscience. Brain. 125:935–951. [DOI] [PubMed] [Google Scholar]
- Chen C-H, Fiecas M, Gutierrez ED, Panizzon MS, Eyler LT, Vuoksimma E, Thompson WK, Fennema-Notestine C, Hagler DJ, Jernigan TL, et al. 2013. Genetic topography of brain morphology. Proc Natl Acad Sci USA. 110:17089–17094. [DOI] [PMC free article] [PubMed] [Google Scholar]
- Chen C-H, Gutierrez ED, Thompson W, Panizzon MS, Jernigan TL, Eyler LT, Fennema-Notestine C, Jak AJ, Neale MC, Franz CE, et al. 2012. Hierarchical genetic organization of human cortical surface area. Science. 335:1634–1636. [DOI] [PMC free article] [PubMed] [Google Scholar]
- Chen C-H, Panizzon MS, Eyler LT, Jernigan TL, Thompson W, Fennema-Notestine C, Jak AJ, Neale MC, Franz CE, Hamza S, et al. 2011. Genetic influences on cortical regionalization in the human brain. Neuron. 72:537–544. [DOI] [PMC free article] [PubMed] [Google Scholar]
- Chenn A, Walsh CA. 2003. Increased neuronal production, enlarged forebrains and cytoarchitectural distortions in beta-catenin overexpressing transgenic mice. Cereb Cortex. 13:599–606. [DOI] [PubMed] [Google Scholar]
- Courchesne E, Pierce K, Schumann CM, Redcay E, Buckwalter JA, Kennedy DP, Morgan J. 2007. Mapping early brain development in autism. Neuron. 56:399–413. [DOI] [PubMed] [Google Scholar]
- Dietrich RB, Bradley WG, Zaragoza EJ, Otto RJ, Taira RK, Wilson GH, Kangarloo H. 1988. MR evaluation of early myelination patterns in normal and developmentally delayed infants. Am J Roentgen. 150:889–896. [DOI] [PubMed] [Google Scholar]
- Economo C, Koskinas GN. 1925. Die Cytoarchitektonik der Hirnrinde des erwachsenen Menschen. Wien: Springer Verlag. [Google Scholar]
- Faria AV, Zhang J, Oishi K, Li X, Jiang H, Akhter K, Hermoye L, Lee S-K, Hoon A, Stashinko E, et al. 2010. Atlas-based analysis of neurodevelopment from infancy to adulthood using diffusion tensor imaging and applications for automated abnormality detection. Neuroimage. 52:415–428. [DOI] [PMC free article] [PubMed] [Google Scholar]
- Fischl B, Dale AM. 2000. Measuring the thickness of the human cerebral cortex from magnetic resonance images. Proc Natl Acad Sci USA. 97:11050–11055. [DOI] [PMC free article] [PubMed] [Google Scholar]
- Gao W, Gilmore JH, Giovanello KS, Smith JK, Shen D, Zhu H, Lin W. 2011. Temporal and spatial evolution of brain network topology during the first two years of life. PLoS One. 6:e25278. [DOI] [PMC free article] [PubMed] [Google Scholar]
- Geng X, Gouttard S, Sharma A, Gu H, Styner M, Lin W, Gerig G, Gilmore JH. 2012. Quantitative tract-based white matter development from birth to age 2 years. Neuroimage. 61:542–557. [DOI] [PMC free article] [PubMed] [Google Scholar]
- Gilmore JH, Lin W, Prastawa MW, Looney CB, Vetsa YSK, Knickmeyer RC, Evans DD, Smith JK, Hamer RM, Lieberman JA, et al. 2007. Regional gray matter growth, sexual dimorphism, and cerebral asymmetry in the neonatal brain. J Neurosci. 27:1255–1260. [DOI] [PMC free article] [PubMed] [Google Scholar]
- Gilmore JH, Schmitt JE, Knickmeyer RC, Smith JK, Lin W, Styner M, Gerig G, Neale MC. 2010. Genetic and environmental contributions to neonatal brain structure: a twin study. Hum Brain Mapp. 31:1174–1182. [DOI] [PMC free article] [PubMed] [Google Scholar]
- Gilmore JH, Shi F, Woolson SL, Knickmeyer RC, Short SJ, Lin W, Zhu H, Hamer RM, Styner M, Shen D. 2011. Longitudinal development of cortical and subcortical gray matter from birth to 2 years. Cereb Cortex. 22:2478–2485. [DOI] [PMC free article] [PubMed] [Google Scholar]
- Gutiérrez-Galve L, Wheeler-Kingshott CAM, Altmann DR, Price G, Chu EM, Leeson VC, Lobo A, Barker GJ, Barnes TRE, Joyce EM, et al. 2010. Changes in the frontotemporal cortex and cognitive correlates in first-episode psychosis. Biol Psychiatry. 68:51–60. [DOI] [PMC free article] [PubMed] [Google Scholar]
- Hawrylycz MJ, Lein ES, Guillozet-Bongaarts AL, Shen EH, Ng L, Miller JA, van de Lagemaat LN, Smith KA, Ebbert A, Riley ZL, et al. 2012. An anatomically comprehensive atlas of the adult human brain transcriptome. Nature. 489:391–399. [DOI] [PMC free article] [PubMed] [Google Scholar]
- Hazlett HC, Gu H, McKinstry RC, Shaw DWW, Botteron KN, Dager SR, Styner M, Vachet C, Gerig G, Paterson SJ, et al. IBIS Network. 2012. Brain volume findings in 6-month-old infants at high familial risk for autism. Am J Psychiatry. 169:601–608. [DOI] [PMC free article] [PubMed] [Google Scholar]
- Hazlett HC, Poe MD, Gerig G, Styner M, Chappell C, Smith RG, Vachet C, Piven J. 2011. Early brain overgrowth in autism associated with an increase in cortical surface area before age 2 years. Arch Gen Psychiatry. 68:467–476. [DOI] [PMC free article] [PubMed] [Google Scholar]
- Hill J, Inder T, Neil J, Dierker D, Harwell J, Van Essen D. 2010. Similar patterns of cortical expansion during human development and evolution. Proc Natl Acad Sci USA. 107:13135–13140. [DOI] [PMC free article] [PubMed] [Google Scholar]
- Huttenlocher PR, Dabholkar AS. 1997. Regional differences in synaptogenesis in human cerebral cortex. J Comp Neurol. 387:167–178. [DOI] [PubMed] [Google Scholar]
- Im K, Lee J, Lyttelton O, Kim SH, Evans AC, Kim SI. 2008. Brain size and cortical structure in the adult human brain. Cereb Cortex. 18:2181–2191. [DOI] [PubMed] [Google Scholar]
- Joyner AH, J CR, Bloss CS, Bakken TE, Rimol LM, Melle I, Agartz I, Djurovic S, Topol EJ, Schork NJ, et al. 2009. A common MECP2 haplotype associates with reduced cortical surface area in humans in two independent populations. Proc Natl Acad Sci USA. 106:15483–15488. [DOI] [PMC free article] [PubMed] [Google Scholar]
- Karama S, Colom R, Johnson W, Deary IJ, Haier R, Waber DP, Lepage C, Ganjavi H, Jung R, Evans AC, Brain Development Cooperative Group. 2011. Cortical thickness correlates of specific cognitive performance accounted for by the general factor of intelligence in healthy children aged 6 to 18. Neuroimage. 55:1443–1453. [DOI] [PMC free article] [PubMed] [Google Scholar]
- Kim SH, Fonov VS, Dietrich C, Vachet C, Hazlett HC, Smith RG, Graves MM, Piven J, Gilmore JH, Dager SR, et al. IBIS Network. 2013. Adaptive prior probability and spatial temporal intensity change estimation for segmentation of the one-year-old human brain. J Neurosci Methods. 212:43–55. [DOI] [PMC free article] [PubMed] [Google Scholar]
- Knickmeyer RC, Gouttard S, Kang C, Evans D, Wilber K, Smith JK, Hamer RM, Lin W, Gerig G, Gilmore JH. 2008. A structural MRI study of human brain development from birth to 2 years. J Neurosci. 28:12176–12182. [DOI] [PMC free article] [PubMed] [Google Scholar]
- Li G, Nie J, Wang L, Shi F, Lin W, Gilmore JH, Shen D. 2013. Mapping region-specific longitudinal cortical surface expansion from birth to 2 years of age. Cereb Cortex. 23:2724–2733. [DOI] [PMC free article] [PubMed] [Google Scholar]
- Li G, Nie J, Wang L, Shi F, Lyall AE, Lin W, Gilmore JH, Shen D. 2014. Mapping longitudinal hemispheric structural asymmetries of the human cerebral cortex from birth to 2 years of age. Cereb Cortex. 24:1289–1300. [DOI] [PMC free article] [PubMed] [Google Scholar]
- Li G, Nie J, Wu G, Wang Y, Shen D, Alzheimer's Disease Neuroimaging Initiative. 2012. Consistent reconstruction of cortical surfaces from longitudinal brain MR images. Neuroimage. 59:3805–3820. [DOI] [PMC free article] [PubMed] [Google Scholar]
- Looney CB, Smith JK, Merck LH, Wolfe HM, Chescheir NC, Hamer RM, Gilmore JH. 2006. Intracranial hemorrhage in asymptomatic neonates: prevalence on MR images and relationship to obstetric and neonatal risk factors. Radiology. 242:535–541. [DOI] [PubMed] [Google Scholar]
- Mak-Fan KM, Taylor MJ, Roberts W, Lerch JP. 2012. Measures of cortical grey matter structure and development in children with autism spectrum disorder. J Autism Dev Disord. 42:419–427. [DOI] [PubMed] [Google Scholar]
- Mullen EM. 1995. Mullen scales of early learning, AGS edition: manual and item administrative books. Circle Pines: (MN: ): American Guidance Services, Inc; 1–92. [Google Scholar]
- Nagai M, Kishi K, Kato S. 2007. Insular cortex and neuropsychiatric disorders: a review of recent literature. Eur Psychiatry. 22:387–394. [DOI] [PubMed] [Google Scholar]
- Narr KL, Woods RP, Thompson PM, Szeszko P, Robinson D, Dimtcheva T, Gurbani M, Toga AW, Bilder RM. 2007. Relationships between IQ and regional cortical gray matter thickness in healthy adults. Cereb Cortex. 17:2163–2171. [DOI] [PubMed] [Google Scholar]
- Pakkenberg B, Gundersen HJ. 1997. Neocortical neuron number in humans: effect of sex and age. J Comp Neurol. 384:312–320. [PubMed] [Google Scholar]
- Panizzon MS, Fennema-Notestine C, Eyler LT, Jernigan TL, Prom-Wormley E, Neale M, Jacobson K, Lyons MJ, Grant MD, Franz CE, et al. 2009. Distinct genetic influences on cortical surface area and cortical thickness. Cereb Cortex. 19:2728–2735. [DOI] [PMC free article] [PubMed] [Google Scholar]
- Petanjek Z, Judaš M, Kostović I, Uylings HBM. 2008. Lifespan alterations of basal dendritic trees of pyramidal neurons in the human prefrontal cortex: a layer-specific pattern. Cereb Cortex. 18:915–929. [DOI] [PubMed] [Google Scholar]
- Petanjek Z, Judaš M, Šimic G, Rasin MR, Uylings HBM, Rakic P, Kostović I. 2011. Extraordinary neoteny of synaptic spines in the human prefrontal cortex. Proc Natl Acad Sci USA. 108:13281–13286. [DOI] [PMC free article] [PubMed] [Google Scholar]
- Pienkowski M, Eggermont JJ. 2011. Cortical tonotopic map plasticity and behavior. Neurosci Biobehav Rev. 35:2117–2128. [DOI] [PubMed] [Google Scholar]
- Pontious A, Kowalczyk T, Englund C, Hevner RF. 2008. Role of intermediate progenitor cells in cerebral cortex development. Dev Neurosci. 30:24–32. [DOI] [PubMed] [Google Scholar]
- Prastawa M, Gilmore JH, Lin W, Gerig G. 2005. Automatic segmentation of MR images of the developing newborn brain. Med Image Anal. 9:457–466. [DOI] [PubMed] [Google Scholar]
- Rakic P. 2009. Evolution of the neocortex: a perspective from developmental biology. Nat Rev Neurosci. 10:724–735. [DOI] [PMC free article] [PubMed] [Google Scholar]
- Rapoport JL, Giedd JN, Gogtay N. 2012. Neurodevelopmental model of schizophrenia: update 2012. Mol Psychiatry. 17:1128–1238. [DOI] [PMC free article] [PubMed] [Google Scholar]
- Raznahan A, Greenstein D, Lee NR, Clasen LS, Giedd JN. 2012. Prenatal growth in humans and postnatal brain maturation into late adolescence. Proc Natl Acad Sci USA. 109:11366–11371. [DOI] [PMC free article] [PubMed] [Google Scholar]
- Raznahan A, Shaw P, Lalonde F, Stockman M, Wallace GL, Greenstein D, Clasen L, Gogtay N, Giedd JN. 2011. How does your cortex grow? J Neurosci. 31:7174–7177. [DOI] [PMC free article] [PubMed] [Google Scholar]
- Raznahan A, Wallace GL, Antezana L, Greenstein D, Lenroot R, Thurm A, Gozzi M, Spence S, Martin A, Swedo SE, et al. 2013. Compared to what? Early brain overgrowth in autism and the perils of population norms. Biol Psychiatry. 74:563–575. [DOI] [PMC free article] [PubMed] [Google Scholar]
- Rilling JK, Insel TR. 1999. The primate neocortex in comparative perspective using magnetic resonance imaging. J Hum Evol. 37:191–223. [DOI] [PubMed] [Google Scholar]
- Rimol LM, Agartz I, Djurovic S, Brown AA, Roddey JC, Kähler AK, Mattingsdal M, Athanasiu L, Joyner AH, Schork NJ, et al. Alzheimer's Disease Neuroimaging Initiative. 2010. Sex-dependent association of common variants of microcephaly genes with brain structure. Proc Natl Acad Sci USA. 107:384–388. [DOI] [PMC free article] [PubMed] [Google Scholar]
- Rimol LM, Nesvåg R, Hagler DJ, Bergmann O, Fennema-Notestine C, Hartberg CB, Haukvik UK, Lange E, Pung CJ, Server A, et al. 2012. Cortical volume, surface area, and thickness in schizophrenia and bipolar disorder. Biol Psychiatry. 71:552–560. [DOI] [PubMed] [Google Scholar]
- Romani GL, Williamson SJ, Kaufman L. 1982. Tonotopic organization of the human auditory cortex. Science. 216:1339–1340. [DOI] [PubMed] [Google Scholar]
- Shaw P, Eckstrand K, Sharp W, Blumenthal J, Lerch JP, Greenstein D, Clasen L, Evans A, Giedd J, Rapoport JL. 2007. Attention-deficit/hyperactivity disorder is characterized by a delay in cortical maturation. Proc Natl Acad Sci USA. 104:19649–19654. [DOI] [PMC free article] [PubMed] [Google Scholar]
- Shaw P, Greenstein D, Lerch J, Clasen L, Lenroot R, Gogtay N, Evans A, Rapoport J, Giedd J. 2006. Intellectual ability and cortical development in children and adolescents. Nature. 440:676–679. [DOI] [PubMed] [Google Scholar]
- Shaw P, Kabani NJ, Lerch JP, Eckstrand K, Lenroot R, Gogtay N, Greenstein D, Clasen L, Evans A, Rapoport JL, et al. 2008. Neurodevelopmental trajectories of the human cerebral cortex. J Neurosci. 28:3586–3594. [DOI] [PMC free article] [PubMed] [Google Scholar]
- Shaw P, Malek M, Watson B, Sharp W, Evans A, Greenstein D. 2012. Development of cortical surface area and gyrification in attention-deficit/hyperactivity disorder. Biol Psychiatry. 72:191–197. [DOI] [PMC free article] [PubMed] [Google Scholar]
- Shen DG, Davatzikos C. 2002. HAMMER: hierarchical attribute matching mechanism for elastic registration. IEEE Trans Med Imaging. 21:1421–1439. [DOI] [PubMed] [Google Scholar]
- Shi F, Wang L, Dai Y, Gilmore JH, Lin W, Shen D. 2012. Pediatric brain extraction using learning-based meta-algorithm. Neuroimage. 62:1975–1986. [DOI] [PMC free article] [PubMed] [Google Scholar]
- Shi F, Yap P-T, Wu G, Jia H, Gilmore JH, Lin W, Shen D. 2011. Infant brain atlases from neonates to 1- and 2-year-olds. PLoS One. 6:e18746. [DOI] [PMC free article] [PubMed] [Google Scholar]
- Shrout PE, Fleiss JL. 1979. Intraclass correlations: uses in assessing rater reliability. Psychol Bull. 86:420–428. [DOI] [PubMed] [Google Scholar]
- Silver MA, Kastner S. 2009. Topographic maps in human frontal and parietal cortex. Trends Cogn Sci. 13:488–495. [DOI] [PMC free article] [PubMed] [Google Scholar]
- Simpson PM, Phillips PR, Lensing S, Hamer R. 1998. Simpson: reliably assessing reliability with SAS software. Proceedings of the 23rd Annual SAS Users Group International, Nashville p. 928–937. [Google Scholar]
- Sowell ER. 2004. Longitudinal mapping of cortical thickness and brain growth in normal children. J Neurosci. 24:8223–8231. [DOI] [PMC free article] [PubMed] [Google Scholar]
- Stephani C, Fernandez-Baca Vaca G, Maciunas R, Koubeissi M, Lüders HO. 2011. Functional neuroanatomy of the insular lobe. Brain Struct Funct. 216:137–149. [DOI] [PMC free article] [PubMed] [Google Scholar]
- Takahashi T, Wood SJ, Yung AR, Phillips LJ, Soulsby B, McGorry PD, Tanino R, Zhou S, Suzuki M. 2009. Insular cortex gray matter changes in individuals at ultra-high-risk of developing psychosis. Schizophr Res. 111:94–102. [DOI] [PubMed] [Google Scholar]
- Toro R, Perron M, Pike B, Richer L, Veillette S, Pausova Z, Paus T. 2008. Brain size and folding of the human cerebral cortex. Cereb Cortex. 18:2352–2357. [DOI] [PubMed] [Google Scholar]
- Tzourio-Mazoyer N, Landeau B, Papathanassiou D, Crivello F, Etard O, Delcroix N, Mazoyer B, Joliot M. 2002. Automated anatomical labeling of activations in SPM using a macroscopic anatomical parcellation of the MNI MRI single-subject brain. NeuroImage. 15:273–289. [DOI] [PubMed] [Google Scholar]
- Uddin LQ, Menon V. 2009. The anterior insula in autism: under-connected and under-examined. Neurosci Biobehav Rev. 33:1193–1203. [DOI] [PMC free article] [PubMed] [Google Scholar]
- Wang L, Shi F, Yap P-T, Lin W, Gilmore JH, Shen D. 2013. Longitudinally guided level sets for consistent tissue segmentation of neonates. Hum Brain Mapp. 34:956–972. [DOI] [PMC free article] [PubMed] [Google Scholar]
Associated Data
This section collects any data citations, data availability statements, or supplementary materials included in this article.