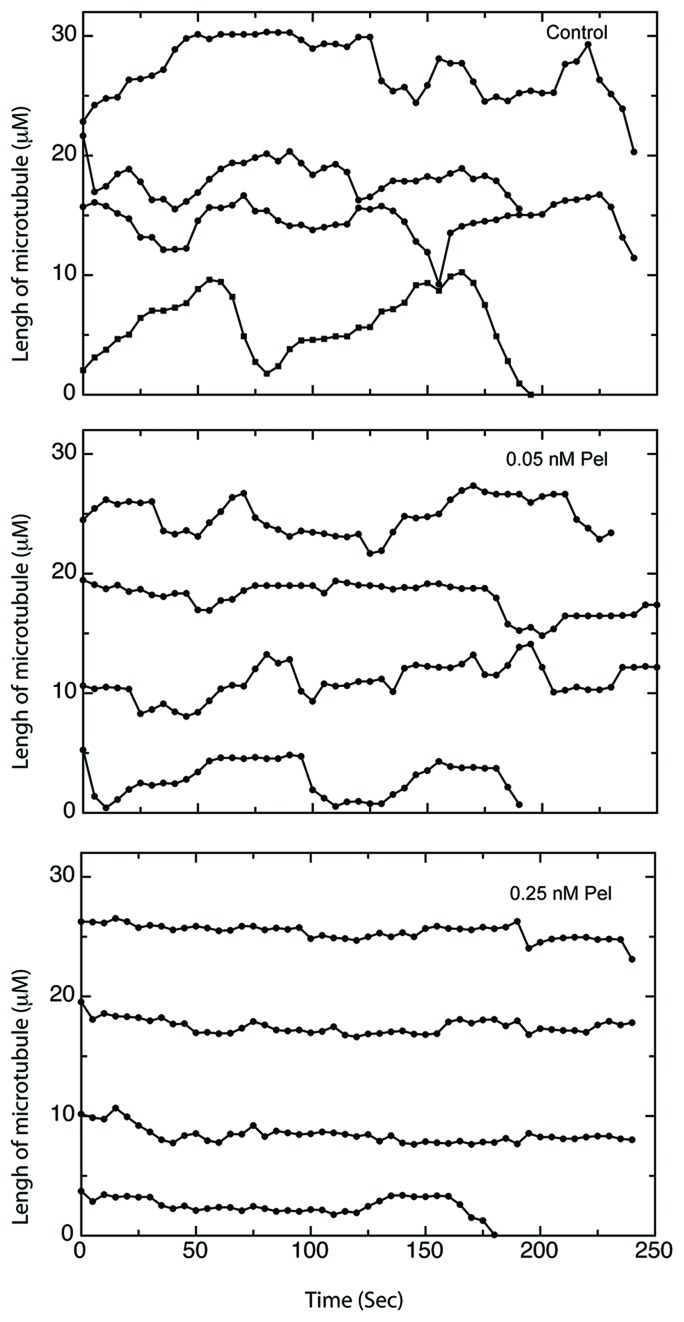
Figure 3. Life history plots of microtubules at anti-migratory concentrations of peloruside A.
HUVEC transfected with EGFP-MAP4 were treated with varying concentrations of peloruside A and microtubule lengths were measured as a function of time to generate life history plots. Traces for 4 separate microtubules are shown in each panel and their lengths at time zero were measured from arbitrary points that do not reflect their actual total lengths in the cell. Untreated microtubules (Control) were seen to grow and shorten repeatedly over the time course of the experiment. In contrast, microtubules treated with 0.05 nM peloruside A (0.05 nM Pel) exhibited fewer changes in length, and microtubules treated with 0.25 nM peloruside A (0.25 nM Pel) exhibited little to no changes in length.

