Abstract
Transverse and longitudinal relaxation times (T1ρ and T1) have been widely exploited in NMR to probe the binding of ligands and putative drugs to target proteins. We have shown recently that long-lived states (LLS) can be more sensitive to ligand binding. LLS can be excited if the ligand comprises at least two coupled spins. Herein we broaden the scope of ligand screening by LLS to arbitrary ligands by covalent attachment of a functional group, which comprises a pair of coupled protons that are isolated from neighboring magnetic nuclei. The resulting functionalized ligands have longitudinal relaxation times T1(1H) that are sufficiently long to allow the powerful combination of LLS with dissolution dynamic nuclear polarization (D-DNP). Hyperpolarized weak “spy ligands” can be displaced by high-affinity competitors. Hyperpolarized LLS allow one to decrease both protein and ligand concentrations to micromolar levels and to significantly increase sample throughput.
Keywords: drug discovery, dynamic nuclear polarization, long-lived states, NMR spectroscopy
Introduction
The first step of drug discovery is commonly referred to as lead identification. Screening techniques such as enzyme-linked immunosorbent assays (ELISA),[1] surface plasmon resonance (SPR, also known under the trade name Biacore),[2] isothermal titration calorimetry (ITC),[3] fluorescence anisotropy,[4] and an ever-expanding range of nuclear magnetic resonance (NMR) techniques[5] allow one to recognize ligands or fragments thereof in extensive libraries of chemical compounds. The binding of a ligand to a target protein:
| (1) |
can be described by a dissociation constant KD that gives a measure of the affinity:[6]
| (2) |
in which [L], [P], and [PL] are the respective concentrations of the free ligand, the free protein, and the protein–ligand complex, and kon and koff are second- and first-order rate constants of the association and dissociation reactions. In NMR, a first-order exchange rate is defined as kex=(kon[P]+koff). If the binding site of the protein is saturated by excess ligand, that is, if [PL]≪[L], one has kex≈koff. Typically, good drugs have small dissociation constants with KD<1 μm.
Because one can choose from a wide range of observable parameters, NMR spectroscopy offers several methods to study interactions between small ligand molecules and macromolecular targets. It is possible to extract dissociation constants[7] and to obtain structural information about the protein and its complex.[8] Provided the exchange between the free and bound forms of the ligand is faster than the difference of their resonance frequencies,5a, [9] i.e., when kex≈koff≫(π/ )Δν, where Δν is the chemical shift difference (in Hz) of the signals in the bound and free states, any observable quantity ξobs, be it a frequency or a relaxation rate, is determined by a weighted average of the free and bound forms:[10]
| (3) |
for which Xbound and Xfree are the mole fractions of the bound and free ligands. The larger the contrast,
| (4) |
the more sensitive the frequency or relaxation rate is to ligand–protein binding. This expression is more general than the definition of contrast that we proposed in our first report on the subject.[11]
Several NMR methods based on such a contrast are extensively used nowadays to determine dissociation constants of ligand–protein interactions. The quantity ξobs can be determined by the chemical shifts of one or more selected nuclei of either target proteins[12] or ligands,[13] the translational or rotational diffusion constant of the ligand,[14] the auto-relaxation rates T1, T2 and T1ρ, the rate of magnetization transfer by cross-relaxation (Overhauser effect) between protons belonging to the ligand,[15] the saturation transfer from proteins to ligands determined by difference spectroscopy,[16] or “water-LOGSY” that exploits differences of the rate of transfer of magnetization from bulk water to free or bound ligands by cross-relaxation.[17] Several of these methods rely on differences in rotational correlation times between the free ligand and the protein–ligand complex.[18]
We recently demonstrated that so-called long-lived states (LLS), also known as singlet states (SS) in isolated two-spin systems, can be used very effectively to investigate protein–ligand interactions.[11] Indeed, the protracted lifetimes TLLS of these nuclear spin states are exquisitely sensitive to binding to a protein, giving a dramatic contrast between the lifetimes TLLS of the bound and free forms. Similar rules apply to the lifetimes TLLC of so-called long-lived coherences (LLC).[19] A drawback of both LLS and LLC methods is that the ligands should contain reasonably isolated two-spin systems. We show in this work that it is possible to overcome this limitation by covalent attachment of a “spin-pair label” carrying an isolated two-spin system.
The requirement of rapid exchange underlying Equation (3) implies that “direct” NMR binding experiments cannot be used for ligands with strong affinities (KD<100 μm), although good drugs typically have much smaller dissociation constants KD<1 μm. Fortunately, so-called “competition binding” experiments can be used to determine small dissociation constants KD of competitors that can displace weak “spy ligands” from the binding sites of target proteins. We show here how a weak ligand with a spin-pair label capable of sustaining an LLS or LLC can be used as a “spy ligand” in competition experiments. If a competitor partly displaces the spy ligand, the lifetimes TLLS and TLLC of the spy ligand can be dramatically extended. A set of 1D experiments allows one to screen and rank extensive libraries of compounds. Such “indirect” competition binding experiments[20] open the way to the identification of high-affinity ligands with KD<1 μm, typical of effective drugs. Remarkably, competition binding experiments can also be used to determine poor binding constants KD>10 mm that are typical of weakly binding “lead compounds” that tend to be difficult to identify in the early stages of drug discovery.[21]
It is clearly desirable to use low concentrations of both proteins and ligands, not only to save expensive materials, but also to avoid protein aggregation and problems with mixtures (“cocktails”) in the manner of combinatorial chemistry. The quest for low ligand concentrations is generally limited by poor sensitivity of NMR. At concentrations [L]<100 μm, NMR spectra with sufficient signal-to-noise ratios require extensive signal averaging. Hyperpolarization of nuclear spins by dissolution dynamic nuclear polarization (D-DNP)[22] can overcome this problem. By microwave irradiation of samples at temperatures close to T=1.2 K, the polarization of electron spins can be transferred to protons or other nuclei, followed by rapid dissolution of the hyperpolarized samples and their transfer to a high-resolution NMR spectrometer for detection. The technique has not been very popular for 1H and 19F nuclei so far, because rapid T1 relaxation tends to cause loss of polarization during the transfer from the polarizer to the spectrometer. Enhancements εDNP up to five orders of magnitude can be obtained for nuclei with low gyromagnetic ratios, while enhancements 100<εDNP<1000 can be achieved for 1H or 19F nuclei.[23] Spin-pair-labeled molecules containing isolated spins designed for LLS and LLC experiments also feature fairly long T1 values which also makes them suitable for dissolution DNP.
Long-lived states experiments
Long-lived states (LLS), first described by Levitt and co-workers,[24] have the unique property that their populations relax with time constants that can be much longer than longitudinal relaxation time constants (TLLS≫T1). For pairs of protons, TLLS/T1 ratios as large as 60 have been observed in R–CH=CH–R’ systems. To perform an LLS experiment, one has to: 1) Start with a system comprising two nonequivalent spins and convert their populations into a density operator corresponding to a singlet–triplet imbalance (Figure 1 a, 1–2);24a, [25] 2) Sustain the LLS by suppressing the effects of the chemical shift difference (Figure 1 a, 2–3), usually by applying a resonant radiofrequency (rf) field during a sustaining time τm, with the carrier (νrf) placed halfway between the chemical shifts of the two spins;24a,d, [26] LLS are efficiently sustained by an rf field that is at least five times larger than the chemical shift difference between the two spins. 3) After turning off the resonant rf field, a suitable pulse sequence can convert the singlet–triplet imbalance back to observable magnetization (Figure 1 a, 3–4). The lifetime of the LLS can be determined by fitting the signal intensities recorded as a function of τm to the exponential function exp(−τm/TLLS).
Figure 1.
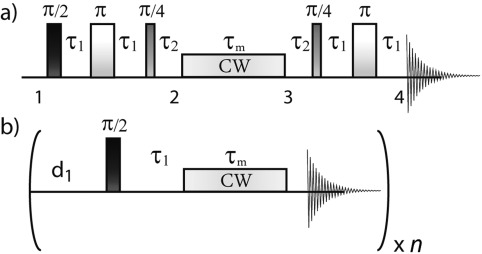
Experiments for long-lived states (LLS) and long-lived coherences (LLC). a) Pulse sequence used to excite, sustain, and observe LLS.[25] An rf field is applied between time points 2 and 3 with the carrier halfway between the chemical shifts of the two spins in order to make them effectively equivalent. The conversion is most efficient if τ1=1/4 JIS and τ2=1/2ΔνIS. b) Pulse sequence designed to excite, sustain, and detect LLC. Typically, τ1=1/2ΔνIS to achieve an efficient conversion of Iy+Sy into Ix−Sx, and d1=5T1. A variant for single-scan LLC spectroscopy is described in the Supporting Information.
On the other hand, long-lived coherences (LLC)[19] have the property that they relax with time constants that can be much longer than transverse relaxation time constants (TLLC≫T2). The principles of LLC spectroscopy are briefly reviewed in the Supporting Information.
Results and Discussion
Enhanced contrast of LLS
In direct titration experiments, i.e., in the absence of competitors, the relaxation rate of a (weak or intermediate) spy ligand is measured by titration as a function of the protein-to-ligand ratio. An LLS associated with a ligand L bound to a target protein P will relax faster, that is, TLLSbound≪TLLSfree. The relaxation properties of free and bound ligands contribute to increase the contrast C(TLLS) of the method. According to Equation (4), one may define the contrast as:
| (5) |
where RLLSobs and TLLSobs are the averaged parameters observed for the rapid equilibrium between free and bound forms of the ligand in the sense of Equation (3), while RLLSfree and TLLSfree refer to the free ligand in the absence of protein. By analogy, an expression for the contrast C(TLLC) of long-lived coherences can be derived from Equation (5) by replacing LLS with LLC.
To demonstrate the enhancement of the contrast C(TLLS) with respect to the contrast C(T1) and C(T1ρ), binding experiments were carried out for a 1 mm solution of the tripeptide ligand glycine-glycine-arginine (GGR) in the presence of its protein target trypsin in the range 0.5<[P]<50 μm, using various methods (TLLS, nonselective T1 and nonselective T1ρ). Figure 2 shows that the LLS method can work with a protein–ligand ratio that is ∼25-fold lower than required for the well-known nonselective T1ρ method, whereas the nonselective T1 contrast remains below C(T1)<10 % even at the highest protein concentration [P]=50 μm.
Figure 2.
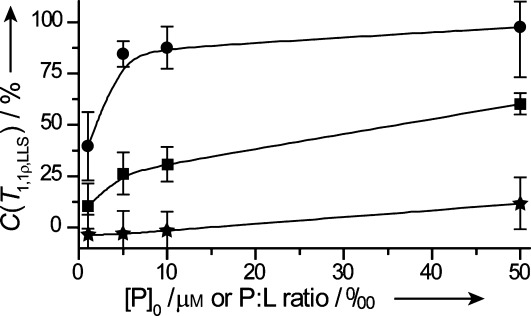
Contrast of life-times TLLS, T1, and T1ρ of ligands binding to proteins. Experimental contrast for TLLS (•), non-selective T1ρ (▪), and non-selective T1 (★) methods for the diastereotopic pair of protons on the middle glycine residue of the tripeptide GGR in a solution with a fixed concentration [L]=1 mm and a variable trypsin concentration 0.5 μm<[P]0<50 μm in D2O at 8 °C at 11.7 T (500 MHz for protons).
Spin-pair labeling
A drawback of screening by LLS or LLC is that the ligands must carry a pair of nonequivalent spins −1/2. We therefore developed a synthetic labeling strategy comprising two steps: 1) the identification of a “spy ligand” that binds weakly to the target protein, and 2) the functionalization (see Supporting Information) of this ligand by attaching a “spin-pair label” that can carry LLS or LLC. By way of illustration, 3-bromothiophene-2-carboxylic acid (“BT”), which is known to have long lifetimes TLLS and TLLC,[27] was covalently attached to the tripeptide GGR, a weak binder for trypsin. The resulting spin-pair-labeled tripeptide is henceforth called BT-GGR.
Despite some steric effects and long-range dipolar relaxation mechanisms in the spin-pair-labeled tripeptide BT-GGR, the two aromatic protons of the bromothiophene group retain a remarkably long lifetime TLLSfree(BT)=11.7±0.7 s. In this particular peptide, the diastereotopic pairs of α-protons on the two glycine residues of BT-G1G2R can also be used to excite LLS and have lifetimes TLLSfree(G1)=10.4±0.5 s and TLLSfree(G2)=9.3±0.5 s (see Figure 3 b).
Figure 3.
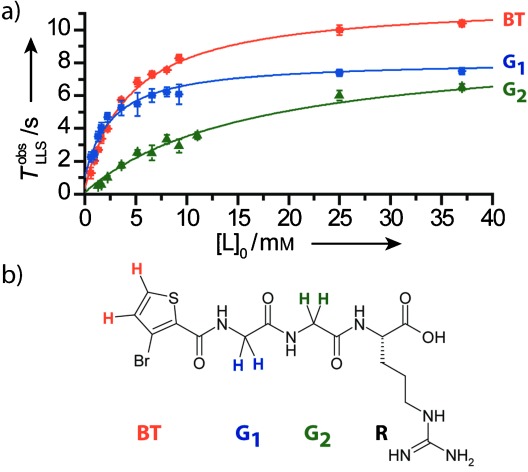
LLS titration experiments. a) Observed LLS lifetimes of the three proton pairs on the spin-pair-labeled tripeptide BT-GGR as a function of the ligand concentration, in the presence of 25 μm trypsin in D2O at 25 °C and 11.7 T (500 MHz for protons). b) Pairs of protons capable of sustaining LLS in BT-GGR: on bromothiophene BT (orange), on the N-terminal glycine G1 (blue) and on central glycine G2 (green) which is close to the arginine residue that binds to the protein.
The observed averaged relaxation rate of LLS in the presence of a protein can be derived from Equation (3), using the definition of KD of Equation (2) and assuming saturation, i.e., [L]0≫[PL], so that [L]0−[PL]≈[L]0:
| (6) |
If one measures RLLSobs as a function of the concentration [L]0 of a ligand while [P]0 is kept constant, it is possible to determine KD by fitting to Equation (6). The spin-pair-labeled spy ligand L=BT-GGR was added to a solution of [P]0=25 μm trypsin over a range 0.5<[L]0<40 mm. At each concentration [L]0, the observed relaxation times TLLSobs=1/RLLSobs of three different pairs of protons (belonging to the bromothiophene group and to the middle and the terminal glycines) were measured using the pulse sequence of Figure 1. Figure 3 a shows how the titration curves can be fitted to Equation (6). As expected, nearly the same dissociation constants were obtained for the three proton pairs that can sustain LLS in BT-GGR: KD(BT)=0.18±0.03 mm, KD(G1)=0.24±0.01 mm, KD(G2)=0.21±0.02 mm. The LLS fitted lifetime of G2 (i.e., the glycine closest to the arginine) in the bound form (TLLSbound(G2)=16±1 ms) is shorter than for the two other LLS sites (TLLSbound(BT)=90±20 ms, TLLSbound(G1)=110±40 ms). This shorter TLLSbound is believed to be due to the fact that the arginine, and thus also the glycine G2, enter more deeply into the active site of trypsin.
Competition binding experiments
Once a weak ligand has been identified and characterized by titration, it can be used as a “spy ligand” in competition experiments.[20] When stronger ligands are added, the lifetime TLLSobs of the spy ligand give information about the dissociation constant KDstrong of the competitor. Note that the competitor need not contain any spin pairs that can sustain an LLS or LLC. Moreover, as the changes in TLLSobs need only be observed for the weak ligand, there are no requirements for the stronger ligands to fulfill the fast-exchange condition. This implies that the accessible range of dissociation constants KDstrong of the competitor can lie in a range 0.1 nm<KDstrong<100 nm. When KDstrong<0.1 nm, one can detect a large effect on the lifetime TLLSobs of the weak spy ligand, but it is not possible to rank the ligands according to their affinities. As the strong competitors themselves need not be observed directly, their concentration can also be lowered, typically to the same level as the concentration of the protein, that is, to [L]0≈[P]0, which may typically be in the single-digit micromolar range.
When a stronger competitor blocks the active site of the protein, the weak spy ligand will no longer have free access to its target. The concentration [P]free of the protein that remains free to bind the weak ligand can be derived from the definition of the dissociation constant KDstrong of the competitor:
| (7) |
where b=([P]0+[Lstrong]0+KDstrong) and [Lstrong]0 is the total concentration of the competitor. As the amount of free available protein decreases, the effects of the protein on the lifetime TLLSobs of the weak spy ligand will be less pronounced. Here, the approximation that the binding sites are saturated by ligands cannot be made, since [Lstrong]0≈[P]0. To describe the relaxation rate RLLSobs of the weak spy ligand in competition experiments, [P]0 in Equation (6) must be replaced by [P]free of Equation (7).
Once the dissociation constant KDweak of the weak spy ligand and its LLS lifetime in the bound form TLLSbound are known, it is possible to optimize [Lstrong]0 and [P]0 to rank strong competitors according to their binding strengths. Figure 4 shows the calculated TLLSobs(BT) of the bromothiophene protons in BT-GGR if [P]0=25 μm and [Lstrong]0=50 μm as function of KDstrong. Under these conditions, TLLSobs changes dramatically between KDstrong=100 μm and KDstrong=1 μm.
Figure 4.
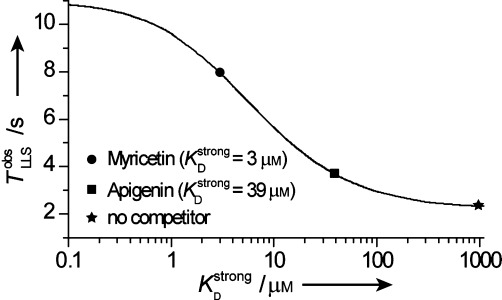
Influence of a competitor on the LLS lifetime of a weak ligand. The LLS lifetimes TLLSobs of the pair of aromatic protons of the bromothiophene spin-pair label as a function of the dissociation constant of a competing stronger ligand, calculated using Equations (6) and (7). The parameters of the weak ligand BT-GGR were obtained from the fit of the data in Figure 3: KD=0.2 mm, TLLSbound=0.1 s, TLLSfree=11 s, [L]0=0.5 mm, [P]0=25 μm, and [Ls]0=50 μm. The three points correspond to TLLSobs in the presence of myricetin (KDstrong=3 μm, •), apigenin (KDstrong=39 μm, ▪) and in the absence of any competitor (★) calculated for these conditions.
A library of competing ligands can thus be ranked according to their affinities by observing the LLS signal of the weak spy ligand. Under the conditions shown in Figure 4, one can easily rank competing ligands with great accuracy provided 1 μm<KDstrong<100 μm. Note that the LLS sequence of Figure 1 can be used with a single sustaining delay τm. This strategy is compatible with dissolution DNP, as discussed below. As TLLSobs of the weak spy ligand is longer in the presence of a stronger competitor, the LLS signal intensity of the spy ligand after a suitably chosen delay τm will be higher. LLS spectra with τm=3 s were recorded with 0.5 mm BT-GGR, in the presence of [P]0=25 μm trypsin with four different competitors, all with [Lstrong]0=50 μm: myricetin (KDstrong=3 μm), morin (KDstrong=30 μm), apigenin (KDstrong=39 μm)[28] and benzamidine (KDstrong=39 μm).[29] Figure 5 a shows three of these five LLS spectra, obtained either without competitor, with apigenin, or with myricetin. Figure 5 b shows the signal intensities of the weak spy ligand BT-GGR in the presence of one of the four competing ligands. The same kind of information can be derived from the lifetimes of long-lived coherences (Figure 5 c,d).
Figure 5.
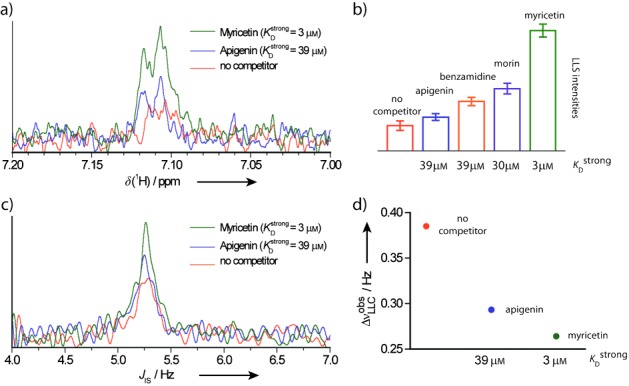
LLS and LLC competition binding experiments. a) Signals of one of the two aromatic protons of bromothiophene of 0.5 mm of the weak spy ligand BT-GGR in the presence of 25 μm trypsin, using the LLS sequence of Figure 1 with a sustaining time τm=3 s in D2O at 25 °C and 11.7 T (500 MHz for protons) 1) in the absence of any competitor (orange), 2) in competition with 50 μm of the intermediate ligand apigenin (blue), and 3) in competition with 50 μm of the stronger ligand myricetin (green). b) Peak intensities of one of the aromatic protons of BT-GGR under the same conditions as in panel a), without competitor or in the presence of apigenin, benzamidine, morin, or myricetin. The better the binding, the smaller the dissociation constant, and the more intense the LLS signal of the displaced spin-pair-labeled spy ligand BT-GGR. c) LLC spectra of the two aromatic protons of the bromothiophene group of BT-GGR acquired with the “on-the-fly” sequence shown in Figure S2b of the Supporting Information, under the same conditions as in panel a). The stronger the binding of competitors, the greater the displacement of the spy ligand BT-GGR, the narrower the peaks in its LLC spectra, and the more intense the signals. d) Line widths of LLC peaks [ΔνLLCobs=1/(πTLLCobs)].
Hyperpolarization by dissolution DNP
Ligands with covalently attached spin-pair labels such as BT-GGR contain spins with long T1 values and are therefore suitable for hyperpolarization by dissolution DNP. Provided T1(1H)>1 s, a sufficient fraction of the hyperpolarized magnetization can be preserved during transfer from the DNP polarizer to the NMR spectrometer.
In a glass-forming solvent mixture H2O/D2O/[D6]DMSO (v/v/v=5:35:60), 10 mm BT-GGR was dissolved with 25 mm 4-hydroxy-2,2,6,6-tetramethylpiperidine-1-oxyl (TEMPOL). Five frozen beads (50 μL) of this solution were loaded together with five frozen beads (50 μL) of 3 m ascorbate[30] into a home-built DNP polarizer[31] operating at B0=6.7 T and T=1.2 K. The sample was irradiated with microwaves at a frequency fμW=188.3 GHz and power PμW=100 mW. Unlike trityl radicals, the nitroxyl radical TEMPO is an efficient polarizing agent for 1H spins, because it has a broad ESR line ΔωESR>ω0(1H).[32] At B0=6.7 T, a proton polarization up to P(1H)=90 % can be obtained,31b while P(1H) is only ∼40 % in polarizers operating at B0=3.35 T. After ∼15 min of microwave irradiation, a steady-state proton polarization P(1H) is reached. The DNP sample can be rapidly dissolved in 0.7 s with 5 mL of hot D2O (P=1 MPa, T=400 K) and transferred to a 11.7 T NMR spectrometer in 4.5 s through a “magnetic tunnel” so that B0>0.8 T during transfer, which is particularly important to preserve the polarization of 1H and 19F nuclei.[33] A fraction (400 μL) of the hyperpolarized solution is then injected in ∼2 s into a 5 mm NMR tube containing 250 μL D2O and, depending on the conditions, 3.65 μm trypsin and 3.65 μm of a competitor such as myricetin. After injection, the final solution has a concentration of 1.4 μm protein, 1.4 μm competitor, and 120 μm hyperpolarized spy ligand BT-GGR. After a 3 s interval to allow proper mixing, a reference free induction decay is observed in 0.5 s after exciting transverse magnetization with a single 5° pulse to control the quality of the hyperpolarized sample and to normalize the signal intensity of the spy ligand to its known concentration. This is immediately followed by an LLS sequence as described in Figure 1 with a fixed sustaining time τm=3 s.
The DNP enhancements of the aromatic protons of the spin-pair-labeled spy ligand BT-GGR were on the order of εDNP=100–200, relative to Boltzmann equilibrium at 25 °C and 11.7 T (500 MHz for protons). A significant fraction of the proton hyperpolarization was lost during the 10 s interval between dissolution and signal acquisition, but a faster sample injection device[33] could decrease this interval to 1.2 s.
Figure 6 shows DNP-enhanced LLS spectra of 1) 120 μm of the spin-pair-labeled spy ligand BT-GGR in the absence of protein, 2) the same upon addition of 1.4 μm trypsin, and 3) the same with further addition of 1.4 μm myricetin as competitor. A dramatic decrease of the LLS signal intensity stemming from BT-GGR is observed upon adding trypsin. The contrast defined in Equation (5) is C(TLLS)=75 %. Addition of an equimolar amount of the competitor myricetin leads to a partial displacement of the spy ligand that can be readily detected by the revival of its LLS signal. With only 120 μm of the spin-pair-labeled spy ligand BT-GGR, the DNP-enhanced LLS spectrum of Figure 6 recorded in a single scan after τm=3 s has a signal-to-noise ratio (SNR) of 130. Under the same conditions, but without DNP, an accumulation of 225 transients for ∼1 h was necessary to reach the same SNR. A DNP-enhanced LLS spectrum of BT-GGR with a concentration as low as 10 μm could be recorded with an SNR of 16. Clearly, DNP allows one to decrease the concentration of ligands, but the protein concentration should not be further decreased. In fact, according to Equation (6), the contrast CLLS would decrease if the limit KD+[L0]≈KD were to be reached. Without DNP, using a 50-fold increase in ligand concentration (Figure 5), 256 transients had to be accumulated in 100 min to obtain an SNR of 8. The experimental conditions can be adapted depending on the primary objective: low concentrations of either protein or ligand, rapid throughput, high sensitivity for the displacement by a competitor or high SNR. In Figure 6, the conditions were optimized for high SNR and high contrast upon addition of a competitor, albeit at the expense of a slightly higher ligand concentration and longer polarization buildup time. To attain faster throughput, one could polarize at a higher temperature T=4.2 K and B0=6.7 T, where proton polarization P(1H)=25 % can be reached by DNP in ∼2 min.31b The price to pay would be an approximate threefold lower SNR. Similarly, at T=1.2 K and B0=3.35 T, as in commercially available DNP polarizers, P(1H)=40 % can be reached in ∼6 min.[34]
Figure 6.
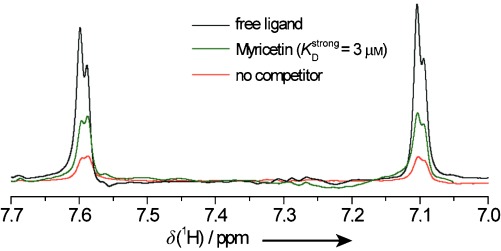
DNP-enhanced LLS competition binding experiments. DNP-enhanced LLS spectra of the two aromatic protons of bromothiophene in BT-GGR 120 μm after a sustaining time τm=3 s, 1) without protein (black), 2) in the presence of 1.4 μm trypsin (orange), 3) with 1.4 μm trypsin and 1.4 μm myricetin as competitor (green). All spectra were acquired in a single scan in D2O, at 25 °C and 11.7 T (500 MHz for protons).
Conclusions
The covalent attachment of “spin-pair labels” such as bromothiophene (BT) permits one to broaden the scope of the LLS and LLC screening methods to virtually any weak ligand in the fast exchange regime. By way of example, bromothiophene carboxylic acid was attached to the N terminus of a tripeptide, but other “spin-pair labels” could be designed. Spy ligands with higher sensitivity to binding could be engineered with the following features: 1) spy ligands with enhanced TLLSfree, 2) LLS functionalizing groups closer to the binding site, 3) the use of nearly equivalent spins.[35] Our labels are far less bulky than chromophores used in fluorescence experiments, and should not induce significant steric impediments to binding. Relative to other NMR screening methods, LLS and LLC offer much improved contrast. For the same ligand concentration (i.e., for the same experimental time), the protein concentrations can be greatly decreased, giving access to poorly soluble protein targets and decreasing the risk of aggregation. When used in competition mode, both LLS and LLC methods allow one to rank high-affinity ligands using simple 1D experiments. Because there are few protons in the spin-pair label, they tend to have long T1 relaxation times, so that drug screening experiments using LLS or LLC can be, in principle, readily coupled to D-DNP. Currently, access to this technology remains limited to a few specialized groups, but a dedicated LLS-DNP screening apparatus could be made commercially available in the near future. As demonstrated below, this approach allows one to decrease the concentrations of spy ligands, competitors and target proteins. In our current setup, the time required for transfer from the polarizer to the detection magnet is similar to T1(1H) of the spy ligand. An acceleration of the transfer would benefit the remaining proton polarization and thus the SNR. Such improvements would allow either a further decrease in ligand concentration or an increase in sample throughput.
Experimental Section
Samples: BT-GGR (see Supporting Information for details about the synthesis) was titrated over the range 0.5<[L]0<40 mm into 25 μm type IX-S trypsin from porcine pancreas (Sigma–Aldrich). As internal concentration standard, 5 mm tert-butyl alcohol (>99.5 %, Sigma–Aldrich) was added. Five solutions containing 0.5 mm BT-GGR and 25 μm trypsin in D2O were prepared for competition experiments: 1) without competitor, 2) with 50 μm myricetin (>96 %, Sigma–Aldrich), 3) with 50 μm morin hydrate (Sigma–Aldrich), 4) with 50 μm apigenin (>97 %, Sigma–Aldrich), and 5) with 50 μm benzamidine hydrochloride (>99 %, Sigma–Aldrich).
Experimental procedures: During the titrations, 2 μL aliquots of 150 mm BT-GGR were added to 300 μL of the starting solution. The lifetimes TLLSobs were determined by single-exponential fitting of signal intensities observed with the LLS sequence of Figure 1, setting the sustaining field strength B1=5ΔνIS, and using N=10 different delays τm=n1Δτm with Δτm=TLLSexpected/10 and n1=1, 3, 6, 10, 15, 21, 29, 37, 46, 56. All measurements were performed at 25 °C on a 500 MHz (11.7 T) Avance Bruker spectrometer equipped with an inverse detection 5 mm CryoProbe.
Dissolution-DNP experiments: Solutions of 10 mm BT-GGR in the glass-forming mixture H2O/D2O/[D6]DMSO (v/v/v=5:35:60) were doped with 25 mm TEMPOL (Sigma–Aldrich). Five frozen beads of 10 μL each of this mixture were inserted with five frozen beads of 10 μL each containing 3 m ascorbate in D2O to scavenge the radicals after dissolution. DNP was performed at 1.2 K and 6.7 T in a home-built polarizer by applying CW microwave irradiation at fμW=188.3 GHz and PμW=100 mW. The beads were dissolved together in 0.7 s with 5 mL D2O, preheated at T=400 K at P=1.0 MPa, and transferred in 4.5 s by pressurizing with helium gas at 0.6 MPa to an 11.7 T Bruker magnet via a 1.5 mm inner-diameter PTFE tube running through a magnetic tunnel of 5 m length. After injection in 2 s into NMR tubes containing 250 μL of D2O to allow field-frequency locking before and during injection, plus 1) 250 μL of 3.65 μm trypsin, or 2) 250 μL of 3.65 μm trypsin and 3.65 μm myricetin. A 5° detection pulse was applied to record a hyperpolarized 1H signal for reference, followed by a single LLS sequence with a sustaining delay τm=3 s.
Acknowledgments
The authors are indebted to Prof. Claudio Dalvit (University of Neuchâtel, Switzerland) for stimulating discussions and to Dr. Pascal Miéville, Martial Rey, and Anto Barisic for valuable assistance. This work was supported by the Swiss National Science Foundation (SNSF), the Swiss Commission for Technology and Innovation (CTI), the Ecole Polytechnique Fédérale de Lausanne (EPFL), Switzerland, the French National Centre for Scientific Research (CNRS), and the European Research Council (ERC) (advanced grant “dilute para-water”).
Supporting Information
As a service to our authors and readers, this journal provides supporting information supplied by the authors. Such materials are peer reviewed and may be re-organized for online delivery, but are not copy-edited or typeset. Technical support issues arising from supporting information (other than missing files) should be addressed to the authors.
miscellaneous_information
References
- 1.Friguet B, Chaffotte AF, Djavadiohaniance L, Goldberg ME. J. Immunol. Methods. 1985;77:305–319. doi: 10.1016/0022-1759(85)90044-4. [DOI] [PubMed] [Google Scholar]
- 2.Schuck P. Curr. Opin. Biotechnol. 1997;8:498–502. doi: 10.1016/s0958-1669(97)80074-2. [DOI] [PubMed] [Google Scholar]
- 3.Ladbury JE, Chowdhry BZ. Chem. Biol. 1996;3:791–801. doi: 10.1016/s1074-5521(96)90063-0. [DOI] [PubMed] [Google Scholar]
- 4.Owicki JC. J. Biomol. Screening. 2000;5:297–306. doi: 10.1177/108705710000500501. [DOI] [PubMed] [Google Scholar]
- 5a.Meyer B, Peters T. Angew. Chem. Int. Ed. 2003;42:864–890. doi: 10.1002/anie.200390233. [DOI] [PubMed] [Google Scholar]
- Angew. Chem. 2003;115:890–918. [Google Scholar]
- 5b.Hajduk PJ, Meadows RP, Fesik SW. Q. Rev. Biophys. 1999;32:211–240. doi: 10.1017/s0033583500003528. [DOI] [PubMed] [Google Scholar]
- 5c.Stockman BJ, Dalvit C. Prog. Nucl. Magn. Reson. Spectrosc. 2002;41:187–231. [Google Scholar]
- 6.Connors KA. Binding Constants: The Measurement of Molecular Complex Stability. New York: Wiley; 1987. [Google Scholar]
- 7.Fielding L. Prog. Nucl. Magn. Reson. Spectrosc. 2007;51:219–242. [Google Scholar]
- 8.Blackledge M. Prog. Nucl. Magn. Reson. Spectrosc. 2005;46:23–61. [Google Scholar]
- 9.Bain AD. Prog. Nucl. Magn. Reson. Spectrosc. 2003;43:63–103. [Google Scholar]
- 10a.Mcconnell HM. J. Chem. Phys. 1958;28:430–431. [Google Scholar]
- 10b.Luz Z, Meiboom S. J. Chem. Phys. 1964;40:2686–2692. [Google Scholar]
- 11.Salvi N, Buratto R, Bornet A, Ulzega S, Rebollo IR, Angelini A, Heinis C, Bodenhausen G. J. Am. Chem. Soc. 2012;134:11076–11079. doi: 10.1021/ja303301w. [DOI] [PubMed] [Google Scholar]
- 12.Shuker SB, Hajduk PJ, Meadows RP, Fesik SW. Science. 1996;274:1531–1534. doi: 10.1126/science.274.5292.1531. [DOI] [PubMed] [Google Scholar]
- 13.Perkins SJ, Johnson LN, Phillips DC, Dwek RA. Biochem. J. 1981;193:553–572. doi: 10.1042/bj1930553. [DOI] [PMC free article] [PubMed] [Google Scholar]
- 14.Lucas LH, Larive CK. Concept. Magn. Reson. A. 2004;20A:24–41. [Google Scholar]
- 15.Chen AD, Shapiro MJ. J. Am. Chem. Soc. 2000;122:414–415. [Google Scholar]
- 16.Mayer M, Meyer B. Angew. Chem. Int. Ed. 1999;38:1784–1788. doi: 10.1002/(SICI)1521-3773(19990614)38:12<1784::AID-ANIE1784>3.0.CO;2-Q. [DOI] [PubMed] [Google Scholar]
- Angew. Chem. 1999;111:1902–1906. [Google Scholar]
- 17.Dalvit C, Pevarello P, Tato M, Veronesi M, Vulpetti A, Sundstrom M. J. Biomol. NMR. 2000;18:65–68. doi: 10.1023/a:1008354229396. [DOI] [PubMed] [Google Scholar]
- 18.Valensin G, Kushnir T, Navon G. J. Magn. Reson. 1982;46:23–29. [Google Scholar]
- 19a.Bornet A, Jannin S, Konter JA, Hautle P, Brandt Bvanden, Bodenhausen G. J. Am. Chem. Soc. 2011;133:15644–15649. doi: 10.1021/ja2052792. [DOI] [PubMed] [Google Scholar]
- 19b.Sarkar R, Ahuja P, Vasos PR, Bodenhausen G. Phys. Rev. Lett. 2010;104:053001. doi: 10.1103/PhysRevLett.104.053001. [DOI] [PubMed] [Google Scholar]
- 19c.Sarkar R, Ahuja P, Vasos PR, Bornet A, Wagnieres O, Bodenhausen G. Prog. Nucl. Magn. Reson. Spectrosc. 2011;59:83–90. doi: 10.1016/j.pnmrs.2010.10.002. [DOI] [PubMed] [Google Scholar]
- 20.Dalvit C, Flocco M, Knapp S, Mostardini M, Perego R, Stockman BJ, Veronesi M, Varasi M. J. Am. Chem. Soc. 2002;124:7702–7709. doi: 10.1021/ja020174b. [DOI] [PubMed] [Google Scholar]
- 21. R. Buratto, D. Mammoli, E. Chiarparin, G. Williams, G. Bodenhausen, Angew. Chem. Int. Ed2014, DOI: 10.1002/anie.201404921R1 (accepted) [DOI] [PMC free article] [PubMed]
- Angew. Chem. 2014 DOI: 10.1002/ange.201404921R1 (accepted) [Google Scholar]
- 22.Ardenkjaer-Larsen JH, Fridlund B, Gram A, Hansson G, Hansson L, Lerche MH, Servin R, Thaning M, Golman K. Proc. Natl. Acad. Sci. USA. 2003;100:10158–10163. doi: 10.1073/pnas.1733835100. [DOI] [PMC free article] [PubMed] [Google Scholar]
- 23.Lee Y, Zeng HF, Ruedisser S, Gosser AD, Hilty C. J. Am. Chem. Soc. 2012;134:17448–17451. doi: 10.1021/ja308437h. [DOI] [PubMed] [Google Scholar]
- 24a.Carravetta M, Levitt MH. J. Am. Chem. Soc. 2004;126:6228–6229. doi: 10.1021/ja0490931. [DOI] [PubMed] [Google Scholar]
- 24b.Levitt MH. Annu. Rev. Phys. Chem. 2012;63:89–105. doi: 10.1146/annurev-physchem-032511-143724. [DOI] [PubMed] [Google Scholar]
- 24c.Pileio G. Prog. Nucl. Magn. Reson. Spectrosc. 2010;56:217–231. doi: 10.1016/j.pnmrs.2009.10.001. [DOI] [PubMed] [Google Scholar]
- 24d.Pileio G, Levitt MH. J. Chem. Phys. 2009;130:214501. doi: 10.1063/1.3139064. [DOI] [PubMed] [Google Scholar]
- 25.Vasos PR, Sarkar R, Bodenhausen G. J. Am. Chem. Soc. 2007;129:328–334. doi: 10.1021/ja0647396. [DOI] [PubMed] [Google Scholar]
- 26a.Gopalakrishnan K, Bodenhausen G. J. Magn. Reson. 2006;182:254–259. doi: 10.1016/j.jmr.2006.07.001. [DOI] [PubMed] [Google Scholar]
- 26b.Sarkar R, Ahuia P, Moskau D, Vasos PR, Bodenhausen G. ChemPhysChem. 2007;8:2652–2656. doi: 10.1002/cphc.200700545. [DOI] [PubMed] [Google Scholar]
- 27a.Bornet A, Jannin S, Bodenhausen G. Chem. Phys. Lett. 2011;512:151–154. [Google Scholar]
- 27b.Carravetta M, Johannessen OG, Levitt MH. Phys. Rev. Lett. 2004;92:153003. doi: 10.1103/PhysRevLett.92.153003. [DOI] [PubMed] [Google Scholar]
- 28.Checa A, Ortiz AR, de Pascual-Teresa B, Gago F. J. Med. Chem. 1997;40:4136–4145. doi: 10.1021/jm970245v. [DOI] [PubMed] [Google Scholar]
- 29.Renatus M, Bode W, Huber R, Sturzebecher J, Stubbs MT. J. Med. Chem. 1998;41:5445–5456. doi: 10.1021/jm981068g. [DOI] [PubMed] [Google Scholar]
- 30a.Miéville P, Ahuja P, Sarkar R, Jannin S, Vasos PR, Gerber-Lemaire S, Mishkovsky M, Comment A, Gruetter R, Ouari O, Tordo P, Bodenhausen G. Angew. Chem. Int. Ed. 2010;49:6182–6185. doi: 10.1002/anie.201000934. [DOI] [PubMed] [Google Scholar]
- Angew. Chem. 2010;122:6318–6321. [Google Scholar]
- 30b.Miéville P, Ahuja P, Sarkar R, Jannin S, Vasos PR, Gerber-Lemaire S, Mishkovsky M, Comment A, Gruetter R, Ouari O, Tordo P, Bodenhausen G. Angew. Chem. Int. Ed. 2010;49:7834. doi: 10.1002/anie.201000934. [DOI] [PubMed] [Google Scholar]
- Angew. Chem. 2010;122:8004. [Google Scholar]
- 31a.Comment A, Brandt Bvanden, Uffmann K, Kurdzesau F, Jannin S, Konter JA, Hautle P, Wenckebach WTH, Gruetter R, Klink JJvander. Concept. Magn. Reson. B. 2007;31B:255–269. [Google Scholar]
- 31b.Jannin S, Bornet A, Melzi R, Bodenhausen G. Chem. Phys. Lett. 2012;549:99–102. [Google Scholar]
- 32.Ahuja P, Sarkar R, Jannin S, Vasos PR, Bodenhausen G. Chem. Commun. 2010;46:8192–8194. doi: 10.1039/c0cc01953d. [DOI] [PubMed] [Google Scholar]
- 33.Bowen S, Hilty C. Phys. Chem. Chem. Phys. 2010;12:5766–5770. doi: 10.1039/c002316g. [DOI] [PubMed] [Google Scholar]
- 34.Jannin S, Bornet A, Colombo S, Bodenhausen G. Chem. Phys. Lett. 2011;517:234–236. [Google Scholar]
- 35.Tayler MCD, Levitt MH. Phys. Chem. Chem. Phys. 2011;13:5556–5560. doi: 10.1039/c0cp02293d. [DOI] [PubMed] [Google Scholar]
Associated Data
This section collects any data citations, data availability statements, or supplementary materials included in this article.
Supplementary Materials
miscellaneous_information


