

Abstract
Synaptically activated calcium release from internal stores in CA1 pyramidal neurons is generated via metabotropic glutamate receptors by mobilizing IP3. Ca2+ release spreads as a large amplitude wave in a restricted region of the apical dendrites of these cells. These Ca2+ waves have been shown to induce certain forms of synaptic potentiation and have been hypothesized to affect other forms of plasticity. Pairing a single backpropagating action potential (bAP) with repetitive synaptic stimulation evokes Ca2+ release when synaptic stimulation alone is subthreshold for generating release. We examined the timing window for this synergistic effect under conditions favoring Ca2+ release. The window, measured from the end of the train, lasted 250–500 ms depending on the duration of stimulation tetanus. The window appears to correspond to the time when both IP3 concentration and [Ca2+]i are elevated at the site of the IP3 receptor. Detailed analysis of the mechanisms determining the duration of the window, including experiments using different forms of caged IP3 instead of synaptic stimulation, suggest that the most significant processes are the time for IP3 to diffuse away from the site of generation and the time course of IP3 production initiated by activation of mGluRs. IP3 breakdown, desensitization of the IP3 receptor, and the kinetics of IP3 unbinding from the receptor may affect the duration of the window but are less significant. The timing window is short but does not appear to be short enough to suggest that this form of coincidence detection contributes to conventional spike timing-dependent synaptic plasticity in these cells.
Keywords: metabotropic glutamate receptor, pyramidal cell, IP3, dendrite, calcium
Introduction
Coincidence detection has been a central theme in cellular neurobiology, especially with respect to mechanisms responsible for synaptic plasticity. The classic idea, originally attributed to Hebb (1949), suggests that when presynaptic and postsynaptic neurons fire together within a certain time interval the synaptic strength between these two cells will be modified. One well-studied form of this plasticity in hippocampal pyramidal cells involves the NMDA receptor, which increases its conductance when the presynaptic cell releases glutamate and the postsynaptic cell depolarizes, relieving the Mg2+ block of the receptor.
There are other forms of coincidence detection in pyramidal neurons. In one example, pairing distal synaptic stimulation with proximal input leads, under certain conditions, to enhanced dendritic spike generation and increased firing in the axon (Jarsky et al. 2005; Larkum et al. 1999; Stuart and Hausser, 2001). Another example implicates phospholipase Cβ (PLCβ) as the coincidence detector between metabotropic glutamate receptors (mGluRs) and postsynaptic [Ca2+]i increases in the generation of enhanced endocannabinoid release (Hashimotodani et al. 2005). A related example, central to this paper, is the release of Ca2+ from intracellular stores mediated by the coincident generation of IP3 and Ca2+ acting on the IP3 receptor (e.g. Berridge, 1998). Although Ca2+ release in pyramidal neurons can be evoked by IP3 alone when mGluRs are stimulated (Jaffe and Brown, 1994; Nakamura et al. 1999), much lower stimulation is effective when mGluR activation is paired with Ca2+ entry mediated by backpropagating action potentials (bAPs). Coactivation of Ca2+ release also has been demonstrated in Purkinje cells when climbing fiber synaptic activation (bringing in Ca2+) is paired with parallel fiber stimulation (mobilizing IP3 though activation of mGluRs) (Khodakhah and Armstrong, 1997; Wang et al. 2000). Similar synergistic release of Ca2+ has been observed in rat prefrontal pyramidal (Hagenston et al. 2008), mouse prefrontal cortical (Stutzmann et al. 2003), and amygdala principal neurons (Power and Sah, 2007).
An important issue in all these forms of coincidence detection is the timing window for effective activation of the two pathways. The narrower the window the more precisely the response can be ascribed to the coactivation of the two inputs. Furthermore, as certain forms of synaptic plasticity are known to be induced when different pathways are stimulated together in a certain time interval, this duration can be used as a parameter potentially implicating particular coincidence mechanisms.
In our first description of this synergistic release of Ca2+ (Nakamura et al. 1999) we estimated that the timing window was about 0.5 s, with synaptic stimulation preceding the bAP. However, in those experiments the estimate was crude; we used tetanic stimulation for 1 s paired with 10 bAPs and Ca2+ release was detected with a high affinity indicator (bis-fura-2), which buffers Ca2+ and interferes with the regenerative release of Ca2+ (Nakamura et al. 2000). Our first goal in these new experiments was to refine these measurements using minimal synaptic stimulation, a single bAP, and minimal buffering to get closer to physiological conditions. We found that the timing window was not constant; it ranged from 250–500 ms, depending on the duration of synaptic activation.
The second goal was to determine the factors contributing to the duration of this window and to explain the variation following trains of different length. Previously (Nakamura et al. 1999), we suggested that this window might be due to the time it takes for IP3 to be metabolized in the dendritic region of the pyramidal neuron, although we had no direct evidence for this conclusion. In new experiments we found indirect evidence that the duration depends significantly on the time it takes for IP3 to diffuse away from the localized site where it is mobilized. Another important factor is the time course of IP3 generation following synaptic trains of different duration. Other factors, including the time for IP3 to be metabolized, IP3 receptor desensitization, and the rate of unbinding of IP3 from the IP3 receptor, may also influence the window duration, but they were not the main determinants in our experiments. Some of this work has been published previously in abstract form (Manita et al. 2007).
Materials and Methods
Whole-cell recording
Transverse hippocampal slices (300 μm thick) from 2- to 5-week-old Sprague–Dawley rats were prepared as previously described (Nakamura et al. 1999, 2002). Animals were anaesthetized with isoflurane and decapitated using procedures approved by the Institutional Animal Care and Use Committee of New York Medical College. Slices were cut in an ice-cold solution consisting of (mM): 80 NaCl, 2.5 KCl, 0.29 CaCl2, 7 MgCl2, 1.25 NaH2PO4, 25 NaHCO3, 75 sucrose, 10.1 glucose, 1.3 ascorbate and 3 pyruvate. They were incubated for at least 1 h in solution consisting of (mM): 124 NaCl, 2.5 KCl, 2 CaCl2, 2 MgCl2, 1.25 NaH2PO4, 26 NaHCO3, and 10.1 glucose, 1.3 ascorbate and 3 pyruvate, bubbled with a mixture of 95% O2–5% CO2, making the final pH 7.4. Normal ACSF (artificial cerebrospinal fluid) composed of (mM): 124 NaCl, 2.5 KCl, 2 CaCl2, 2 MgCl2, 1.25 NaH2PO4, 26 NaHCO3 and 10.1 glucose, was used for recording.
Submerged slices were placed in a chamber mounted on a stage rigidly bolted to an air table and were viewed with a 60X or 40X water-immersion lens in an Olympus BX50WI microscope mounted on an X–Y translation stage. Somatic whole-cell recordings were made using patch pipettes pulled from 1.5 mm outer diameter thick-walled glass tubing (1511-M, Friedrich and Dimmock, Millville, NJ, USA). Tight seals on CA1 pyramidal cell somata were made with the ‘blow and seal’ technique using video-enhanced DIC optics to visualize the cells (Sakmann and Stuart, 1995). For most experiments the pipette solution contained (mM): 145 potassium gluconate, 4 NaCl, 4 Mg-ATP, 0.3 Na-GTP, 14 Na-phosphocreatine, and 10 Hepes, pH adjusted to 7.3 with KOH. Final osmolarity was 297 mOs. This solution was supplemented with low affinity Ca2+ indicators, either 500 μM furaptra, or 200 μM Oregon Green Bapta-5N (Molecular Probes, Eugene, OR, USA). At these concentrations there should not be significant buffering of the [Ca2+]i changes in our experiments; the recovery time of the [Ca2+]i change following a single bAP was less than 120 ms (see below), almost as fast as in the limit of zero indicator (Helmchen et al. (1996). Synaptic stimulation was evoked with 200 μs pulses with glass electrodes placed on the slice about 5–30 μm to the side of the main apical dendritic shaft and at varying distances from the soma. These electrodes were low resistance patch pipettes (less than 10 MΩ) filled with ACSF. We controlled the amplitude of the synaptic response to be below the threshold for action potential generation, either by regulating the stimulation current or hyperpolarizing the cell body with the patch electrode on the soma. Temperature in the chamber was maintained between 31 and 33°C, except when temperature was specifically varied. Caged IP3 (D-myo-inositol 1,4,5-trisphosphate, p4(5)-1-(2-nitrophenyl)ethyl ester; Walker et al. 1987) was purchased from EMD Biosciences (La Jolla, CA). Ci-IP3/PM (d-2,3-O-isopropylidene-6-O-(4,5-dimethoxy-2-nitrobenzyl)-myo-inositol 1,4,5-trisphosphate hexakis(propionyloxymethyl)ester), a more slowly metabolized analogue of caged IP3, was obtained from Sirius Fine Chemicals SiChem GmbH (Bremen, Germany). Caged gPIP2 (1-(alpha-glycerophosphoryl)-myo-inositol 4,5-diphosphate, p4(5)-1-(2-nitrophenyl)ethyl ester), originally sold by EMD Biosciences, but no longer available, was a gift of Dr. S.S. Wang. All other chemicals were obtained from Fisher Scientific (Piscataway, NJ, USA) or Sigma Chemical Co. (St Louis, MO, USA).
Dynamic [Ca2+]i measurements
Time-dependent [Ca2+]i measurements from different regions of the pyramidal neuron were made as previously described (Lasser-Ross et al. 1991; Nakamura et al. 2002). Briefly, a Photometrics (Tucson, AZ, USA) Quantix cooled CCD camera, operated in the frame transfer mode, was mounted on the camera port of the microscope. Custom software (original version described in Lasser-Ross et al. 1991) controlled readout parameters and synchronization with electrical recordings. A second custom program was used to analyze and display the data. Pixels were binned in the camera to allow frame rates of 30–50 Hz. For most experiments we measured fluorescence changes of furaptra with single wavelength excitation (382 ± 10 nm) and emission 455 nm. For experiments with caged compounds (see below) we used the low-affinity indicator Oregon Green Bapta-5N with excitation at 494 ± 10 nm and emission at 536 ± 20 nm. [Ca2+]i changes are expressed as ΔF/F where F is the fluorescence intensity when the cell is at rest and ΔF is the change in fluorescence during activity. Corrections were made for indicator bleaching during trials by subtracting the signal measured under the same conditions when the cell was not stimulated. We did not correct for tissue autofluorescence.
To examine the spatial distribution of postsynaptic [Ca2+]i changes we selected pyramidal neurons that were in the plane of the slice and close to the surface. In these neurons, we could examine [Ca2+]i increases over a range of 140 μm with the 60X lens used in these experiments. Increases in different parts of the cell are displayed using either selected regions of interest (ROIs) or a pseudo ‘line scan’ display (Nakamura et al. 2000).
Photolysis of caged IP3, ci-IP3/PM, and gPIP2
Caged IP3 (400 μM), ci-IP3/PM (1 mM), or caged gPIP2 (300 μM) were included in the patch pipette, and were allowed to diffuse throughout the cell after membrane rupture. Pulsed UV light centered at 365 nm from a light-emitting diode (UVILED, Rapp Optoelectronics) was focused through the objective via either a 1250 μm or 200 μm diameter quartz fiber optic light guide making a spot of about 50 μm or 10 μm in diameter on the slice with the 60X objective lens (Supp Fig. 1A). For these experiments Oregon Green Bapta-5N was used as the Ca2+ indicator because the excitation wavelength for this indicator is outside the activation band of the caged compounds. UV light intensity was regulated by changing the proportion of time the UV light was on (Supp. Fig. 1C).
Modeling IP3 diffusion
A simple model of IP3 generation and diffusion in a dendritic segment was made using the NEURON computational environment (Hines, 1998). The dendrite was modeled as a multisegmented cylinder with no radial structure (see Fig. 3C). IP3 generation by uncaging was simulated by modeling uniform Na+ entry through a 10 or 50 μm segment. The mathematics is the same for Na+ entry or IP3 mobilization in this reduced model and using this approach allowed us to use the built in mechanisms in NEURON. The parameters were adjusted to give constant current over 50, 200, or 500 ms time intervals. IP3 diffusion was modeled by changing the Na+ diffusion constant built into NEURON to a value of 280 μm2s−1 (Allbritton et al. 1992). No other channel types or pumps were included. Since diffusion is a linear process the magnitude of the current or IP3 concentration was irrelevant and the results are presented normalized to the peak values at the center of the segment at the starting time.
FIGURE 3.
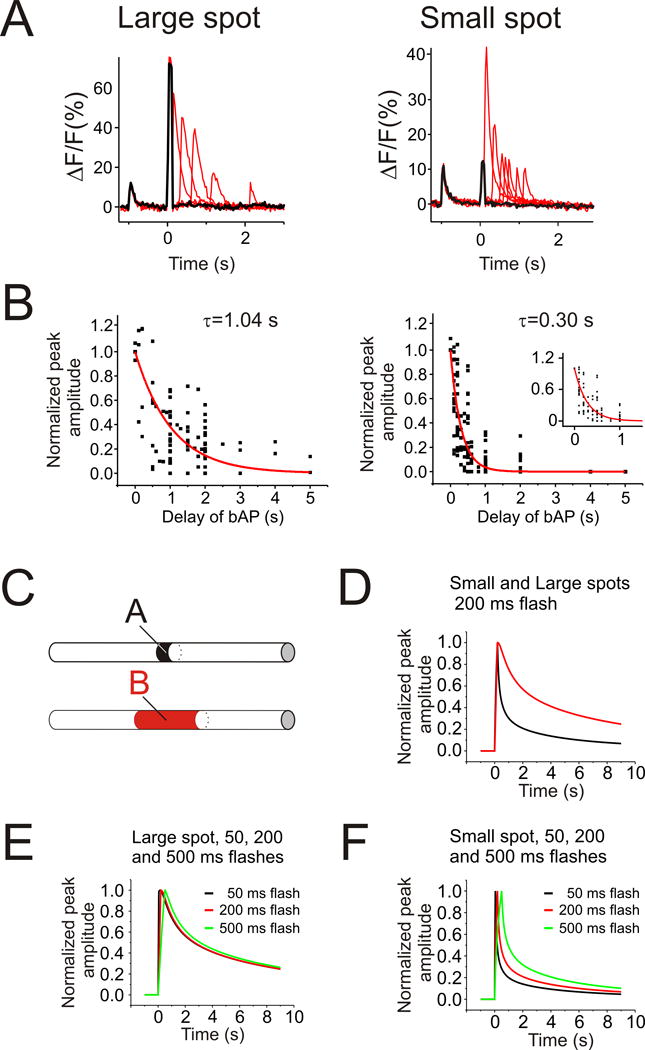
The duration of the timing window depends on the size of the uncaging flash. (A,left) Representative examples of Ca2+ release evoked by a 150 ms large UV spot paired with bAPs at varying delays (thin traces). The thick trace shows only the UV flash artifact and no Ca2+ release. Right, similar examples of Ca2+ release evoked by a 150 ms small UV spot. (B) Normalized peak amplitudes of Ca2+ release evoked by large (left) and small (right) UV flashes as a function the bAP delays. Inset shows the small UV flash data on an expanded time scale. The amplitude of the signal from the bAP evoked before the flash was subtracted from the pairing signal to estimate the Ca2+ release contribution to the amplitude. Traces show single exponential fits to the data points. There was a significant difference between the time constant found using the large and small spots (1.04±0.08 s vs. 0.30±0.18 s). (C) Model comparing the diffusion of IP3 when IP3 is produced over a short or long dendritic segment. A 200 ms bolus of IP3 was produced locally (10 μm segment, A) and widely (50 μm segment, B) in a simulated dendritic branch. (D) Normalized IP3 concentration profiles at points A and B on Fig. 3C. The decay is much slower when IP3 is produced over the longer segment. (E) Normalized IP3 concentration profiles at point B for three different bolus durations. (F) Similar time courses at point A. The duration of the bolus has much less effect than the length of the segment.
Results
Ca2+ release evoked by pairing a train of synaptic inputs and a single backpropagating action potential
To evoke Ca2+ release synaptically the stimulating electrode was placed near the proximal apical dendrites of the furaptra-filled pyramidal neuron. With strong stimulation intensity (40 μA) a train of 50 stimuli at 100 Hz evoked Ca2+ release (Fig. 1A). The increase in [Ca2+]i began with a delay from the start of stimulation, peaked after the end of stimulation, and propagated slowly in a restricted region of the dendrites (Nakamura et al. 1999). The summating EPSPs were kept below threshold for generating an action potential (AP) by slightly hyperpolarizing the cell. In most neurons this was not necessary. Between trials the cell was “primed” (Hong and Ross, 2007) with intrasomatically evoked APs at 4 Hz for 1–2 min to maintain the stores at full capacity. With this procedure Ca2+ release was almost constant in amplitude and spatial extent over many trials (Supp. Fig. 2). The experiment was then repeated with lower stimulation currents until no Ca2+ release was detected (25 μA in this experiment). In the next trial the same intensity tetanic stimulation was paired with a single bAP evoked by a brief (2 ms) current pulse. In this case Ca2+ release was again evoked (Fig. 1A, 25 μA+1 bAP). The synergy was due to the bAP and not the underlying depolarizing pulse since just subthreshold pulses were not effective (n=6 from 3 cells). The peak amplitude at 0 ms bAP delay (measured at the site of initiation) of the [Ca2+]i increase was independent of the number of stimuli (ΔF/F=6.8±0.9, train of 5, n=12; 8.1±0.7, train of 20, n=28; 6.9±0.4, train of 50, n=6; F(2,43) = 0.8, P = 0.4, ANOVA), supporting the observation (Nakamura et al. 1999) that when synaptically activated Ca2+ release occurs in the proximal apical dendrites it is usually regenerative.
FIGURE 1.
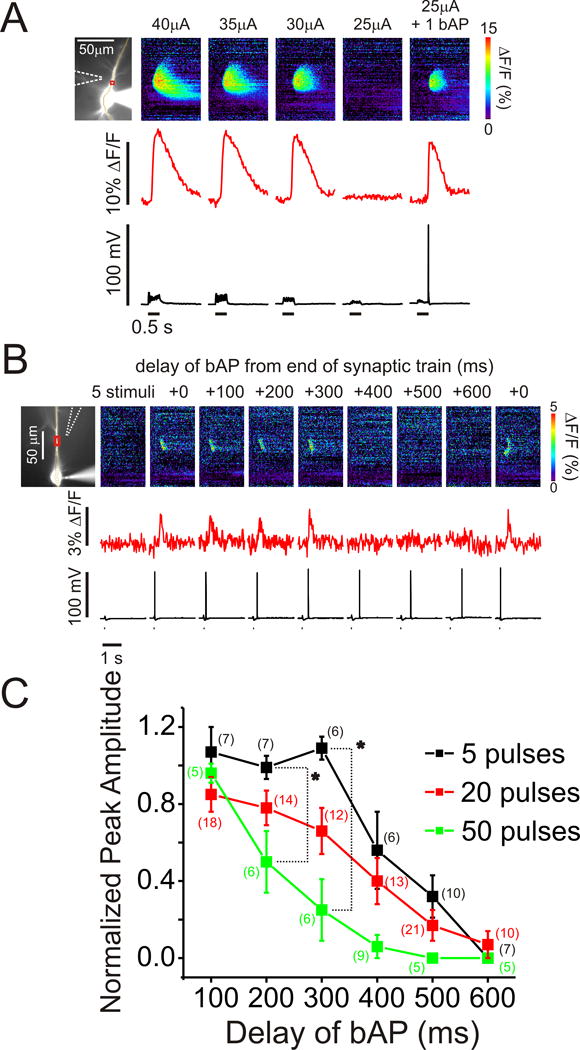
Pairing of repetitive synaptic stimulation and a single backpropagating action potential synergistically evoked Ca2+ release within a timing window that depended on the duration of stimulation. (A, left) cell image showing a pyramidal neuron filled with 500 μM furaptra. The patch electrode is on the soma and the position of the stimulating electrode is shown with a dotted arrow. The set of pixels through the soma and dendrite indicate the position of the ‘line scan’ in the right panels. The boxes indicate the ROIs (regions of interest) in the dendrites from where the individual optical traces were recorded. Right, the series of panels show the fluorescence changes and electrical responses to a series of synaptic stimuli (100 Hz for 0.5 s) at decreasing intensity. The cell was hyperpolarized from -65mV to -75mV to prevent firing. The stimulation intensities are indicated above the pseudocolour images and the threshold current was 30 μA. The optical, electrical and ‘line scan’ panels all have the same time scale. Stimulation using 25 μA did not evoke Ca2+ release, but it was effective when paired with one backpropagating action potential (bAP). Pairing was not necessary at higher intensities. (B) Ca2+ release evoked by a train of 5 stimuli (black dots) and a single bAP. The delay of the bAP from the end of the train was varied from 0 ms to 600 ms. In this experiment release did not occur for delays ≥ 400 ms. (C) The peak amplitude of Ca2+ release as a function of the delay of the bAP from the end of the stimulation train normalized to the amplitude at 0 ms delay. Data from trains of 5, 20, and 50 stimuli are shown. The means of the amplitudes at 200 and 300 ms for trains of all durations were significantly different (P < 0.05, ANOVA).
The same experiment was repeated with various delays for the bAP after the end of the train to estimate the timing window. The stimulation intensity was always set just below the threshold for evoking Ca2+ release without bAPs; this was usually tested several times during an experiment. The cell was always primed between trials. In the experiment shown in Fig. 1B successful release was evoked with delays of 0, 100, 200, and 300 ms, but failed with delays of 400, 500 and 600 ms. At the end of the sequence we returned to 0 ms delay as a control and again successfully evoked release. If Ca2+ release at 0 ms delay was not observed, the test measurement was excluded. We repeated this kind of experiment many times. We also varied the number of stimuli in the train. Reliable Ca2+ release was generated with trains of 5, 20, or 50 stimuli at 100 Hz but one or two stimuli were rarely successful (Zhou and Ross, 2001). We usually needed a lower stimulation current when longer trains were used but in each case the intensity was set to a value just below the threshold for evoking Ca2+ release without a bAP. Similar responses were detected in the presence of 100 μM APV, 10 μM CNQX, and with the cell hyperpolarized (Nakamura et al., 2002) showing that Ca2+ entry through voltage gated or ionotropic receptor channels was not needed to generate Ca2+ release (data not shown). Interestingly, the response for each cell was often all-or-none as the delay of the bAP was increased as shown in Fig. 1B and for other cells as shown in Supp. Fig. 3, supporting the conclusion that synaptically activated Ca2+ release is regenerative.
To determine the timing window we measured the peak amplitude (ΔF/F) of Ca2+ release as a function of the delay of the bAP from the end of the synaptic train and normalized the values to the amplitude with 0 ms delay. These amplitudes include a contribution from the bAP itself. However, when furaptra was used as the indicator the amplitude of [Ca2+]i increase from release was typically more than 20 times the amplitude of the [Ca2+]i increase from a single bAP (Nakamura et al., 2000; Larkum et al., 2003). Therefore, we ignored the contribution from the spike. Interestingly, the timing window (defined as the time when a bAP evoked release with 50% of the amplitude with 0 ms delay) differed for synaptic trains of different durations; for 50 stimuli the window was about 250 ms, for 20 stimuli the window was 400 ms, and for 5 stimuli the window was about 500 ms. The normalized peak amplitudes, using the three stimulation trains, measured at 200ms, 300 ms and 400ms delay, were significantly different (200ms, F(2, 26) = 3.7, P = 0.04; 300msec, F(2, 23) = 8.3, P = 0.002 and 400msec, F(2, 27) = 3.436, P = 0.048, ANOVA Fig. 1C). One possible explanation for these differences is that IP3 might primarily be produced during the beginning of a long train. This could happen as a consequence of a reduction in PLCβ activity, PIP2 depletion, or mGluR desensitization near the end of the train. Since the window was measured from the end of the train the window would appear to be shorter when longer trains were used (see Discussion). Another difference among the timing windows was that the mean amplitude of Ca2+ release began to decline immediately with increasing delays when the 50 pulse train was used while the normalized amplitude remained close to 1.0 for about 300 ms when the 5 pulse train was used.
Focal uncaging of IP3 paired with a single bAP
If the time course of IP3 production during a synaptic train was influencing the timing window we thought we could isolate this issue by generating IP3 by uncaging instead of by synaptic stimulation. This procedure bypasses the activation of mGluRs and PLCβ. For these experiments we used a high concentration (400 μM) of caged IP3 in the pipette. When cells were loaded with this compound we found that we could repetitively evoke Ca2+ waves of similar amplitude more than 15 times, even when the UV flash lasted more than 500 ms, provided the cell was primed between flashes (Hong and Ross, 2007). Therefore, it is reasonable to assume that IP3 was produced at a constant level throughout the duration of a single flash.
Fig. 2A shows that pairing uncaging of IP3 with a single bAP was also effective in generating a Ca2+ wave. When the total amount of UV light in the flash was reduced, waves were still generated until the intensity was lowered to 11% of the starting level. When this experiment was repeated at the same 11% intensity, but with a single bAP added at the end of the flash, Ca2+ release was evoked. We then generated a series of timing curves, delaying the time of the bAP from the end of the uncaging pulse keeping the intensity of the flash constant, similar to the way the curves were created using synaptic stimulation. We created these curves using uncaging pulses of 50 ms, 200 ms, and 500 ms duration (Figs. 2B, C, D), to mimic the synaptic trains of 10, 20, and 50 pulses at 100 Hz. In each case the peak amplitude of the fluorescence transient decreased with increasing delay. Fig. 2E summarizes these experiments. Although there was some scatter in the results it is clear that the averaged timing curves were the same for uncaging pulses of all durations and for all duration pulses the peak fluorescence amplitudes began to decline immediately as the delay of the bAP increased from 0 ms.
FIGURE 2.
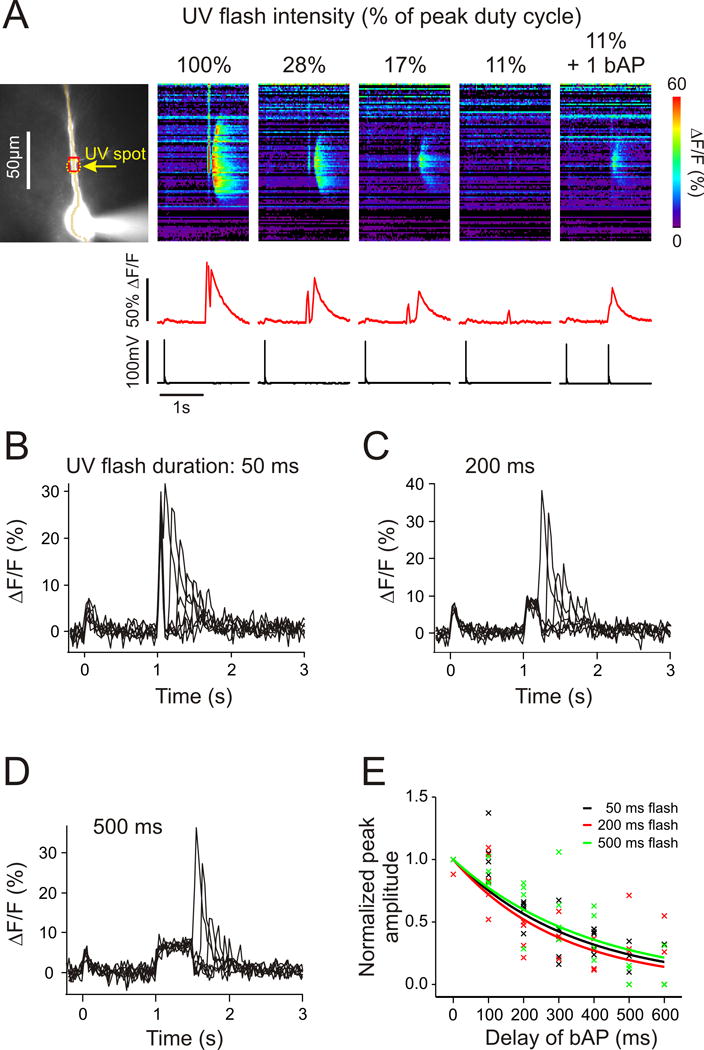
Pairing uncaging of IP3 with a single backpropagating action potential evoked Ca2+ release synergistically within a time window that was independent of the duration of the uncaging flash. (A, left) A CA1 pyramidal neuron filled with 200 μM OGB-5N. The dashed circle shows the location of the 100 ms UV flash. Right, the series of panels show the fluorescence changes at different locations in response to uncaging of IP3 at decreasing flash intensities. Subthreshold intensity was effective when paired with a single bAP. (B) Representative examples of Ca2+ release evoked by a 50 ms small UV flash paired with bAPs at varying delays. (C and D) Similar examples of Ca2+ release evoked by 200 ms and 500 ms UV flashes. (E) Normalized peak amplitudes of Ca2+ release evoked by 50 (n = 5 cells), 200 (n = 5 cells) and 500 ms (n = 4 cells) UV flashes as a function the bAP delays. Solid curves are exponential fits to the data forced to go through 1.0 at 0 ms delay.
Although these uncaging experiments resembled the experiments used to synergistically evoke Ca2+ release with synaptic stimulation, there were some differences. In these experiments the peak amplitude of Ca2+ release decreased as UV flash intensity decreased (Fig. 2A), suggesting that the amplitude was related to the amount of IP3 produced. In the synaptic experiments the peak [Ca2+]i amplitude did not change significantly when the stimulation current was reduced (Fig. 1A). Although the reasons for this difference are not completely clear, one reasonable explanation is that when the synaptic stimulation current was reduced the number of activated presynaptic fibers was reduced (restricting the area over which IP3 was generated) but the amount of IP3 generated at each synaptic contact was probably not affected (Watanabe et al. 2006). When the UV light intensity was reduced the spatial extent of IP3 generation was unaffected but the concentration at each point was lowered. Also, uncaging generates IP3 immediately at all affected locations including the IP3 receptors, while following synaptic stimulation the time course of IP3 concentration at the receptors includes the time for IP3 mobilization and subsequent diffusion from the sites of its generation to the IP3 receptors.
Another possible source of the difference is that the synaptically generated signals were measured using furaptra while the uncaging signals were measured using OGB-5N. Although both these indicators have low affinity for Ca2+ the affinities are not identical, possibly leading to different effects on the nonlinear Ca2+ release amplitude. To test for this possibility we repeated the synaptic experiments using OGB-5N as the Ca2+ indicator. We found (Supp. Fig. 3) that essentially the same timing windows were determined for this protocol using OGB-5N as with furaptra. Therefore, the timing window results are likely to reflect real differences between the two ways of measuring the windows.
IP3 diffusion influences the duration of the timing window
To further explore the mechanisms determining the duration of the timing window we generated a series of timing curves using the small (10 μm) and large (50 μm) UV spots paired with single bAPs. Flash durations between 50 and 500 ms were used to parallel the synaptic stimulation trains of 5, 20, and 50 stimuli at 100 Hz. Fig. 3A shows overlaid traces from two experiments using the large and small spot. The resulting amplitudes, using a flash durations of 50–200 ms, normalized to the values at 0 ms delay, are plotted in Fig. 3B. Even though there is some scatter it is clear that the timing curves are different for the two spot sizes. We fit the data to single exponentials to give a number to the timing window, although there was no reason to assume the curve should be this simple. We found that the time constant (τ) for the window using the small spot was 0.30 ± 0.02 s (τ ± SEM; multiple measurements from 19 cells) and the time constant for the larger spot was 1.04 ± 0.08 s (τ ± SEM; data from 12 cells).
It is not immediately obvious why changing the size of the uncaging spot should affect the timing window. The parameters that determine when wave initiation occurs are the conditions at the place where Ca2+ release occurs first. This location was usually at the center of the spot. The size of the spot might affect the extent of wave propagation (see below) but should not affect the conditions at the initiation site. However, the size of the spot will affect how fast IP3 diffuses away from the center of the spot after it is generated by the uncaging flash. IP3 should diffuse away faster from the small illuminated dendritic segment than from the larger illuminated segment providing an explanation for this experiment. To quantitatively test this idea we made a simple computational model of the time course of [IP3] in the center of a cylindrical segment when the only factors controlling the concentration were the steady buildup of [IP3] during the flash and subsequent diffusion into the unilluminated regions (see Methods for details). The results of the simulation (Figs. 3C–F) show that when IP3 is generated over a 50 μm length the half decay time of [IP3] is longer (2.7 s) than when produced over a 10 μm segment (0.4 s). These times are slightly longer than the decay times measured in the uncaging experiment. One weakness of the model, of course, is that we do not know exactly the kinetics and stoichiometry of IP3 binding to the receptors that lead to regenerative release of Ca2+ from the ER. However, the design of the experiment, where we compared the windows using large and small uncaging spots, should make these other factors less significant than the time course of IP3 concentration at the initiation site. For both spot sizes we set the intensity of the small and large UV flashes to be just below the threshold for a flash to initiate a wave by itself. The closeness of the model to the experimental data suggests that diffusion is a major regulator of [IP3] in the uncaging timing window experiments.
These data also are consistent with diffusion as an important regulator of the timing window for pairing of synaptic stimulation with a bAP (Fig. 1). In those experiments we found that the timing window was less than 500 ms. This value would correspond approximately to the window determined when IP3 was uncaged with the small UV spot. We do not know directly the spatial extent of IP3 production following synaptic stimulation. However, data from the uncaging experiments suggests that this extent should be close to the size of the small spot. In the uncaging experiments the spatial extent of the evoked Ca2+ waves was slightly larger than the size of the uncaging spots (89±2 μm (large spot) vs. 34±2 μm (small spot) measured at 0 ms delay for the bAP; Figs. 4A, B). This reflects the fact that the waves only propagate over a region where IP3 is elevated since IP3 is always required to open the IP3Rs even though it is a regenerative process (see Watanabe et al, 2006). Fig. 4C shows that the spatial extent of the synaptically evoked Ca2+ wave (at threshold) was close to the extent of the wave generated with the small UV flash. Therefore, it is likely that the spatial extent of synaptically evoked IP3 was similar to the IP3 extent when the small spot was used to uncage this compound.
FIGURE 4.
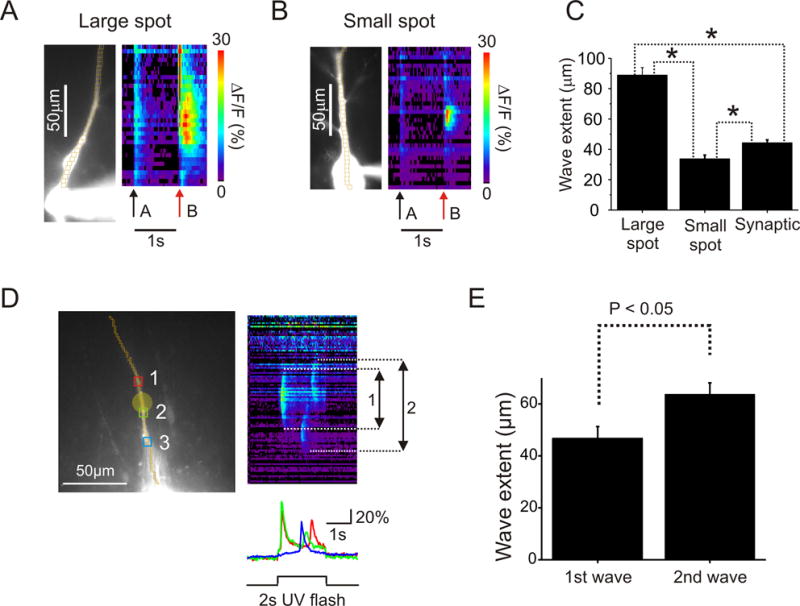
Factors affecting the spatial extent of Ca2+ release waves following uncaging or synaptic stimulation. (A and B) Representative examples of Ca2+ release evoked by pairing large and small subthreshold UV flashes with a single bAP. (C) Average Ca2+ wave extent in three kinds of experiments; large spot: 89 ± 2 μm, n = 5 cells, 12 trials; small spot: 34±2 μm, n = 18 cells, 21 trials; synaptic stimulation: 44 ± 2 μm, n = 3 cells, 31 trials; wave extent measured at 50% of peak amplitude. The three sizes were significantly different but the synaptic size was closer to the small spot size (F (2, 61) = 85.7, P < 0.01, ANOVA). Asterisk shows significance (P < 0.05) by Tukey post-hoc test. In A and B arrows (a) are the times of single bAPs. The arrows (b) are the times of the bAP paired with the uncaging flash. (D) One example of secondary Ca2+ waves generated at the end of a 2 s long uncaging pulse. The secondary waves always extended further along the dendrite. A possible explanation for why two secondary waves were always generated is that the IP3 receptors in the center were desensitized by the high concentration of released IP3 in this region, but we do not have direct evidence to support this hypothesis. (E) Summary histogram of the spatial extents of the primary and secondary waves (n=8).
We could not directly measure IP3 diffusion in these experiments (see Discussion). However, indirect evidence supports the idea that IP3 is diffusing in the dendrites of pyramidal neurons as Allbritton et al. (1992) found in the cytoplasm of Xenopus oocytes. We found that in experiments where long uncaging flashes were used a pair of secondary waves was often produced at the end of the flash. The occurrence of these secondary waves resembles the oscillations that have been seen in other cells (e.g. Li et al., 1998) and which we saw in pyramidal cells (Watanabe et al., 2006) when challenged with tonic levels of IP3 loaded through the patch pipette. In our current experiments we noticed that the secondary waves propagated further along the dendrites than the first waves propagated and further than the extent of the UV flash (Figs. 4D, E; n=8). Since the extent of wave propagation is determined by the availability of IP3 the easiest interpretation of this result is that IP3 produced at the beginning of the long flash diffused along the dendrites during the interval between waves, supporting a more extensive secondary wave.
Effects of inhibitors of IP3 breakdown
Previously (Nakamura et al. 1999), we suggested that the timing window might depend on how long it took for IP3 to be metabolized in the dendrite after it was generated. We did three kinds of experiments to test this idea. In the first series we included in the recording pipette several compounds that have been reported to inhibit the breakdown of IP3. IP3 is metabolized either to IP2 by inositol polyphosphate 5-phosphatases or to IP4 by IP3 3-kinases (Pattni and Banting, 2004). Therefore, in different experiments we included two IP3 kinase inhibitors, N2-(m-Trifluorobenzyl), N6-(p-nitrobenzyl)purine (IP3KI, 10 μM; Chang et al. 2002) and aurintricarboxylic acid, ammonium salt (ATA, 1 μM; Mayr et al. 2005), and an IP3 phosphatase inhibitor, biphenyl 2,3′,4,5′,6-pentakisphosphate (100 μM; Vandeput et al. 2007). Each of these three compounds slightly reduced the duration of the timing window (Fig. 5, table 1). It is not clear why the durations were reduced. It is possible that the inhibitors interfered with the binding of IP3 to the receptor. More importantly, since the window did not get longer it is likely that IP3 breakdown was slower than diffusion in removing IP3 from the activated dendritic segment. One weakness of these experiments is that we did not have direct evidence that these inhibitors were affecting the breakdown of IP3 in pyramidal cell dendrites, although we obtained the same result with all three compounds. The time course and amplitude of the Ca2+ waves were not affected. But these parameters are not determined by the duration of IP3 in the cytoplasm; they are determined by the regeneration mechanism, similar to the way the parameters of an action potential are not affected by the duration of a depolarizing pulse.
FIGURE 5.
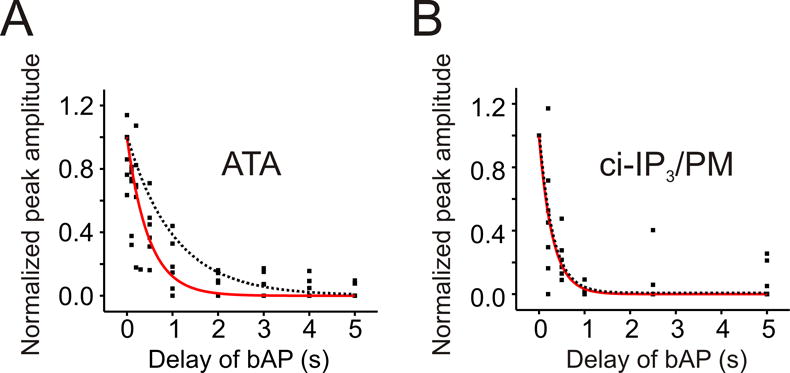
Pharmacological agents that prevent the breakdown of IP3 or using a more slowly metabolized IP3 analogue did not increase the duration of the timing window. (A) Normalized peak amplitudes of Ca2+ release evoked by pairing a large UV uncaging flash with a single bAP at different times after the end of the flash when the IP3 kinase inhibitor ATA (1 μM) was including in the patch pipette. The solid trace shows the best exponential fit to the data (τ = 477 ms). The dotted trace shows the exponential fit without the inhibitor. (B) Similar timing curve when ci-IP3/PM was used to measure the timing window. In these experiments the small uncaging spot was used. The solid trace shows the best exponential fit to the data (τ = 294 ms). The dotted trace shows the exponential fit with normal caged IP3.
Table 1.
Time constant (τ) of single exponential fits to the normalized peak amplitude of Ca2+ release in uncaging experiments*
| Condition | Mean ± SEM (ms) | n (cells) |
|---|---|---|
| Large spot | 1043 ± 84 | 12 |
| Small spot | 301 ± 18 | 19 |
| Low temperature | 618 ± 98 | 6 |
| IP3K inhibitor | 409 ± 52 | 7 |
| ATA | 477 ± 58 | 6 |
| Phosphatase inhibitor | 510 ± 59 | 4 |
| ci-IP3/PM with small spot | 294 ± 45 | 7 |
all experiments used the large uncaging spot except where indicated.
In the second series of experiments, addressing the same question, we measured the timing window using an analogue of caged IP3 (ci-IP3/PM) that, when mobilized, has been reported to be metabolized significantly more slowly (~10 min) than standard IP3 (~20 s) in HeLa and SH-SY5Y cells (Dakin and Li, 2007; Smith et al., 2008). Using this compound and the small uncaging spot the evoked Ca2+ waves appeared identical to the waves evoked with standard caged IP3 (data not shown). The time constant (τ) for the window using ci-IP3/PM was 293 ± 45 ms (Fig. 5B, table 1). This value is very close to the duration of the window obtained using standard caged IP3 (300 ms). Again, this result implies that the metabolism of ci-IP3/PM was not the rate limiting step in determining the duration of the window.
The third test for a role for IP3 metabolism was to see if the window duration was sensitive to temperature. We did a series of experiments measuring the timing window at high (35.4°C) and low (27.8°C) temperatures. We did see a significant difference for the window for synaptically activated Ca2+ release (Fig. 6A). However, we did not see a significant difference when uncaging with the UV spot was used to mobilize IP3 (Fig. 6B, table 1). In this experiment we did have a positive control for the effect of temperature since several parameters describing the time course of Ca2+ release were affected by the temperature change (Supp. Fig. 4). A reasonable interpretation of these results is that temperature was affecting a metabolic step in the signaling pathway before the removal of IP3, e.g. the rate of IP3 generation by PLCβ. The difference cannot be due to changes in the diffusion rate since the diffusion constant is barely affected by this small temperature change.
FIGURE 6.
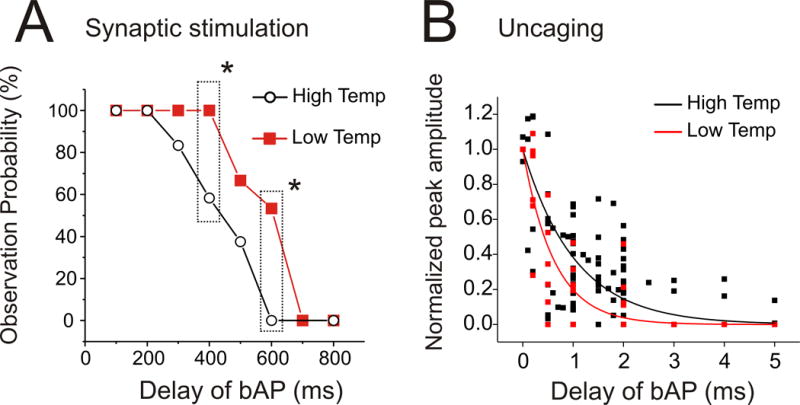
Lowering temperature increases the timing window when Ca2+ release is evoked synaptically but not when it is evoked by uncaging IP3. (A) Success rates of pairing synaptic stimulation (20 pulses at 100 Hz) with a single bAP at different delays at high (35.4±0.2°C) and low (27.8±0.2°C) temperatures. The timing window was significantly shorter at higher temperatures (P < 0.05, χ2 test of independence). (B) Normalized peak amplitudes of Ca2+ release when 200 ms large uncaging flashes were paired with a single bAP at high (34.5±0.2°C) and low (25.9±0.2°C) temperatures. The smooth curves show the best exponential fits to the data points. In this case the timing windows were not significantly different.
Possible effects of IP3 receptor kinetics
In a recent paper, Sarkisov and Wang (2008) suggested that an important factor determining a related timing window in Purkinje neurons was the time that IP3 remained bound to the IP3 receptor. We tested the relevance of this hypothesis for pyramidal neurons by doing two additional experiments. In one we used paired uncaging pulses looking for evidence of residual activation of the IP3 receptor by the first pulse. In analogous experiments Sarkisov and Wang (2008) found that the timing window in Purkinje cells using two uncaging pulses was significantly longer than the window determined by pairing an uncaging pulse with climbing fiber activation (similar to our use of a bAP). In our experiments (Fig. 7A) we set the intensity of the 100 ms small UV flash to be just subthreshold for evoking Ca2+ release but high enough that two consecutive flashes did evoke release. We then increased the delay of the second flash until Ca2+ release was not evoked. Fig. 7B shows that the time to reach 50% amplitude was 300 ms (multiple trials from 10 cells), about the same time as when the window was measured using a bAP instead of a second uncaging pulse (Fig. 2). If residual binding of IP3 to the receptor was affecting the timing window we might have expected a difference in the timing window when IP3 uncaging was paired with a second uncaging pulse (with the released IP3 acting on the same IP3 receptor binding site) or when paired with a bAP (with the entering Ca2+ acting on a different binding site on the IP3 receptor). Since there was no difference this result suggests that residual binding is not the determining factor for the timing window under the conditions of our experiments.
FIGURE 7.
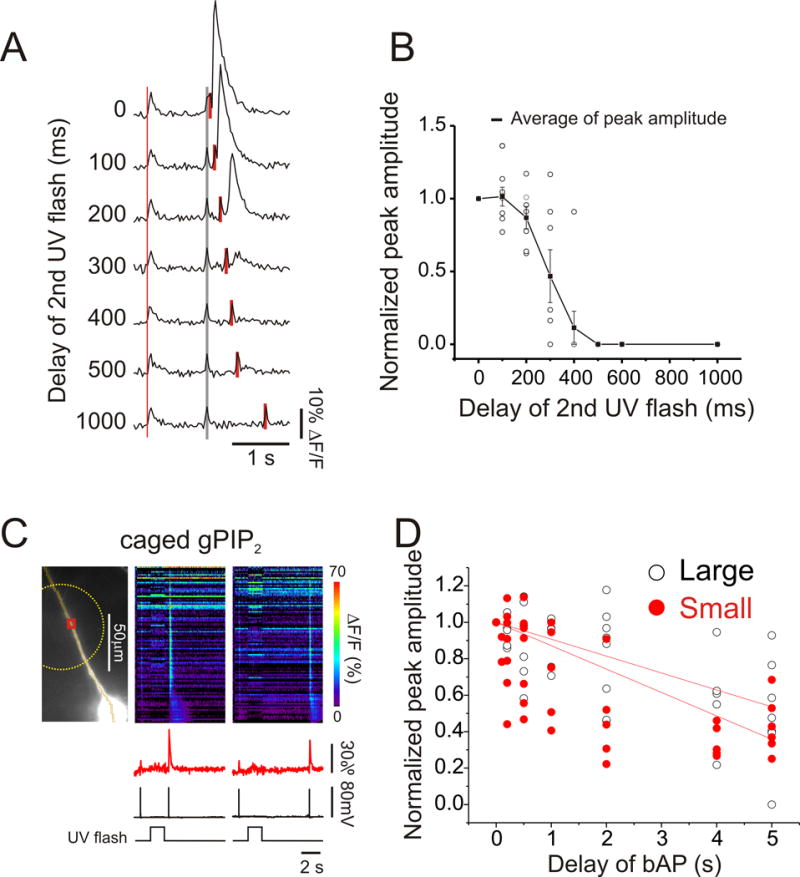
Evidence relating to the importance of the off rate of IP3 unbinding from the IP3 receptor in determining the timing window. (A) The timing window for successful Ca2+ release evoked by pairing two uncaging flashes separated by different times is not different from the window evoked when a single UV flash was paired with a bAP. Representative experiment with paired UV pulses. A single bAP was generated to give a reference signal (thin black line) and 1 s later pairs of 100 ms UV flashes were given with varying delays between them (solid bars). When the delay was 0–300 ms Ca2+ release was observed at the site of the flash but not with longer delays. The very short signals at the times of the flashes are uncorrected artifacts. (B) Summary plot of the data from 10 cells. The average peak amplitude is plotted. The time window was about 300 ms, similar to that determined with a single flash and a bAP. (C) Timing window of Ca2+ release evoked by pairing the uncaging of gPIP2 with a bAP was longer than of the window using normal caged IP3. Representative examples of Ca2+ release evoked by pairing 1.5 s large UV flashes (dotted circle) and bAPs at 0.5 and 5 s delays from the end of the flash. The artifacts from the UV flashes were digitally subtracted (see Methods). (D) Peak amplitudes of Ca2+ release, normalized to amplitudes at 0 ms delay, as a function of the delay of the bAP from the end of the UV flash. White and black dots show data using large and small UV spots. Lines show linear fits to the normalized peak amplitudes. The times to half peak amplitude were more than 10 times longer than when normal caged IP3 was used.
A second approach used by Sarkisov and Wang (2008) to test for the significance of the removal rate of IP3 from its receptor was to measure the timing window with slowly metabolized caged gPIP2 (Bird et al. 1992). In their experiments the timing window in Purkinje cells was significantly longer using this compound than when using caged IP3. In parallel experiments we evoked Ca2+ release and measured the timing window using caged gPIP2 exactly as we measured the window using caged IP3 (Fig. 7C). Although gPIP2 enhanced spike-evoked [Ca2+]i changes these increases were smaller, of shorter duration, and did not spread as a wave in the dendrites as did the [Ca2+]i increases evoked with IP3. We found that the time constants (τ) for the windows were about 10X longer using caged gPIP2 (Fig. 7D; 12±2.5 s, n=8 cells with the large spot; 5.6±0.9 s, n=6 cells with the small spot) than the windows measured using caged IP3 (1.04 s (large spot) and 0.30 s (small spot); Fig. 3B), a result consistent with the interpretation of Sarkisov and Wang (2008) in their experiments. These long times cannot be due to uncaged gPIP2 leaking out of the pipette or some other source of sustained elevated [gPIP2] since the Ca2+ transient generated by an action potential that preceded the uncaging flash showed no sign of having a Ca2+ release component (Fig. 7C). This result does suggest that the effect of the released gPIP2 persisted beyond the time for removal of this compound by diffusion, which should be less than 0.5 s, the same as for IP3 (Fig. 3) since all small molecules (except for Ca2+) diffuse at about the same rate in cytoplasm (Kushmerick and Podolsky, 1969). The slow metabolism of gPIP2 cannot be responsible for the long timing window since diffusion is a faster removal mechanism, similar to why the slow metabolism of ci-IP3/PM did not determine the timing window with that compound. Therefore, residual binding of an agonist to the IP3 receptor may be significant in some conditions in pyramidal neurons.
Order dependence of the timing window
In all these experiments we paired synaptic activation or uncaging of IP3 with a bAP when the bAP followed the other stimulus. It is important to examine this synergism when the bAP precedes the stimulus that generates IP3 since other forms of coincidence detection are order dependent with different physiological consequences depending on which stimulus comes first, e.g. spike timing dependent plasticity (STDP; Markram et al. 1997). If Ca2+ release is order dependent it could implicate release in these forms of coincidence detection. Also, information from this reverse pairing could shed light on the mechanisms underlying synergistic Ca2+ release.
Fig. 8 shows results from these reverse pairing experiments. We tested and compared protocols using synaptic stimulation for 200 ms at 100 Hz with protocols using a 200 ms uncaging pulse. In both cases the stimulation or uncaging intensity was set to be just below threshold for generating Ca2+ release when uncaging was not paired with a bAP and successful release was required when the bAP came at the end of the stimulation. With both protocols there was little or no Ca2+ release when the bAP preceded stimulation by 100 ms or more. When synaptic stimulation was used, trials with the bAP preceding stimulation by 0 or 50 ms rarely evoked Ca2+ release. In contrast, the normalized peak amplitudes were higher when uncaging was used to generate IP3 in trials with bAPs 0 or 50 ms before the start of the UV pulse (Fig. 8C). For both protocols there was a high success rate when the spike came 150 ms after the start of stimulation but 50 ms before its end, showing that 200 ms was more than enough time with either protocol to generate sufficient IP3 to evoke Ca2+ release.
FIGURE 8.
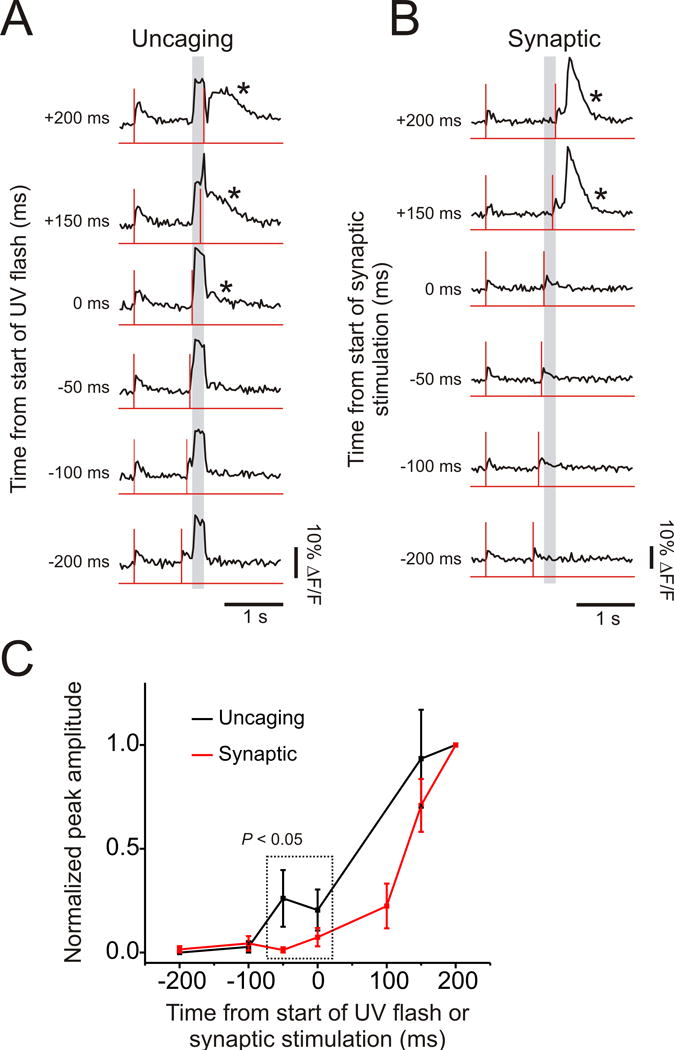
Timing windows generated when the single bAP came before the end of synaptic stimulation or the end of the uncaging flash. (A) Representative experiment when the bAP preceded the 200 ms uncaging flash. In each trial a single bAP (vertical line) was first generated to provide a reference signal and then, 1 s later, single bAPs were paired with 200 ms UV flashes (grey bars). When the bAPs came later (top 3 traces) Ca2+ release (measured at the site of the flash) was observed (asterisks). (B) Similar trials for experiments where a single bAP was paired with 100 Hz synaptic stimulation for 200 ms. (C) Summary plot of all experiments (uncaging: 7 cells, synaptic: 10 cells). Amplitudes normalized to values when the bAP occurred at the end of the flash (+200 ms). The normalized peak amplitude when the bAP preceded the flash by 0 or 50 ms (combined data) was significantly higher than the normalized peak amplitude when the bAP preceded synaptic stimulation (dotted square, P<0.05, paired t-test).
Since spike evoked Ca2+ transients detected using OGB-5N in the proximal apical dendrites had a half width of 119.6±3.5 ms (n=164) there would be a significant overlap in time of the elevated [Ca2+]i increase with the start of IP3 production if IP3 was produced early in the stimulus train and if the spike preceded the train by 50 ms or less. When uncaging was used to generate IP3 we know that IP3 was generated within ms from the beginning of the pulse (Walker et al. 1987). Since there was a higher rate of success in evoking Ca2+ release with uncaging than with synaptic stimulation when the spike preceded stimulation by 50 or 0 ms it is likely that IP3 was not generated immediately following the start of the synaptic train.
Consistent with this idea we found that there was a significant delay before Ca2+ release in experiments where we gave suprathreshold synaptic stimulation to evoke release without a bAP (e.g. the first three trials in Figs. 1A). The typical delay before the start of the [Ca2+]i increase was 472±168 ms (mean±SD; n = 69 trials) while the earliest event occurred with a delay of 150 ms. In contrast, the delay was much shorter before Ca2+ release following suprathreshold uncaging of IP3 (Fig. 2A; 246±179 ms; mean±SD; n = 50 trials), while the earliest event occurred within one frame (30 ms) from the start. (Supp. Fig. 5.)
Another conclusion from these experiments relates to the location of the synergism between mGluR activation and the bAP. Since Ca2+ upregulates the production of IP3 by PLCβ (Rhee and Choi, 1992) it is possible that when the spike precedes synaptic stimulation the synergism occurs at this enzyme. However, the greater delay for Ca2+ release following synaptic stimulation compared to the delay following IP3 uncaging suggests that the spike does not increase IP3 production.
Discussion
These experiments show that repetitive synaptic activation paired with a single bAP synergistically evokes Ca2+ release from internal stores if they both occur within a time window of 250 to 500 ms depending on the number of stimuli in the synaptic train. The results extend the original observation by Nakamura et al. (1999) and add important information concerning the factors determining the duration of the timing window.
Mechanism of the timing window
The coincident activation of Ca2+ release by IP3 and Ca2+ results from the properties of the IP3 receptor. The open channel probability of the channel increases when both IP3 and Ca2+ are bound to the receptor (Foskett et al. 2007). The details of the stoichiometry and kinetics are complicated and differ in different cell types. However, in most cases the requirements for IP3 decrease if the [Ca2+]i increases. If the IP3 concentration is high enough then the resting [Ca2+]i in the cell will be sufficient. This is the explanation for successful synaptic or uncaging activation of Ca2+ release without bAPs. If the amount of IP3 is reduced by lowering the intensity of synaptic stimulation or the UV flash intensity then additional Ca2+ must be supplied; in our experiments the source was a bAP.
The experiments examined four potential mechanisms for the time window: time for IP3 to diffuse away from the site of generation, time course of IP3 production, time to metabolize IP3, and time for IP3 to unbind from the IP3 receptor. It is likely that all four components contribute but the production and diffusion of IP3 appear to be the dominant mechanisms. The main argument supporting the role of diffusion is that the time window was different when uncaging spots of different diameters were used. We could think of no other obvious reason why the timing window should depend on the size of the uncaging flash. In addition, the time windows for different spot sizes closely matched the calculated times for decay of IP3 concentration in a model that assumed diffusion of IP3 away from the site of production as the only removal mechanism.
We previously hypothesized that the time to metabolize IP3 would be an important determinant of the time window (Nakamura et al., 1999). However, including several IP3 kinase or phosphatase inhibitors in the patch pipette did not increase the duration of the window. Similarly, using the more slowly metabolized analogue of caged IP3 (ci-IP3/PM), did not change the duration of the window. Lowering the temperature did not change the timing window using caged IP3 but did affect the synaptic timing window. The most likely explanation for the lack of effect of these agents on the timing window is that IP3 breakdown normally takes longer than the time for diffusion to remove IP3; i.e. diffusion is the rate determining step for the removal process. There is little data in the literature on the IP3 breakdown rate in neurons. Wang et al. (1995) measured the lifetime of IP3 as 9.2±2.2 s in neuroblastoma cells. Sims and Allbritton (1998) reported that the lifetime of IP3 varied in different cell types, from about 1 s in small smooth muscle and parotid acinar cells to over 60 s in Xenopus oocytes. Dakin and Li (2007; cited above) reported a lifetime of about 20 s in SH-SY5Y cells. These longer lifetimes are consistent with our conclusion but it is not clear if the metabolic environment in those cells is the same as in pyramidal neurons in acute slices.
We found no clear evidence that the rate of IP3 unbinding from its receptor was important in determining the timing window in pyramidal neurons. However, we did find potential evidence for this mechanism in experiments with caged gPIP2. The timing window for this compound was about ten times longer than measured with caged IP3, much longer than the time for removal by diffusion. This suggests either that gPIP2 remains bound to the IP3 receptor for a long time or else it initiates a long lasting step in the release sequence that is not normally activated by IP3. However, the big difference between the time windows measured with the two IP3R agonists and the difference in the Ca2+ wave characteristics suggest that gPIP2 is not a good substitute for IP3 when examining Ca2+ signaling in pyramidal neurons.
Several experiments suggest that the kinetics of IP3 production is an important factor shaping the timing window. We found that for short synaptic trains (5 pulses) the amplitude of evoked Ca2+ release did not decline for spike delays of 300 ms after the end of the train. In contrast, the amplitude of Ca2+ release began to decline when spikes were evoked immediately after the end of a comparable 50 ms uncaging pulse where we are confident that IP3 production stopped at the end of the flash. Diffusion should start to remove IP3 immediately after it is produced. Therefore, the longer window for synaptic activation suggests that IP3 is still being produced for several hundred ms after the end of synaptic stimulation, but not after the end of the uncaging pulse. This conclusion is consistent with general models of second messenger activation, in particular with a quantitative model of IP3 production following parallel fiber stimulation in Purkinje cells (Doi et al. 2005). We did observe an immediate decline in the success rate when bAPs were paired with longer synaptic trains (50 pulses). This suggests, to be consistent with the explanation for shorter trains, that the production of IP3 peaks early in the train and declines with time. There is evidence that mGluRs in pyramidal neurons desensitize (Guérineau et al. 1997). In principle desensitization also could contribute to the timing window profile following the 50 pulse synaptic stimulation protocol but it is not known if this effect can quantitatively explain the rapid falloff observed in this experiment.
We also found evidence that IP3 production may not start immediately at the beginning of the synaptic train or that there might be a delay while IP3 diffuses from the site of production to the IP3 receptor. This conclusion is based on the higher amplitudes of evoked Ca2+ release when the bAP immediately preceded an uncaging pulse in comparison to the amplitudes in experiments where the bAP immediately preceded a synaptic train (Fig. 8C). The difference in delays to the onset of Ca2+ release in experiments where pairing was not needed to evoke release (Supp. Fig. 5) is also consistent with a delayed or slower production of IP3 at the beginning of synaptic stimulation.
Currently, there is no way of directly measuring the time course of IP3 production and removal on the time scale of these experiments. Two imaging techniques based on genetically encoded indicators have been developed, one indirect (Hirose et al. 1999) and the other more direct (Matsu-ura et al. 2006). But neither technique has been used on the time scale of our experiments and it is expected that on this time scale the kinetics of the indicators would complicate the interpretation of the results. We did show indirect evidence that IP3 diffusion is occurring on a time scale relevant to our experiments. We found (Fig. 4D) that the spatial extent of Ca2+ waves was greater at the end of a 2 s uncaging pulse than at the beginning. Since the extent of the waves is related to the area of the uncaging pulse (Fig. 4B) this result suggests that IP3 diffuses over a larger area during the delay before the secondary waves begin.
We found that the order of pairing between the bAP and synaptic stimulation was important in determining the timing window. Spikes occurring before synaptic stimulation did not cause synergistic release of Ca2+ but spikes occurring after release were effective. This order dependence can be explained by the simple requirement that both [Ca2+]i and IP3 concentration are elevated at the same time at the site of the IP3 receptor. [Ca2+]i increased within milliseconds following a bAP and the Ca2+ transient had a half width of 119.6±3.5 ms, measured with 200 μM OGB-5N (n=164), about double the 63 ms estimated in the limit of zero indicator buffering (Helmchen et al. 1996). Since IP3 is produced and removed more slowly, the time of overlap starts soon after the beginning of synaptic stimulation and persists until IP3 is removed by diffusion. There is no need to invoke an explanation including the order dependent binding of Ca2+ and IP3 to the IP3 receptor. Ultimately, a refined model will have to include these considerations (see Doi et al. 2005) but our knowledge of the relevant parameters in pyramidal neurons is too sparse to invoke them in a compelling argument.
While some of our conclusions differ from those of Sarkisov and Wang (2008) in their analysis of the timing window in Purkinje neurons it is important to recognize differences in the preparations and experiments that could explain these differences. Most of their experiments examined Ca2+ release in the finer dendrites of Purkinje cells, while our experiments examined Ca2+ release in the thicker proximal apical dendrites; regenerative Ca2+ release is not significant in the spiny oblique dendrites of pyramidal neurons (Nakamura et al. 2002). The density of IP3 receptors is much higher in Purkinje cells and the cytoplasmic sensitivity of the receptors to IP3 is lower (Fujiwara et al. 2001). Also, Ca2+ release does not spread as a wave in Purkinje cells, in contrast to pyramidal neurons, consistent with the higher level of Ca2+ buffering in Purkinje cells (Fierro and Llano, 1996; Nakamura et al. 2000). Furthermore, in their experiments they used small uncaging flashes (<1 μm diameter), which generated very localized increases in IP3 concentration. In this case the removal of IP3 by diffusion is very fast, exposing potential slower mechanisms that might not show up in our experiments that used larger flashes.
Physiological consequences
The coincident generation of Ca2+ release analyzed in these experiments could be relevant for studies of synaptic plasticity, enzyme activation, and gene expression since they are all affected by increases in postsynaptic [Ca2+]i. Only synaptic plasticity has been studied from the point of view of coincident activation. One form of plasticity, STDP in the hippocampus, has a similar asymmetric activation curve as observed in these experiments. When the postsynaptic spike precedes synaptic activation LTD is evoked; when the spike is second LTP is evoked (e.g. Bi and Poo, 1998; Markram et al. 1997). That window is usually ascribed to the paired action of synaptically released glutamate combined with spike dependent relief of the Mg2+ block of NMDA receptors (e.g. Kampa et al. 2004). Therefore, it is not clear if Ca2+ release from stores contributes to that form of synaptic plasticity. Furthermore, the window for STDP is much narrower than the window observed in our experiments. Since the window we observed depended strongly on the time for diffusion of IP3 it is possible that the window would be narrower in conditions where IP3 is produced over an extent of only a few microns, possibly corresponding to a single “puff” (Parker and Yao, 1991), instead of the larger spots generated in our experiments.
It also is possible that this pairing-induced generation of Ca2+ release could be relevant to other forms of synaptic plasticity. In particular, de Fernández de Sevilla et al. (2008) recently demonstrated that IP3 generated Ca2+ waves induced a form of synaptic enhancement in hippocampal pyramidal neurons that was insensitive to blockade of NMDA receptors. Since Ca2+ waves evoked by pairing require much weaker and shorter synaptic trains than waves evoked by synaptic stimulation alone, the pairing mechanism is more likely to occur physiologically.
Supplementary Material
Acknowledgments
We thank Dr. Nechama Lasser-Ross for computer programming and comments on the manuscript, Prof. Sam Wang for supplying caged gPIP2, which is no longer commercially available, Prof. Barry V.L. Potter and Dr. Steve Mills for the gift of biphenyl 2,3′,4,5′,6-pentakisphosphate, and Prof. Young-Tae Chang for the gift of N2-(m-Trifluorobenzyl), N6-(p-nitrobenzyl)purine.
Grant sponsor: NIH; Grant number: NS016295
References
- Allbritton NL, Meyer T, Stryer L. Range of messenger action of calcium ion and inositol 1,4,5-trisphosphate. Science. 1992;258:1812–1815. doi: 10.1126/science.1465619. [DOI] [PubMed] [Google Scholar]
- Berridge MJ. Neuronal calcium signaling. Neuron. 1998;21:13–26. doi: 10.1016/s0896-6273(00)80510-3. [DOI] [PubMed] [Google Scholar]
- Bi GQ, Poo MM. Synaptic modifications in cultured hippocampal neurons: dependence on spike timing, synaptic strength, and postsynaptic cell type. J Neurosci. 1998;18:10464–10472. doi: 10.1523/JNEUROSCI.18-24-10464.1998. [DOI] [PMC free article] [PubMed] [Google Scholar]
- Bird GS, Obie JF, Putney Jr JW. Sustained Ca2+ signaling in mouse lacrimal acinar cells due to photolysis of “caged” glycerophosphorylmyo-inositol 4,5-bisphosphate. J Biol Chem. 1992;267:17722–17725. [PubMed] [Google Scholar]
- Chang YT, Choi G, Bae YS, Burdett M, Moon HS, Lee JW, Gray NS, Schultz PG, Meijer L, Chung SK, Choi KY, Suh PG, Ryu SH. Purine based inhibitors of Inositol-1,4,5-trisphosphate-3-kinase. ChemBioChem. 2002;3:897–901. doi: 10.1002/1439-7633(20020902)3:9<897::AID-CBIC897>3.0.CO;2-B. [DOI] [PubMed] [Google Scholar]
- Dakin K, Li W-H. Cell membrane permeable esters of d-myo-inositol 1,4,5-trisphosphate. Cell Calcium. 2007;42:291–301. doi: 10.1016/j.ceca.2006.12.003. [DOI] [PubMed] [Google Scholar]
- Doi T, Kuroda S, Michikawa T, Kawato M. Inositol 1,4,5-trisphosphate-dependent Ca2+ threshold dynamics detect spike timing in cerebellar Purkinje cells. J Neurosci. 2005;25:950–961. doi: 10.1523/JNEUROSCI.2727-04.2005. [DOI] [PMC free article] [PubMed] [Google Scholar]
- Fernández de Sevilla D, Núñez A, Borde M, Malinow R, Buño W. Cholinergic-mediated IP3-receptor activation induces long-lasting synaptic enhancement in CA1 pyramidal neurons. J Neurosci. 2008;28:1469–1478. doi: 10.1523/JNEUROSCI.2723-07.2008. [DOI] [PMC free article] [PubMed] [Google Scholar]
- Fierro L, Llano I. High endogenous calcium buffering in Purkinje cells from rat cerebellar slices. J Physiol. 1996;496:617–625. doi: 10.1113/jphysiol.1996.sp021713. [DOI] [PMC free article] [PubMed] [Google Scholar]
- Foskett JK, White C, Cheung KH, Mak DO. Inositol trisphosphate receptor Ca2+ release channels. Physiol Rev. 2007;87:593–658. doi: 10.1152/physrev.00035.2006. [DOI] [PMC free article] [PubMed] [Google Scholar]
- Fujiwara A, Hirose K, Yamazawa T, Iino M. Reduced IP3 sensitivity of IP3 receptor in Purkinje neurons. Neuroreport. 2001;12:2647–2651. doi: 10.1097/00001756-200108280-00012. [DOI] [PubMed] [Google Scholar]
- Guérineau NC, Bossu JL, Gähwiler BH, Gerber U. G-protein-mediated desensitization of metabotropic glutamatergic and muscarinic responses in CA3 cells in rat hippocampus. J Physiol. 1997;500:487–496. doi: 10.1113/jphysiol.1997.sp022035. [DOI] [PMC free article] [PubMed] [Google Scholar]
- Hagenston AM, Fitzpatrick JS, Yeckel MF. MGluR-mediated calcium waves that invade the soma regulate firing in layer V medial prefrontal cortical pyramidal neurons. Cereb Cortex. 2008;18:407–423. doi: 10.1093/cercor/bhm075. [DOI] [PMC free article] [PubMed] [Google Scholar]
- Hashimotodani Y, Ohno-Shosaku T, Tsubokawa H, Ogata H, Emoto K, Maejima T, Araishi K, Shin HS, Kano M. Phospholipase Cβ serves as a coincidence detector through its Ca2+ dependency for triggering retrograde endocannabinoid signal. Neuron. 2005;45:257–268. doi: 10.1016/j.neuron.2005.01.004. [DOI] [PubMed] [Google Scholar]
- Hebb DO. The Organization of Behavior. New York: Wiley; 1949. [Google Scholar]
- Helmchen F, Imoto K, Sakmann B. Ca2+ buffering and action potential-evoked Ca2+ signaling in dendrites of pyramidal neurons. Biophys J. 1996;70:1069–1081. doi: 10.1016/S0006-3495(96)79653-4. [DOI] [PMC free article] [PubMed] [Google Scholar]
- Hines ML. The Neurosimulator NEURON. In: Koch C, Segev I, editors. Methods in Neuronal Modeling. Cambridge: MIT Press; 1998. pp. 129–136. [Google Scholar]
- Hirose K, Kadowaki S, Tanabe M, Takeshima H, Iino M. Spatiotemporal dynamics of inositol 1,4,5-trisphosphate that underlies complex Ca2+ mobilization patterns. Science. 1999;284:1527–1530. doi: 10.1126/science.284.5419.1527. [DOI] [PubMed] [Google Scholar]
- Hong M, Ross WN. Priming of intracellular calcium stores in rat CA1 pyramidal neurons. J Physiol. 2007;584:75–87. doi: 10.1113/jphysiol.2007.137661. [DOI] [PMC free article] [PubMed] [Google Scholar]
- Kampa BM, Clements J, Jonas P, Stuart GJ. Kinetics of Mg2+ unblock of NMDA receptors: implications for spike-timing dependent synaptic plasticity. J Physiol. 2004;556:337–345. doi: 10.1113/jphysiol.2003.058842. [DOI] [PMC free article] [PubMed] [Google Scholar]
- Khodakhah K, Armstrong CM. Induction of long-term depression and rebound potentiation by inositol trisphosphate in cerebellar Purkinje neurons. Proc Natl Acad Sci USA. 1997;94:14009–14014. doi: 10.1073/pnas.94.25.14009. [DOI] [PMC free article] [PubMed] [Google Scholar]
- Jaffe DB, Brown TH. Metabotropic glutamate receptor activation induces calcium waves within hippocampal dendrites. J Neurophysiol. 1994;72:471–474. doi: 10.1152/jn.1994.72.1.471. [DOI] [PubMed] [Google Scholar]
- Jarsky T, Roxin A, Kath WL, Spruston N. Conditional dendritic spike propagation following distal synaptic activation of hippocampal CA1 pyramidal neurons. Nat Neurosci. 2005;8:1667–1676. doi: 10.1038/nn1599. [DOI] [PubMed] [Google Scholar]
- Kushmerick MJ, Podolsky RJ. Ionic mobility in muscle cells. Science. 1969;166:1297–1298. doi: 10.1126/science.166.3910.1297. [DOI] [PubMed] [Google Scholar]
- Larkum ME, Watanabe S, Nakamura T, Lasser-Ross N, Ross WN. Synaptically activated Ca2+ waves in layer 2/3 and layer 5 rat neocortical pyramidal neurons. J Physiol. 2003;549:471–488. doi: 10.1113/jphysiol.2002.037614. [DOI] [PMC free article] [PubMed] [Google Scholar]
- Larkum ME, Zhu JJ, Sakmann B. A new cellular mechanism for coupling inputs arriving at different cortical layers. Nature. 1999;398:338–341. doi: 10.1038/18686. [DOI] [PubMed] [Google Scholar]
- Lasser-Ross N, Miyakawa H, Lev-Ram V, Young SR, Ross WN. High time resolution fluorescence imaging with a CCD camera. J Neurosci Methods. 1991;36:253–261. doi: 10.1016/0165-0270(91)90051-z. [DOI] [PubMed] [Google Scholar]
- Li W, Llopis J, Whitney M, Zlokarnik G, Tsien RY. Cell-permeant caged InsP3 ester shows that Ca2+ spike frequency can optimize gene expression. Nature. 1998;392:936–941. doi: 10.1038/31965. [DOI] [PubMed] [Google Scholar]
- Manita S, Hong M, Ross WN. Program # 786.4, 2007 Neuroscience Meeting Planner. San Diego CA: 2007. Timing window of Ca2+ release evoked by synaptic stimulation and backpropagating action potentials in hippocampal CA1 pyramidal neuron dendrites. Online. [Google Scholar]
- Markram H, Lübke J, Frotscher M, Sakmann B. Regulation of synaptic efficacy by coincidence of postsynaptic APs and EPSPs. Science. 1997;275:213–215. doi: 10.1126/science.275.5297.213. [DOI] [PubMed] [Google Scholar]
- Matsu-ura T, Michikawa T, Inoue T, Miyawaki A, Yoshida M, Mikoshiba K. Cytosolic inositol 1,4,5-trisphosphate dynamics during intracellular calcium oscillations in living cells. J Cell Biol. 2006;173:755–765. doi: 10.1083/jcb.200512141. [DOI] [PMC free article] [PubMed] [Google Scholar]
- Mayr GW, Windhorst S, Hillemeier K. Antiproliferative plant and synthetic polyphenolics are specific inhibitors of vertebrate inositol-1,4,5-trisphosphate 3-kinases and inositol polyphosphate multikinase. J Biol Chem. 2005;280:13229–13240. doi: 10.1074/jbc.M500545200. [DOI] [PubMed] [Google Scholar]
- Nakamura T, Barbara J-G, Nakamura K, Ross WN. Synergistic release of Ca2+ from IP3-sensitive stores evoked by synaptic activation of mGluRs paired with backpropagating action potentials. Neuron. 1999;24:727–737. doi: 10.1016/s0896-6273(00)81125-3. [DOI] [PubMed] [Google Scholar]
- Nakamura T, Nakamura K, Lasser-Ross N, Barbara JG, Sandler VM, Ross WN. Inositol 1,4,5-trisphosphate (IP3)-mediated Ca2+ release evoked by metabotropic agonists and backpropagating action potentials in hippocampal CA1 pyramidal neurons. J Neurosci. 2000;20:8365–8376. doi: 10.1523/JNEUROSCI.20-22-08365.2000. [DOI] [PMC free article] [PubMed] [Google Scholar]
- Nakamura T, Lasser-Ross N, Nakamura K, Ross WN. Spatial segregation and interaction of calcium signalling mechanisms in rat hippocampal CA1 pyramidal neurons. J Physiol. 2002;543:465–480. doi: 10.1113/jphysiol.2002.020362. [DOI] [PMC free article] [PubMed] [Google Scholar]
- Parker I, Yao Y. Regenerative release of calcium from functionally discrete subcellular stores by inositol trisphosphate. Proc Roy Soc Lond B. 1991;246:269–274. doi: 10.1098/rspb.1991.0154. [DOI] [PubMed] [Google Scholar]
- Pattni K, Banting G. Ins(1,4,5)P3 metabolism and the family of IP3-3Kinases. Cell Signal. 2004;16:643–654. doi: 10.1016/j.cellsig.2003.10.009. [DOI] [PubMed] [Google Scholar]
- Power JM, Sah P. Distribution of IP3-mediated calcium responses and their role in nuclear signalling in rat basolateral amygdala neurons. J Physiol. 2007;580:835–857. doi: 10.1113/jphysiol.2006.125062. [DOI] [PMC free article] [PubMed] [Google Scholar]
- Rhee SG, Choi KD. Regulation of inositol phospholipid-specific phospholipase C isozymes. J Biol Chem. 1992;267:12393–12396. [PubMed] [Google Scholar]
- Sakmann B, Stuart G. Patch-pipette recordings from the soma, dendrites, and axon of neurons in brain slices. In: Sakmann B, Neher E, editors. Single channel recording. 2nd. New York: Plenum; 1995. pp. 199–211. [Google Scholar]
- Sarkisov DV, Wang SS. Order-dependent coincidence detection in cerebellar Purkinje neurons at the inositol trisphosphate receptor. J Neurosci. 2008;28:133–142. doi: 10.1523/JNEUROSCI.1729-07.2008. [DOI] [PMC free article] [PubMed] [Google Scholar]
- Sims CE, Allbritton NL. Metabolism of inositol 1,4,5-trisphosphate and inositol 1,3,4,5-tetrakisphosphate by the oocytes of Xenopus laevis. J Biol Chem. 1998;273:4052–4058. doi: 10.1074/jbc.273.7.4052. [DOI] [PubMed] [Google Scholar]
- Smith IF, Wiltgen SM, Parker I. Localization of puff sites adjacent to the plasma membrane: Functional and spatial characterization of Ca2+ signaling in SH-SY5Y cells utilizing membrane-permeant caged IP3. Cell Calcium. 2009;45:65–76. doi: 10.1016/j.ceca.2008.06.001. [DOI] [PMC free article] [PubMed] [Google Scholar]
- Stutzmann GE, LaFerla FM, Parker I. Ca2+ signaling in mouse cortical neurons studied by two-photon imaging and photoreleased inositol triphosphate. J Neurosci. 2003;23:758–765. doi: 10.1523/JNEUROSCI.23-03-00758.2003. [DOI] [PMC free article] [PubMed] [Google Scholar]
- Stuart GJ, Hausser M. Dendritic coincidence detection of EPSPs and action potentials. Nat Neurosci. 2001;4:63–71. doi: 10.1038/82910. [DOI] [PubMed] [Google Scholar]
- Vandeput F, Combettes L, Mills SJ, Backers K, Wohlkönig A, Parys JB, De Smedt H, Missiaen L, Dupont G, Potter BV, Erneux C. Biphenyl 2,3′,4,5′,6-pentakisphosphate, a novel inositol polyphosphate surrogate, modulates Ca2+ responses in rat hepatocytes. FASEB J. 2007;21:1481–1491. doi: 10.1096/fj.06-7691com. [DOI] [PubMed] [Google Scholar]
- Walker JW, Somlyo AV, Goldman YE, Somlyo AP, Trentham DR. Kinetics of smooth and skeletal muscle activation by laser pulse photolysis of caged inositol 1,4,5-trisphosphate. Nature. 1987;327:249–252. doi: 10.1038/327249a0. [DOI] [PubMed] [Google Scholar]
- Wang SS, Alousi AA, Thompson SH. The lifetime of inositol 1,4,5-trisphosphate in single cells. J Gen Physiol. 1995;105:149–171. doi: 10.1085/jgp.105.1.149. [DOI] [PMC free article] [PubMed] [Google Scholar]
- Wang SS, Denk W, Häusser M. Coincidence detection in single dendritic spines mediated by calcium release. Nat Neurosci. 2000;3:1266–1273. doi: 10.1038/81792. [DOI] [PubMed] [Google Scholar]
- Watanabe S, Hong M, Lasser-Ross N, Ross WN. Modulation of calcium wave propagation in the dendrites and to the soma of rat hippocampal pyramidal neurons. J Physiol. 2006;575:455–468. doi: 10.1113/jphysiol.2006.114231. [DOI] [PMC free article] [PubMed] [Google Scholar]
- Zhou S, Ross WN. Threshold conditions for synaptically evoking Ca2+ waves in hippocampal pyramidal neurons. J Neurophysiol. 2001;87:1799–1804. doi: 10.1152/jn.00601.2001. [DOI] [PubMed] [Google Scholar]
Associated Data
This section collects any data citations, data availability statements, or supplementary materials included in this article.