

Abstract
The HIV cascade – often referred to as “the HIV continuum” – provides a valuable framework for population-level representations of engagement with the HIV healthcare system. The importance and appeal of this framework are evidenced by a large body of scientific literature, as well as the adoption of cascade-related indicators by medical and public health organizations worldwide. Despite its centrality in the fields of HIV treatment and prevention, however, the traditional cascade provides limited description of the processes affecting the numbers it represents. Representations that describe these processes and capture the dynamic nature of HIV-infected persons’ pathways through the healthcare system are essential for monitoring and predicting intervention effects and epidemic trends. We propose here a complementary schema – termed the “HIV States and Transitions” framework – designed to maintain key strengths of the traditional cascade while addressing key limitations and more fully describing the dynamic aspects of HIV testing, care, and treatment at the population level.
Keywords: HIV care continuum, HIV treatment as prevention, HIV modeling, linkage to care, engagement in care
Introduction
The “HIV cascade,” an enormously useful framework1–3 for describing population-level engagement with HIV testing, care, and treatment services, has been embraced by the World Health Organization, the US National HIV/AIDS Strategy, the Institute of Medicine, the US Centers for Disease Control (CDC), and the US Department of Health and Human Services.4–8 The cascade typically takes the form of a bar chart, with each bar representing the number or proportion of HIV-positive people achieving a certain interaction with the healthcare system (Figure 1a). The bars become sequentially smaller from left to right as the level of healthcare engagement becomes increasingly beneficial: viral suppression, the ultimate goal for both clinical outcomes and transmission prevention benefits, appears on the far right. Cascade-related research has abounded in the past several years, and many public health agencies in the US have followed CDC instructions to estimate the numbers of people living with HIV/AIDS (PLWHA) in each bar of their respective jurisdictions’ cascades.
Figure 1. Conventional cascade framework and its limitations.
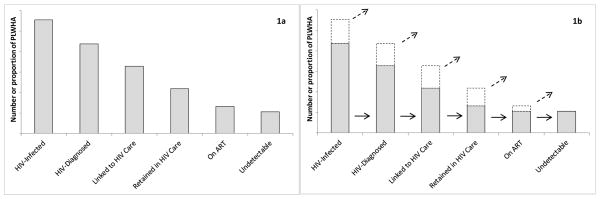
1a. The conventional cascade framework: a bar chart describing testing-, care-, and treatment-related attributes of the HIV-infected population, with sequentially smaller bars as the level of positive interaction with HIV testing and care services increases from left to right. 1b. Limitations of the conventional framework. It does not explicitly describe movement across cascade stages nor the disposition of those missing from subsequent bars; the implied interpretation is that a subset of people at each stage (lower gray segment of each bar) moves on to the next one (solid arrows), with the remaining subset (upper white segment with dashed border) exiting the cascade (dashed arrows) and acquiring an unknown disposition.
The population-level snapshots afforded by the HIV cascade provide critical data for monitoring uptake of HIV care services, which double as prevention strategies. Fundamental strengths of the cascade framework include its simplicity and intuitive format, as well as its flexibility in describing different geographical regions, population subgroups, and service settings. Additionally, the HIV cascade requires relatively few data points that can be obtained (though not without challenges9–12) from routine surveillance records and clinical databases in many settings. The combination of these elements provides an elegant, useful summary of several important diagnosis, care, and treatment indicators at the population level.
Although the HIV cascade has been an unquestionably important conceptual framework and an immensely useful contribution to HIV care and prevention efforts, several issues hinder its clear interpretation and practical utility (Figure 1b). In particular, the pathways into and out of each cascade stage are not explicitly described, such that unidirectional flow is often assumed. Additionally, the disposition of those who are “lost” at each juncture is not specified, and it is unclear whether or how such persons may re-enter the framework. For example, the “linked to HIV care” bar (Figure 1) is often defined as “accessing HIV care within 3 months of diagnosis,” with notable examples including the National HIV/AIDS Strategy and recommendations of both the US Institute of Medicine and the Department of Health and Human Services.5,6,8 But where do people who first entered care >3 months after diagnosis reside in this framework? When unidirectional movement is assumed, a similarly unclear fate befalls those who are not retained in care for some period, but subsequently re-engage. In short, current cascade-type structures are not designed to fully characterize the HIV-infected population and its members’ pathways through the healthcare system. Additional details about the status of the HIV-infected persons in a given population, as well as the processes underlying their movements through the healthcare system, could improve translation of cascade-related information into actionable public health priorities.
To address these gaps, we present a complementary schema – termed the “HIV States and Transitions” framework – that explicitly describes the states that PLWHA may be in and the transitions among those states. The proposed approach retains one key feature afforded by the traditional cascade framework: aggregation of the population into categories for valuable cross-sectional snapshots. However, to address the main limitations of the standard framework, the proposed schema requires that the fundamental set of aggregation categories are exhaustive and mutually exclusive, and it explicitly lays out the multidirectional pathways that HIV-infected persons can follow in moving from one category to another. Our proposed framework is intended to provide a common foundation from which to better characterize the dynamic interactions of HIV-infected persons with the health care system, improve understanding of barriers and facilitators to optimal engagement, and design and model interventions for maximum impact.
The “HIV States and Transitions” Framework
Framework Description
The HIV States and Transitions framework takes a system dynamics approach to framing and understanding the interactions of PLWHA with HIV diagnosis, care, and treatment services. As described in greater detail below, the fundamental building blocks of this approach are: 1) an exhaustive set of mutually exclusive states, and 2) the transitions among them.
The first key feature of the HIV States and Transitions framework is an explicit description of mutually exclusive states that, together, are designed to fully capture the entire HIV-infected population at a given point in time. This framework is flexible and adaptable, allowing a variety of specific approaches comprising different sets of particular states, especially with additional stratification for specific purposes. To ground the discussion, we present here a simple example of such an approach, one that delineates five broad states (listed in bold at the top of Figure 2) for HIV-infected persons: 1) undiagnosed; 2) diagnosed, but not in care; 3) diagnosed and in care, but not on ART; 4) diagnosed, in care, and on ART, but not virally suppressed; and 5) diagnosed, in care, on ART, and virally suppressed. To recognize the differences between those who have followed a unidirectional path through these states and those who have not, we stratify the middle three categories into more specific states distinguishing “those who have never been beyond” a given broad state (first row of boxes in Figure 2) and “those who have been beyond but have returned” (second through fourth rows in Figure 2). This approach fully specifies which of the five broad states a person is in currently, and in which of the five he or she has previously resided. (We note that in this particular example, being on ART requires being in care, and being virally suppressed requires being on ART; that is, those in the orange boxes are assumed to be neither on ART nor virally suppressed, and those in the green boxes are assumed not to be suppressed.)
Figure 2. Proposed “HIV States and Transitions” Framework.

Boxes represent states and arrows represent transitions. Each of the five broad states (listed along top) is stratified into those who have never been beyond a given state (top row of boxes) and those who have been beyond but have returned to a prior state (2nd – 4th rows of boxes). Solid arrows represent the first instance of progression; dashed arrows represent return to a prior state; dotted arrows represent subsequent progression. Characterization of a population using this framework calls for tabular/spreadsheet compilation of: 1) numbers and/or proportions of HIV-infected persons in each state (box) at a given point in time; and 2) the rates at which each transition (arrow) occurs. The number (or proportion) of people in all boxes of a given color sum to the bar segment of that color in Figure 3. (For example, the numbers corresponding to the three green boxes in this figure sum to the entire “diagnosed, in care, not on ART” population represented by the green bar sub-sections in Figure 3.) Figure 2 depicts the system in a closed population; in reality, migration and death will provide additional entries into and exits from each state (see text), and the framework can be adapted to accommodate them. Also note that although the multiple dotted (or dashed) arrows of a given color are not differentiated here, they can be assigned different transition rates in practice.
The second key feature of the HIV States and Transitions framework is its explicit delineation of movement across specific states, represented by arrows in Figure 2. Thus, the framework allows for clear identification of the routes of entry and exit into each state, including multidirectional movement. Furthermore, the framework distinguishes between first and subsequent transitions to a given broad state (solid vs. dotted arrows), such as initial entry versus re-entry to care. These distinctions are important, as interventions to (for example) improve linkage of newly diagnosed persons look quite different from interventions to re-engage those who have been lost to follow-up.
Characterization of a population using this framework calls for tabular/spreadsheet compilation of: 1) numbers and/or proportions of HIV-infected persons in each specific state (box) at a given point in time; and 2) the rates at which each transition (arrow) occurs.
Framework Translation to Public Health Action
While quantitative monitoring of the numbers in each state will provide useful snapshots of engagement levels, estimation of the transition rates associated with each arrow will elucidate the ways in which the numbers in each state are changing and how they can be manipulated to improve outcomes. Detection of bottlenecks where forward progress is slow, as well as weak points where backward movement is prevalent, will allow identification and prioritization of discrete “pressure points” for intervention. Information on barriers to and facilitators of each transition can inform the development of specific interventions to be applied at each point. Characteristics of persons likely to transition smoothly through the states can be distinguished from those with non-linear pathways to allow tailored intervention approaches.
The proposed framework is particularly well-suited to mathematical modeling analyses, which can combine serial, cross-sectional data on the numbers in each specific state with quantitative values for the transition rates across them. Indeed, states and transitions represent the fundamental components of many mathematical model types, so the proposed approach lends itself naturally to such analyses. Mathematical models can thus use information captured by the states and transitions framework to quantitatively describe movement through the system, estimate and compare the impact of various interventions, project future epidemic and cascade-related trends, identify optimal intervention packages, and guide resource allocation.
Framework Operationalization and Data Needs
The states and transitions framework requires two types of estimates: the numbers of people in each specific state (box) at regular intervals, and the rates at which each transition from one state to another (arrows) occurs.
The numbers of undiagnosed PLWHA (red box) and the rate of transition to “diagnosed” status (solid orange arrow) may be estimated using back-calculation approaches, testing data, and/or population sero-surveys. The population estimates associated with the orange, green, blue, and purple boxes (and the transitions among them) would be best estimated with longitudinal, individual-level data on care, treatment, and viral suppression from clinical databases or surveillance records, depending on data availability and the population and perspective of interest. These data would allow calculation of the numbers in each specific state at any given point in time, based not only on each person’s current status with respect to care, treatment, and viral suppression, but also on their previous experience with each of those elements. The transition rates associated with each arrow are also calculable from such longitudinal data by determining where each person moves after residing in a given box, and estimating the average time before a given transition occurs. For example, estimation of the current number of people in the middle green box requires a count of the people who are currently diagnosed, in care, and not on ART, but who were previously on ART with no prior viral suppression. Estimation of the blue dotted arrow emanating from this box would require estimating the average rate at which people in this box re-initiate ART.
The ideal data system for populating the entire framework would contain electronic records that are indexed by unique personal identifiers and linked across service provision sites (e.g., testing sites, treatment centers), vital status databases, and jurisdictions. The extent to which these data system features are currently available varies considerably across settings. For example, individual-level, electronic data on care and treatment are available for multiple clinical cohorts in the US,13,14 but these data are not readily linked to external settings where patients may have received HIV testing or transferred for care. Routine HIV case surveillance data in the US15 capture laboratory proxies for receipt of care at multiple sites within a jurisdiction, but testing and treatment data are limited, and transfers outside of a jurisdiction are difficult to monitor. Countries with national registries, centralized HIV care, and single-payer health systems16 are particularly well-positioned to create the integrated data systems best-suited to analysis of both the HIV cascade and the proposed states and transitions framework. Robust HIV monitoring systems are lacking in many resource-limited settings; however, exceptions that include some of the ideal features we describe here are beginning to emerge.17
Improved data systems remain an important priority for HIV testing, care, treatment, and surveillance programs worldwide.12,17 With improved data systems will come increased capacity to characterize both the traditional cascade and the framework proposed here. In the meantime, data triangulated from multiple sources – each informing a different portion of the states and transitions framework – may be required to populate the model.
Relationship between “States and Transitions” Framework and Traditional Cascade
The states and transitions framework still enables calculation of useful population-level summaries comparable to the standard cascade. The numbers or proportions of people in the mutually exclusive states can be combined in various ways to unambiguously represent particular subgroups of interest (the different bars in Figure 3), allowing characterization of the entire HIV-infected population, as well as clear identification of overlaps and complements at different levels of aggregation. In the example that we present here, each subsequent bar from left to right in Figure 3 represents a higher level of interaction with the healthcare system and/or a step change in the potential for transmission: being diagnosed is associated with a ~50% reduction in transmission risk behaviors;18 being in care with a further ~50%;19 and being virally suppressed on ART with a further 96% reduction in biological risk.20 The goal of HIV care and prevention efforts is thus to minimize the red, orange, green, and blue segments of these bars and to maximize the contribution of the purple segment. More detailed variations of Figure 3 – for example, with sub-division of each bar to represent all eleven of the boxes in Figure 2 – are possible if desired for a given application.
Figure 3. Translation of “HIV States and Transitions” framework into bar chart form: aggregation, overlaps, and complements.

The five proposed states (represented by the five different colors) and combinations thereof. The particular proportions shown are hypothetical and do not represent a specific population.
The view of the states and transitions framework given in Figure 2 complements the more standard bar chart format of Figure 3 by providing a detailed description of how the values corresponding to a given bar arise. For example, while the traditional cascade framework (and indeed Figure 3) can tell us the size of the population that is currently on ART, it cannot tell us the extent to which the small size of this bar is due to failures in initiating ART versus failures in remaining on ART after initiation. If the size of this bar increases from, say, 30% to 40%, it would be useful to know how much of the change is due to increased ART initiation versus increased retention on ART. These details (which are not included in any manner in the current cascade) are represented in the Figure 2 “view” of the states and transitions framework, providing information on the processes that lie “behind” the cascade. Understanding the relative contributions of each of these processes is critical for intervention design and resource allocation, allowing us to answer such as questions as, “Which interventions are having the biggest effect?” and “Would future interventions targeting ART initiation vs. discontinuation have a greater impact?”
Discussion
HIV cascade (i.e., “continuum”) frameworks are extremely important and useful in describing key aspects of population-level engagement with HIV diagnosis, care, and treatment services. However, current formulations of these frameworks do not fully characterize the HIV-infected population or enumerate their multidirectional pathways through the healthcare system. We have proposed an “HIV States and Transitions” framework (Figure 2) specifically designed to provide this information.
Our proposed schema comprises a set of mutually exclusive states designed to fully capture all HIV-infected persons in a population at any given time, as well as an explicit description of transitions across states. The states can be aggregated in unambiguous ways to describe population-level engagement with diagnosis, care, and treatment at a given point in time in a format that is similar to the traditional cascade. The transitions explicitly allow “backward” and “cyclical” movement in describing the processes that affect the numbers in each specific state. By providing details about the processes lying behind the cascade, these transitions represent the main conceptual distinction between the states and transitions framework and the conventional cascade that it is intended to complement. Disentanglement of states from transitions allows explicit recognition that these aspects are distinct characteristics of the HIV-related healthcare system, both of which need to be understood for monitoring the system and planning interventions. Both states and transitions can be studied using clinical records, surveillance system data, and population surveys. These activities can provide information about numbers in each state and the rates of transitions across states, allowing mathematical modeling efforts built on this type of framework to identify optimal intervention points and predict intervention impact.
We chose the five broad states included here because each forward transition represents a “step-change” in terms of beneficial contact with the healthcare system and/or transmission rates. However, our main intent was not to identify the optimal set of states to include, but rather to put forth a more general proposal: that we re-conceptualize the HIV cascade as a complex system of states and transitions. We chose what we believe to be the minimal set of states to sufficiently describe the system in a reasonable way, but certain inherent simplifying assumptions warrant mention. For example, the specific framework illustrated here does not include “not in care, but on ART” or “not on ART, but virally suppressed” states; instead, everyone who is not in care is assumed not to be on ART, and everyone who is not on ART is assumed not to be virally suppressed. The numbers of people who are “on ART but not in care” or “virally suppressed but not on ART” (i.e., elite controllers) are likely to be small, but the actual sizes of these subgroups will depend on the precise dichotomous definitions for being “in care,” “on ART,” and “virally suppressed.” For example, a strict definition of “in care” that requires very frequent visits may result in a relatively greater number of people who are “on ART but not in care” (i.e., not captured in this framework) than will a less stringent definition. Thus, definitions need to be chosen with care, and modifications that alter the set of specific included states may be useful in some applications.
The currently proposed states may be stratified further to allow more detailed characterization of the system if needed. For example, the initial “in care” compartment (green box in first row of Figure 2) could be stratified into those who link “quickly” after diagnosis (e.g., within 3 months) and those who do not, with two different transition rates to accompany them. Inclusion of such stratifications at each step could allow for “fast track” and “slow track” pathways throughout the system. Further disaggregation of the specific states into the number of times that a person has previously been in a given state (2nd treatment drop-out vs. first, etc.) may also be useful for some applications. However, current understanding of patient “phenotypes” and trajectories is limited, and detailed pattern analyses are likely needed to delineate a finite set of pathways and speeds that adequately describe movement through the system.
Additional stratifications of the “in care” and “on treatment” compartments to allow for different levels of engagement (e.g., poor, moderate, and optimal) may also be considered. Such stratifications could more fully capture the true spectral (rather than dichotomous) nature of care and treatment, with movement along various “in care” and “on treatment” levels. Current21 and additional research to characterize these spectra, along with the relationships between various points on the spectra and both clinical and preventive outcomes,22,23 will enable improved representation of these constructs in the proposed framework. The inclusion of other important processes, most notably migration and death, would also represent important extensions of the proposed framework. All of these additional complexities – in terms of heterogeneous patient trajectories, spectral aspects of care and treatment, and inclusion of demographic processes – can be layered into the proposed framework as we gain empirical understanding of engagement patterns and different treatment and care measures. The HIV States and Transitions framework is adaptable, allowing the addition of these complexities to yield more nuanced analyses and deeper understanding.
Aspects of the proposed schema build on inspirations from several other investigators. For example, transitions similar to the “side doors” that Hallett and Eaton propose24 appear in our framework in the form of dotted arrows in Figure 2. More complex renditions of the states and transitions framework – those that consider interactions between disease progression and healthcare seeking, as well as “fast” and “slow” tracks at each juncture – could explicitly incorporate additional “side doors” for those who do not engage in care at all until they are ill. Other authors have acknowledged engagement in care as a “continuum,” noted bi-directional flow, and explicitly identified linkage, retention, and re-engagement as separate processes.25,26 However, none of these previous efforts separates the HIV-infected population into mutually exclusive states or delineates the transitions among them in sufficient detail to allow full characterization of the system.
Our modified framework remains subject to numerous estimation challenges that have faced the conventional cascade framework, including fragmentation and limited representativeness of surveillance and programmatic data,9,12 as well as difficulty in defining (and communicating across) the boundaries of the population and system of interest. One major challenge is distinguishing people who are truly “out of care” from those who have died or transferred to another clinic outside of the analysis frame.10,11 Intensive efforts are underway to characterize many of these challenges;10,11 additional efforts to overcome them will be essential to accurate understanding of HIV diagnosis, care, and treatment at the population level. Our goal was not to solve these sizeable estimation challenges, but rather to address some key conceptual gaps in the theoretical underpinnings of cascade measurement, such that the conceptual framework behind cascade measurement evolves alongside active efforts to improve data collection and integration.17 The development of optimal data systems to quantify both the traditional cascade and the data-intensive framework proposed here will require a great deal of thought and effort.
With this work, we sought to develop a new, internally consistent conceptual framework with sufficient detail to characterize the HIV-infected population and its dynamic interactions with the healthcare system. The proposed framework retains many key strengths of the traditional cascade, but adds depth and clarity around the processes underlying it. Through the explicit identification of exhaustive, mutually exclusive states and the multidirectional transitions among them, we hope that the proposed “HIV States and Transitions” framework will provide an adaptable, improved theoretical basis for grounding empirical estimates, making comparisons across settings, informing interventions, and advancing our understanding of HIV diagnosis, care, and treatment worldwide.
Acknowledgments
This work was supported by the National Institutes of Health (grant numbers KL2 TR001109, R03 MH100987, UL1 TR001111) and an administrative supplement to the UNC Center for AIDS Research (P30 AI50410). The funding sources had no involvement in the development of this work. This work was presented at a workshop entitled “HIV Treatment Implementation: Understanding and Improving the Treatment Cascade,” held by the Bill & Melinda Gates Foundation in Paris, France in June 2014. We thank the following people for helpful comments on an early draft of this manuscript: Jeffrey Eaton, PhD; Timothy Hallett, PhD; Catherine Lesko, MPH; Christopher Sellers, MD; Emily Smith, MPH; Morris Weinberger, PhD; and Tyler Buckner, MD.
Footnotes
Conflicts of Interest: We declare that we have no conflicts of interest.
References
- 1.Greenberg AE, Hader SL, Masur H, et al. Fighting HIV/AIDS in Washington, DC. Health Aff. 2009;28:1677–1687. doi: 10.1377/hlthaff.28.6.1677. [DOI] [PubMed] [Google Scholar]
- 2.Gardner E, McLees MP, Steiner JF, et al. The spectrum of engagement in HIV care and its relevance to test-and-treat strategies for prevention of HIV infection. Clin Infect Dis. 2011;52:793–800. doi: 10.1093/cid/ciq243. [DOI] [PMC free article] [PubMed] [Google Scholar]
- 3.Cohen S, Van Handel MM, Branson BM, et al. Vital Signs: HIV prevention through care and treatment. MMWR. 2011;60:1618–1623. [PubMed] [Google Scholar]
- 4.World Health Organization. Consolidated guidelines on the use of antiretroviral drugs for treating and preventing HIV infection. Geneva: World Health Organization; 2013. [Accessed 13 June 2014]. Available at: http://www.who.int/hiv/pub/guidelines/arv2013/en/ [Google Scholar]
- 5.Office of National AIDS Policy (US) National HIV/AIDS strategy for the United States. Washington: Office of National AIDS Policy; 2010. [Accessed 13 June 2014]. Available at: http://www.whitehouse.gov/sites/default/files/uploads/NHAS.pdf. [Google Scholar]
- 6.Institute of Medicine, Committee to Review Data Systems for Monitoring HIV Care. Monitoring HIV care in the United States: indicators and data systems. Washington: Office of National Academies Press; 2012. [PubMed] [Google Scholar]
- 7.Whiteside YO, Cohen SM, Bradley H, et al. Progress along the continuum of HIV care among blacks with diagnosed HIV – United States, 2010. MMWR. 2014;63:85–89. [PMC free article] [PubMed] [Google Scholar]
- 8.Valdiserri RO, Forsyth AD, Yakovchenko V, et al. Measuring what matters: development of standard HIV core indicators across the US Department of Health and Human Services. Pub Health Rep. 2013;128:355–359. doi: 10.1177/003335491312800504. [DOI] [PMC free article] [PubMed] [Google Scholar]
- 9.Miller WC, Lesko K, Powers KA. The HIV care cascade: simple concept, complex realization. Sex Transm Dis. 2014;41:41–42. doi: 10.1097/OLQ.0000000000000081. [DOI] [PMC free article] [PubMed] [Google Scholar]
- 10.Geng E, Glidden DV, Bosco Bwana M, et al. Retention in care and connection to care among HIV-infected patients on antiretroviral therapy in Africa: estimation via a sampling-based approach. PLoS One. 2011;6:e21797. doi: 10.1371/journal.pone.0021797. [DOI] [PMC free article] [PubMed] [Google Scholar]
- 11.Buskin SE, Kent JB, Dombrowski JC, et al. Migration distorts surveillance estimates of engagement in care: results of public health investigations of persons who appear to be out of HIV care. Sex Transm Dis. 2014;41:35–40. doi: 10.1097/OLQ.0000000000000072. [DOI] [PMC free article] [PubMed] [Google Scholar]
- 12.Mugavero MJ, Norton WE, Saag MS. Healthcare system and policy factors influencing engagement in HIV medical care: piecing together the fragments of a fractured health care delivery system. Clin Infect Dis. 2011;52(Suppl 2):S238–S246. doi: 10.1093/cid/ciq048. [DOI] [PMC free article] [PubMed] [Google Scholar]
- 13.Kitahata K, Rodriguez B, Haubrich R, et al. Cohort Profile: the Centers for AIDS Research Network of Integrated Clinical Systems. Int J Epidemiol. 2008;37:948–955. doi: 10.1093/ije/dym231. [DOI] [PMC free article] [PubMed] [Google Scholar]
- 14.Gange SJ, Kitahata MM, Saag MS, et al. Cohort profile: the North American AIDS Collaboration on Research and Design (NA-ACCORD) Int J Epidemiol. 2007;36:294–301. doi: 10.1093/ije/dyl286. [DOI] [PMC free article] [PubMed] [Google Scholar]
- 15.Centers for Disease Control and Prevention. [Accessed January 10, 2015];HIV surveillance supported by the Division of HIV/AIDS Prevention. http://www.cdc.gov/hiv/statistics/recommendations/publications.html.
- 16.Helleberg M, Haggblom A, Sonnerborg A, Obel N. HIV care in the Swedish-Danish HIV Cohort 1995–2010, Closing the gaps. PLoS One. 2013:e72257. doi: 10.1371/journal.pone.0072257. [DOI] [PMC free article] [PubMed] [Google Scholar]
- 17.Osler M, Hilderbrand K, Hennessey C, et al. A three-tier framework for monitoring antiretroviral therapy in high HIV burden settings. J Int AIDS Soc. 2014;17:18908. doi: 10.7448/IAS.17.1.18908. [DOI] [PMC free article] [PubMed] [Google Scholar]
- 18.Marks G, Crepaz N, Senterfitt JW, et al. Meta-analysis of high-risk sexual behavior in persons aware and unaware they are infected with HIV in the United States: implications for HIV prevention programs. J Acquir Immune Defic Syndr. 2005;39:446–453. doi: 10.1097/01.qai.0000151079.33935.79. [DOI] [PubMed] [Google Scholar]
- 19.Metsch LR, Pereyra M, Messinger S, et al. HIV transmission risk behaviors among HIV-infected persons who are successfully linked to care. Clin Infect Dis. 2008;47:577–584. doi: 10.1086/590153. [DOI] [PubMed] [Google Scholar]
- 20.Cohen MS, Chen YQ, McCauley M, et al. Prevention of HIV-1 infection with early antiretroviral therapy. N Engl J Med. 2011;365:493–505. doi: 10.1056/NEJMoa1105243. [DOI] [PMC free article] [PubMed] [Google Scholar]
- 21.Mugavero MJ, Davila JA, Nevin CR, et al. From access to engagement: measuring retention in outpatient HIV clinical care. AIDS Patient Care STDs. 2010;24:607–613. doi: 10.1089/apc.2010.0086. [DOI] [PMC free article] [PubMed] [Google Scholar]
- 22.Keller SC, Yehia BR, Eberhart MG, et al. Accuracy of definitions for linkage to care in persons living with HIV. J Acquir Immune Defic Syndr. 2013;63:622–630. doi: 10.1097/QAI.0b013e3182968e87. [DOI] [PMC free article] [PubMed] [Google Scholar]
- 23.Dombrowski JC, Kent JB, Buskin SE, et al. Population-based metrics for the timing of HIV diagnosis, engagement in HIV care, and virologic suppression. AIDS. 2012;26:77–86. doi: 10.1097/QAD.0b013e32834dcee9. [DOI] [PMC free article] [PubMed] [Google Scholar]
- 24.Hallett TB, Eaton JW. A side door in to care cascade for HIV-infected patients? J Acquir Immune Defic Syndr. 2013;63:S228–S232. doi: 10.1097/QAI.0b013e318298721b. [DOI] [PubMed] [Google Scholar]
- 25.Mugavero MJ, Amico KR, Horn T, et al. The state of engagement in HIV care in the United States: from cascade to continuum to control. Clin Infect Dis. 2013;57:1164–1171. doi: 10.1093/cid/cit420. [DOI] [PubMed] [Google Scholar]
- 26.McNairy ML, El-Sadr WM. The HIV care continuum: no partial credit given. AIDS. 2012;26:1735–1738. doi: 10.1097/QAD.0b013e328355d67b. [DOI] [PubMed] [Google Scholar]