

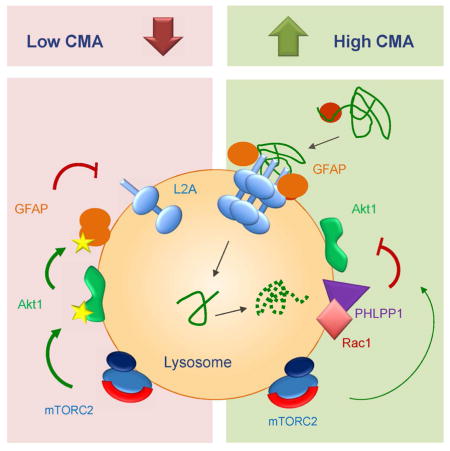
SUMMARY
Chaperone-mediated autophagy (CMA), a selective form of degradation of cytosolic proteins in lysosomes, contributes to maintenance of proteostasis and to the cellular adaptation to stress. CMA substrates are delivered by a cytosolic chaperone to the lysosomal surface, where upon unfolding, are internalized through a membrane translocation complex. The molecular components that participate in CMA substrate targeting and translocation are well characterized but those involved in CMA regulation remain mostly unknown. In this study, we have identified that CMA is under the positive control of the phosphatase PHLPP1 that associates with the lysosomal membrane and counteracts the inhibitory effect of mTORC2 on CMA. Lysosomal Akt, a target of the mTORC2/PHLPP1 kinase-phosphatase pair, modulates CMA activity by controlling the dynamics of assembly and disassembly of the CMA translocation complex at the lysosomal membrane. The lysosomal mTORC2/PHLPP1/Akt axis could become a target to restore CMA dysfunction in aging and disease.
Graphical Abstract
INTRODUCTION
Autophagy is responsible for the continuous clearance of cellular components through lysosomal degradation (Mizushima et al., 2008) thus contributing to the maintenance of cellular homeostasis, removal of damaged proteins and adaptation to environmental stressors (Kroemer et al., 2010). Three types of autophagy co-exist in mammalian cells: macroautophagy, microautophagy and chaperone-mediated autophagy (CMA). Substrate proteins for CMA, instead of being sequestered in vesicles, reach the lysosomal lumen after directly crossing the lysosomal membrane (Kaushik and Cuervo, 2012).
The molecular components that target and translocate CMA substrate proteins across the lysosomal membrane include chaperones, integral membrane proteins and cytosolic proteins that associate transiently with the lysosomal membrane. Substrate proteins are identified by hsc70 that brings them to the surface of the lysosomal membrane (Chiang et al., 1989). Binding of substrates to the cytosolic tail of the lysosome-associated membrane protein type 2A (LAMP-2A) (Cuervo and Dice, 1996) induces the organization of this single span membrane protein into a multimeric complex that facilitates substrate translocation (Bandyopadhyay et al., 2008). Chaperones at both sides of the lysosomal membrane facilitate substrate unfolding and translocation (Agarraberes et al., 1997; Cuervo et al., 1997). Once the substrate protein crosses the lysosomal membrane, the translocation complex disassembles into monomeric forms of LAMP-2A to allow a new cycle of substrate binding and translocation (Bandyopadhyay et al., 2008). A pair of proteins, glial fibrillary acidic protein (GFAP) and elongation factor 1α (EF1α) modulates the dynamics of LAMP-2A assembly and disassembly (Bandyopadhyay et al., 2010). Unmodified GFAP binds LAMP-2A at the multimeric complex and contributes to its stabilization. Phosphorylated GFAP (pGFAP) has low binding affinity for LAMP-2A and associates instead with the lysosomal membrane in a complex with EF1α. Upon substrate translocation, EF1α is released and the higher affinity of GFAP for pGFAP than for LAMP-2A promotes the formation of a GFAP/pGFAP dimer and the disassembly of LAMP-2A as GFAP leaves the translocation complex (Bandyopadhyay et al., 2010).
Basal CMA activity is detected in almost all cell types (Koga et al., 2011), but maximal CMA activation is attained in response to cellular stressors such as starvation (Cuervo et al., 1995), oxidative stress (Kiffin et al., 2004), hypoxia (Hubbi et al., 2013) or genotoxic stress (Park et al., 2015). The signaling pathways behind stress-induced CMA activation remain unknown. In this work, using genetic and chemical blockage of cellular kinases and phosphatases, we have identified a CMA regulatory axis comprised of the Pleckstrin homology (PH) domain and leucine-rich repeat protein phosphatase 1 (PHLPP1), the mammalian target of rapamycin complex 2 (mTORC2) and their common downstream target Akt. The two kinases, mTORC2 and Akt, exert an inhibitory effect on CMA directly at the membrane of the subgroup of lysosomes committed to CMA, where they negatively modulate the dynamics of the CMA translocation complex, at least in part through phosphorylation of GFAP. This inhibitory effect is neutralized during stress conditions by the recruitment of PHLPP1 to the lysosomal membrane. Our studies unveil that this lysosomal mTORC2/PHLPP1/Akt signaling axis modulates basal CMA activity and its activation in response to cellular stress.
RESULTS
PHLPP1 is an activator of CMA
Using a lentiviral-delivered shRNA sub-library targeting human phosphatases and a neuroblastoma cell line (SH-SY5Y) expressing a photoactivable fluorescent reporter for CMA (KFERQ-PA-mCherry1) (Koga et al., 2011), we identified that stable knock-down (KD) of PHLPP1 reduced CMA activity, suggesting a putative CMA stimulatory role for this phosphatase. CMA activation can be detected as a change in the fluorescence pattern of KFERQ-PA-mCherry1 from diffuse to punctate when this fluorescent CMA substrate is delivered to lysosomes. The number of fluorescent puncta per cell is a reliable measurement of CMA activity (Koga et al., 2011). Mouse fibroblasts (NIH3T3 cells) expressing the CMA reporter and KD for PHLPP1 (Fig. S1A) display a significant reduction in fluorescent puncta when maintained in serum-supplemented media (basal CMA activity) that becomes even more evident upon maximal activation of CMA by serum removal (Fig. 1A and S1B). Changes in CMA are not reactive to macroautophagy alterations, as macroautophagy activity (measured as LC3 flux) was comparable in control and PHLPP1 KD cells (Fig. S1C–E).
Fig. 1. PHLPP1 positively modulates CMA activity.

A. Mouse fibroblasts control or stably knocked-down (KD) for PHLPP1 expressing the KFERQ-PA-mCherry1 CMA reporter and maintained in the presence (+) or absence (−) of serum. Right: Average number of puncta per cell. (n>75 cells). B. Immunoblot for phosphorylated and total Akt in cells maintained in the presence or absence of serum and supplemented with a PHLPP1 inhibitor as indicated. C, D. Mouse fibroblasts expressing the CMA reporter, treated or not with a PHLPP1 inhibitor (10μM) and maintained in the presence or absence of serum (C) or of paraquat (PQ; 50μM) or thapsigargin (TG; 10nM) (D). Bottom: quantification as in A. (n>50 cells). E. Proteolysis of a pool of radiolabeled cytosolic proteins by intact (left) or disrupted lysosomes (right) isolated from control cells or PHLPP1 KD cells, n=3. F. Immunoblot for GAPDH of lysosomes isolated as in E but incubated with purified GAPDH in the presence or absence of leupeptin (Leu). Right: GAPDH binding and uptake, n=3. All values are mean+s.e.m., and differences are significant for p<0.05. See also Figure S1.
Maximal activation of CMA does not only require PHLPP1 but it is directly linked to its phosphatase activity. Treatment with a small molecule selective inhibitor against the catalytic site of PHLPP1 (NSC ID: 117079) (Sierecki et al., 2010) at concentrations that efficiently blocked PHLPP1 phosphatase activity against Ser473 in Akt1, one of the best-characterized PHLPP1 substrates (Fig. 1B and S1F) revealed a dose-dependent compromise in CMA activation in response to serum removal, and, at the highest doses, a reduction in basal CMA (Fig. 1C). PHLPP1 inhibition also decreased CMA activation in response to oxidative stress induced by treatment with paraquat (PQ), but did not affect the activation of this pathway in response to thapsigargin-induced ER stress (TG) (Fig. 1D), in support that the involvement of PHLPP1 in CMA activation may be stimulus-dependent.
We confirmed the dependence on PHLPP1 for maximal activation of CMA in vitro using isolated lysosomes (Kaushik and Cuervo, 2009). Incubation of the subpopulation of CMA-competent lysosomes with a pool of radiolabeled proteins enriched in CMA substrates revealed significantly lower levels of degradation of these proteins by lysosomes isolated from PHLPP1 KD cells as compared to those from control cells (Fig. 1E left). This assay recapitulates substrate binding, uptake and degradation, but because the proteolytic activity of both groups of lysosomes was comparable (upon disruption of their membranes; Fig. 1E right), we concluded that the observed differences between control and PHLPP1 KD cells were mainly due to reduced uptake via CMA. In fact, PHLPP1 depletion did not reduce lysosomal binding of the well-characterized CMA substrate glyceraldehyde-3-phosphate dehydrogenase (GAPDH) (instead we observed an increase in lysosome-associated GAPDH) whereas it significantly reduced GAPDH uptake (calculated as the differences between the amount of GAPDH bound to lysosomes treated with protease inhibitors to prevent its luminal degradation and that in untreated lysosomes where all the translocated GAPDH is rapidly degraded) (Fig. 1F). These results suggest that PHLPP1 enhances CMA activity by promoting lysosomal translocation of CMA substrates.
PHLPP1 activates CMA through its inhibitory effect on Akt
To determine if any of the two best characterized cellular substrates of PHLPP1, Akt (Gao et al., 2005) and protein kinase C (PKC) (Gao et al., 2008) was linked to its stimulatory effect on CMA, we performed reconstitution experiments in PHLPP1 KD cells (Fig. S1G). Expression of either full length PHLPP1 or an N-terminus truncated variant of this protein, with an intact Akt1 binding site but unable to interact with PKC (Gao et al., 2008; Gao et al., 2005), was able to revert the decrease in CMA observed in the knock-down cells (Fig. 2A). In fact, the expression of the exogenous PHLPP1 at levels higher than the endogenous PHLPP1 (Fig. S1G) is probably the reason for the upregulation of CMA in the restored cells when compared to control cells.
Fig. 2. Protein kinase Akt is an endogenous inhibitor of CMA.

A. CMA activity in mouse fibroblasts control or knocked-down for PHLPP1 (KD) expressing or not full-length PHLPP1 or a truncated form lacking the PKC binding domain (ΔPH) (see scheme). Left: Immunoblot for the indicated proteins. Middle: representative images after transduction with the KFERQ-PS-CFP reporter and immunostaining for PHLPP1. Right: Average number of puncta per cell (n>40 cells). B. Left: Representative images and quantification of number of puncta per cell in mouse fibroblasts expressing the CMA reporter, treated or not with two different Akt inhibitors (Akti) and maintained in the presence or absence of serum. n>75 cells Right: Phosphorylated and total Akt of the same cells after addition of PDGF (5min) to support efficiency of the inhibitors. C. Representative images and average number of puncta per cell in embryonic fibroblasts from mice wild type or knockout (KO) for Akt1 or Akt2 expressing the CMA reporter. Right: Immunoblot for Akt proteins in extracts of the same cells. D. Proteolysis of a pool of radiolabeled cytosolic proteins by intact lysosomes from cells control or Akt1 KO, n=3. E. Representative images and quantification of number of puncta per cell of PHLPP1 KD cells expressing the CMA reporter untreated (None) or treated with the indicated Akt inhibitors. n>50 cells. All values are mean+s.e.m., and differences with control (#) or untreated (*) are significant for p<0.05. See also Figure S1 and S2.
We next assessed CMA activity in fibroblasts in culture treated with two different cell-permeable Akt inhibitors at doses that prevented the PDGF-induced phosphorylation of Akt at Serine 473, the residue dephosphorylated by PHLPP1 (Gao et al., 2005). Chemical inhibition of Akt did not modify starvation-induced CMA but led to its constitutive upregulation (Fig. 2B). Similar upregulation of basal CMA was observed in mouse embryonic fibroblasts (MEFs) from mice knockout (KO) for Akt1 but not in MEFs from Akt2KO mice (Fig. 2C) and in lysosomes isolated from Akt1KO cells (Fig. 2D). Interestingly, inhibition of Akt was sufficient to eliminate the decrease in CMA observed in PHLPP1 KD cells, suggesting that part of the inhibitory effect on CMA in absence of PHLPP1 was due to upregulation of Akt (Fig. 2E).
Overall, these results support an inhibitory effect of Akt1 on CMA that can be neutralized by the phosphatase activity of PHLPP1.
A CMA kinase/phosphatase regulatory complex at the lysosomal membrane
Changes in CMA activity in lysosomes from cells defective in PHLPP1 (Fig. 1E, F) or Akt1 (Fig. 2D) could be a consequence of the effect of these proteins in multiple cellular compartments. To analyze a possible direct effect of PHLPP1 and Akt1 in lysosomes, we treated lysosomes isolated from starved rat livers with inhibitors of both proteins and analyzed their ability to directly take up substrates via CMA in vitro (treatment with these inhibitors did not disrupt lysosomal integrity as assayed by hexosaminidase release; Fig. S1H). We found that two different PHLPP1 inhibitors reduced the degradation of the pool of radiolabeled cytosolic proteins by lysosomes, whereas the two Akt inhibitors increased lysosomal proteolysis of these substrates but only when the lysosomal membrane was intact (Fig. 3A). Inhibition of protein kinase C, the other possible PHLPP1 substrate, did not have an effect on the activity of intact or disrupted lysosomes, further confirming that the effect of this phosphatase on CMA was likely mediated by Akt.
Fig. 3. Lysosomal association and topology of CMA regulatory kinases and phosphatases.

A. Quantification of proteolysis in rat liver intact or broken lysosomes subjected to the indicated treatments (none, PHLPP1 inhibitor, Akt inhibitors or PKC inhibitor). n=3. B. Immunoblot of subcellular fractions isolated from livers of 48h starved rats. Hom: homogenate; Cyt: cytosol; CMA+ and CMA−: lysosomes active or inactive for CMA. Right in B: enrichment of PHLPP1 and Akt in CMA+ and CMA− lysosomes relative to homogenate. n=4. C–E. Immunoblot of lysosomes and lysosomal membranes (Mb) and matrices (Mtx) isolated from starved rat liver (C), intact lysosomes treated with increasing concentrations of trypsin alone or with Triton X-100 (Tri) (D) and lysosomes from starved rats untreated (None) or injected with leupeptin 2h before isolation (E). F. Immunoblot for homogenates (Hom) and lysosomes (lys) isolated from cells maintained in the absence of serum for 24h and treated or not with the PHLPP1 inhibitors (an additional independent experiment is shown in Fig. S2D). G. Immunoblot of fractions from livers of 48h starved rats as in B. H. Representative merged images of co-immunostaining for LAMP-1 and rictor in cells maintained in the presence or absence of serum for 24h. Right: Images from the same cells showing colocalization pixels in white. Insets: higher magnification images. I. Percentage of colocalization of LAMP1 with rictor calculated from images as the ones shown in H (n>50 cells). All values are mean+s.e.m. and differences are significant for p<0.05. See also Figure S2 and S3.
We found that a fraction of PHLPP1 colocalized with the lysosomal marker LAMP1 (Fig. S2A) and immunoblot in isolated fractions revealed that PHLPP1 was enriched in the subpopulation of lysosomes with higher activity for CMA (those containing hsc70 in their lumen) whereas it was almost undetectable in a related lysosomal subgroup incompetent for CMA (Fig. 3B; purity of the isolated lysosomal fractions is shown in Fig. S1I). Lysosomal PHLPP1 was observed as two bands of comparable intensity, one at 171kDa (predicted molecular weight of full-length PHLPP1) and a second at approximately 238kDa, described to be a variant of PHLPP1 (Fig. 3B). In some instances, a less abundant lower molecular weight form of the protein of approximately 120kDa was also detected. Separation of lysosomal membranes (Mb) and matrices (Mtx) revealed that most of PHLPP1 was detected in the lysosomal membrane fraction (Fig. 3C) and was susceptible to exogenously added trypsin, confirming its location on the cytosolic side of the membrane (Fig. 3D; hsp40 and LAMP1 are controls of proteins on the cytosolic and luminal side of the lysosomal membrane, respectively). Blockage of lysosomal degradation by injection of rats with leupeptin did not increase levels of PHLPP1 in CMA-active lysosomes (Fig. 3E), suggesting that the presence of PHLPP1 in lysosomes was not for its degradation (Fig. S2B shows as positive and negative controls a well-known CMA substrate (GAPDH) and a non-CMA substrate (Hexokinase)). Immunoblot of the same fractions revealed preferential association of Akt with lysosomes active for CMA (Fig. 3B) and its presence in the lumen and cytosolic side of the lysosomal membrane (Fig. 3C,D). Immunofluorescence confirmed the colocalization of pAkt with different lysosomal markers (Fig. S2C). Treatment of cultured cells (Fig. 3F and S2D) or even isolated lysosomes (Fig. S2E) with the PHLPP1 inhibitor increased the amount of phosphorylated Akt (pAkt) in CMA active lysosomes, confirming the contribution of lysosomal PHLPP1 to Akt dephosphorylation.
Akt activity is usually regulated by phosphorylation and dephosphorylation, and TORC2 is the best characterized Akt kinase (Sarbassov, 2005). Immunoblot revealed similar levels of mTOR in both groups of lysosomes, and that whereas raptor, distinctive component of TORC1, was more abundant in the group of lysosomes with lower CMA activity, rictor, the protein associated with mTOR in TORC2, was only detected in the subgroup of lysosomes capable to perform CMA (Fig. 3G). Immunofluorescence confirmed the association of rictor with lysosomes in fibroblasts and other cell types (Fig. 3H and S2F, G, I; the specificity of the antibody against rictor was validated using rictor KD cells and rictor KO mice MEFs). TORC2 component proteins were mainly present at the lysosomal membrane (Fig. S3A) facing the cytosolic side (Fig. S3B) and did not undergo noticeable degradation in this compartment (Fig. S3C).
Overall, these findings reveal the presence of Akt1 and its regulatory kinase and phosphatase at the surface of lysosomes committed to CMA, suggesting that the observed modulatory effect of this kinase/phosphatase complex on CMA may occur, for the most part, directly at the lysosomal membrane.
TORC2 exerts an inhibitory effect on CMA
The observed inhibitory effect of Akt1 on CMA (Fig. 2) and the preferential association of TORC2 with lysosomes active for this autophagic pathway (Fig. 3G–I), led us to investigate whether TORC2 was the upstream regulatory kinase for this Akt function. Although selective inhibitors of only TORC1 or TORC2 activities are not currently available, there are differences in the susceptibility of both these complexes to some of the compounds (Benjamin et al., 2011). We found that at low concentrations (250nM) Torin1 had a more discrete inhibitory effect on TORC1 (measured as phosphorylation of S6K) than on TORC2 (measured as Akt phosphorylation and mTOR auto-phosphorylation at Ser2481 (Copp et al., 2009)), and identified concentrations of rapamycin that efficiently block TORC1 activity without a significant effect on TORC2 (Fig. S3D). Treatment with increasing concentrations of Torin1 resulted in a dose-dependent increase in CMA activity (Fig. 4A,B) whereas, rapamycin at concentrations capable to inhibit TORC1 but not TORC2, did not changed CMA activity (Fig. 4B and S3E), supporting that most of the effect of Torin1 on CMA was likely due to TORC2 inhibition. The stimulatory effect of Torin1 on inducible CMA was more discrete than on basal CMA, but still detected (Fig. 4B and S4E). This is consistent with the fact that although TORC2 activity (measured as increase in pAkt levels) decreases during the first hours of starvation, it is partially restored by the times used to measure CMA activity (Fig. S3F). Accordingly, whereas addition of Torin1 for increasing periods of times under serum conditions have an additive stimulatory effect on CMA, the stimulatory effect of Torin1 on CMA in cells maintained in serum-deprived media is all attained in the last 4 hours of starvation, coinciding with the restoration of TORC2 activity (Fig. S3G,H). In contrast, when PHLPP1 inhibitors were added, longer incubation times led to more pronounced inhibition of CMA suggesting that PHLPP1 activity is sustained during the whole starvation period (Fig. S3I). TORC2 reactivation as starvation persists was observed in most primary and non-cancer cells but not in cancer cell lines (Fig. S4A). These findings highlight a possible different regulation of CMA in normal and in cancer cells, where we have previously observed sustained upregulation of CMA under basal conditions and failure to further activate this process under starvation (Kon et al., 2011). Using one of these cancer cell lines transduced with the fluorescent CMA reporter, we confirmed that the stimulatory effect of blockage of TORC2 or Akt1 and the inhibitory effect on CMA of blockage of PHLPP1 were very discrete in these cells compared to control, and both were practically lost with prolonged starvation (Fig. S4B). Overall, these findings point toward the TORC2/Akt1/PHLPP1 axis being mainly involved in CMA regulation under physiological conditions.
Fig. 4. TORC2 activity inhibits CMA.

A. Representative images of mouse fibroblasts stably expressing the KFERQ-PA-mCherry1 reporter and subjected to the indicated treatments. B. Dose-dependence effect on CMA of treatment of cells expressing a KFERQ-PS-Dendra2 CMA reporter with the indicated TOR inhibitors. Quantification by high-content microcopy in n>850 cells. C,D. Representative images (C) and quantification (D) of mouse fibroblasts expressing the KFERQ-PA-mCherry1 CMA reporter control or after rictor knock-down (KD), n>75 cells. E, F. Representative immunoblots (E) and quantification (F) of binding and uptake of the indicated CMA substrate proteins (α-synuclein (α-syn) and tau protein (Tau)) by isolated rat liver lysosomes untreated (−) or pretreated with Torin1 (+) as labeled, n=3. G. Viability of fibroblasts control or knock-down for LAMP-2A (L2A(−)) subjected to increasing concentrations of paraquat (PQ) alone (None) or in the presence of Torin (250nM) or Akt inhibitor (3μM) for 12 hours. n=3. H. Average extracellular acidification rates (ECAR) in control and L2A(−) fibroblasts upon addition of a glucose bolus under the indicated conditions. n=6. All values are mean+s.e.m., and differences are significant for p<0.05. See also Figure S3, S4 and S6.
When we knocked down rictor in cultured cells using lentivirus-mediated shRNA (Fig. S4C) CMA activity increased both in basal conditions and in response to starvation (Fig. 4C,D). As in the case of PHLPP1 and Akt, inhibition of TORC2 activity directly in lysosomes, by incubation of isolated lysosomes with Torin1, was sufficient to modify their CMA activity. Thus, although binding of two well-characterized CMA substrates, alpha synuclein and tau, was comparable in lysosomes treated or not with Torin1, the rates of uptake of these two proteins were significantly higher in Torin1 pre-treated lysosomes (Fig. 4E,F). These results confirm an inhibitory effect of the lysosome-associated TORC2 on CMA.
We next analyzed the effect of modulation of this axis on two physiological functions of CMA: in the cellular response to stress and in the regulation of cellular metabolism. CMA is upregulated in response to stressors such as oxidative stress (Kiffin et al., 2004) or genotoxic stress (Park et al., 2015) and its activation is required to assure cell survival. Treatment of cells with Torin1 or Akt inhibitors (Fig. 4G and S4D) or rictor KD (Fig. S4C) or KO (Fig. S4E) increased cellular resistance to both paraquat-induced oxidative stress, and etoposide- induced genotoxic stress and this protective effect was no longer evident in CMA-incompetent cells (Fig. 4G and S4D). CMA also mediates selective degradation of proteins with regulatory purposes such as glycolytic enzymes degradation to down-regulate glycolytic flux during starvation (Schneider et al., 2014). Measurement of the extracellular acidification in response to glucose, using an extracellular flux analyzer, revealed that Torin1 treatment was sufficient to reduce glycolytic rates in serum-supplemented cells to values comparable to those observed in the serum-depleted group (Fig. 4H). We did not observe significant changes in the glycolytic rates of L2A(−) cells upon Torin1 treatment (Fig. 4H). Overall, these results support the physiological relevance of the modulatory effect of TORC2/Akt1/PHLPP1 signaling on CMA.
Starvation-induced changes in the lysosomal TORC2-Akt-PHLPP1 CMA modulatory complex
To start elucidating the basis for the regulation of CMA by this kinase/phosphatase lysosomal complex, we analyzed possible changes in the components of this complex during CMA activation. Contrary to the decrease in lysosomal mTOR upon extreme nutrient deprivation (isotonic saline solution) (Sancak et al., 2010), physiological starvation did not change levels of mTOR in any of the lysosomal subgroups (Fig. 5A). A reduction in the lysosomal raptor content was noticeable early in starvation, at the time of maximal activation of macroautophagy (Fig. 5A). Starvation did not reduce lysosomal levels of rictor (Fig. 5A) or Akt (Fig. 5B), but markedly increased the association of PHPP1 with the group of lysosomes active for CMA (Fig. S5A) as it did starvation in rats (Fig. 5B; increase with starvation 3.98±0.36 folds). An increase in PHLPP1 in this lysosomal subgroup was also observed during paraquat-induced oxidative stress (Fig. S5B). Because total cellular levels of PHLPP1 did not change in starvation, we propose that PHLPP1 associates dynamically with lysosomes, and that its arrival at the lysosomal membrane inactivates the inhibitory effect of Akt on CMA through its dephosphorylation. In fact, pAkt levels were markedly lower in CMA-active lysosomes isolated from starved animals (Fig. 5C and Fig. S5B).
Fig. 5. Starvation-induced changes in the lysosomal content of CMA regulatory kinases and phosphatases.

A. Immunoblot for the indicated proteins in homogenates (Hom) and lysosomes with high (+) and low (−) CMA activity isolated from livers of rats fed or starved (Stv) for the indicated periods of time. Right: Changes in lysosomal levels of the indicated proteins. n=5. B. Immunoblot in fractions from livers of fed (F) or 48h starved rats (S). Hom: homogenate; Cyt: cytosol; CMA+ and CMA−: lysosomes active or inactive for CMA; L1: LAMP-1. C. Immunoblot for total and phosphorylated Akt in similar fractions as in B. D. Quantification by high-content microscopy (HCM) in mouse fibroblasts expressing the KFERQ-PS-Dendra2 CMA reporter maintained in the presence or absence of serum and treated with Torin1 (300nM) or Akt inhibitor (1μM) in n>800 cells. E. Average number of punta per cell by HCM in the same cells as in D deprived of serum and treated with PHLPPi (20μM) and the indicated concentrations of Torin. F, G. Average number of puncta per cell by HCM in the same cells as in D and treated with PHLPPi (20 μm) and Torin (300mM) (F) or Akt inhibitor (1μM) (G). n>800 cells. All values are mean+s.e.m. and differences are significant for p<0.05. See also Figure S5.
Using combinations of inhibitors of the different CMA regulatory kinases and phosphatases we found that that the stimulatory effect of TORC2 and Akt inhibitors on CMA was not additive, further supporting that the two kinases are components of the same CMA regulatory pathway both under basal or inducible conditions (Fig. 5D). Inhibition of PHLPP1 reduced CMA activity in both conditions but higher concentrations of PHLPP1 inhibitor were required to block CMA upon serum removal, in agreement with the higher arrival of PHLPP1 to lysosomes under these conditions (S5C). The decrease in CMA activity induced by saturating doses of the PHLPP1 inhibitor was gradually less pronounced as concentrations of Torin1 increased (Fig. 5E), and once TORC2 activity was completely inhibited PHLPP1 inhibition did no longer have an effect on CMA, supporting that TORC2 and PHLPP1 act in opposite directions over the same target (Fig. 5F). We confirmed that this target was Akt because once Akt activity was blocked, the PHLPP1 inhibitor was no longer efficient in reducing CMA activity (Fig. 5G).
We next analyzed if besides Akt dephosphorylation, other factors could modulate the activity of lysosomal TORC2-Akt1 during starvation. Immunoblot for different GTPases previously described to modulate TORC (Duran and Hall, 2012) demonstrated that Rac1, Rheb, RagD and RagB were all present in CMA-active and inactive lysosomes although with different abundance (Fig. 6A). Levels of RagD and B were comparable in CMA-active and inactive lysosomes and did not markedly change with starvation (Fig. 6A). In contrast Rheb and the Rho GTPase Rac1 showed higher abundance in CMA-active lysosomes and while the amount of Rheb associated to CMA-active lysosomes decreased gradually with starvation, we found a marked increase in Rac1 levels under these conditions (Fig. 6A). In fact, although cytosolic levels of Rac1 decreased during starvation, this GTPase was up to 60 folds enriched in-CMA active lysosomes under these conditions (Fig. 6B), supporting its active recruitment to this compartment.
Fig. 6. Rac1 modulates CMA through its dynamic association to lysosomes.

A. Immunoblot for the indicated GTPases in homogenates (Hom) and lysosomes with high (+) and low (−) CMA activity isolated from livers of rats fed or starved (Stv) for the indicated periods of time. B. Immunoblot for Rac1 of the cytosolic fractions of livers used in A and enrichment of Rac1 in CMA-active lysosomes (middle) and comparatively in CMA-active and inactive lysosomes (bottom). C. Proteolysis of long-lived proteins in mouse fibroblasts control (Ctr) or Rac1 KD assayed by metabolic labeling in cultured cells. Top: percentage of lysosomal degradation (sensitive to inhibitors of lysosomal proteolysis). Bottom: percentage of macroautophagy-dependent degradation (sensitive to 3-methyladenine), n=6. D. Representative images (left) and quantification of average number of puncta per cell (right) of mouse fibroblasts control or Rac1 KD stably expressing the KFERQ-PA-mCherry1 CMA reporter and maintained in serum free media for 16h, n>75 cells. Nuclear profiles are highlighted with a discontinuous line. E. Immunoblot in homogenates (Hom) and lysosomes active for CMA (+) isolated from Ctr or Rac1 KD cells. F. Immunoblot for mTOR and Rictor of solubilized lysosomes from 48h starved rats subjected to immunoprecipitation (coIP) with a specific antibody against Rac1 or a control IgG. IP for Rac1 is shown at the bottom. G. Quantification by HCM of the average number of puncta per cell in mouse fibroblasts Ctr or Rac1 KD stably expressing KFERQ-PS-Dendra2 and treated or not with saturating concentrations of Torin1. n>800 cells. All values are mean+s.e.m., and differences are significant for p<0.05. See also Figure S6.
Knock-down of Rac1 (Fig. S6A) significantly reduced the degradation of long-lived proteins in lysosomes (sensitive to lysosomal inhibitors) in response to prolonged serum removal, but it did not change the fraction of this degradation mediated by macroautophagy (sensitive to 3-methyladenine) (Fig. 6C). Consistent with a primary effect on CMA, Rac1 KD cells displayed significantly reduced levels of CMA measured with the photoactivable CMA reporter (Fig. 6D).
Although different GTPases mediate lysosomal association of TORC (Sancak et al., 2010), and Rac1 has shown a positive regulatory effect for mTORC2 in some cells (Saci et al., 2011), we found that Rac1 is not required for association of TORC2 components to CMA-active lysosomes, as lysosomal levels of mTOR and rictor were comparable in control and Rac1 KD cells (Fig. 6E). Despite no effect in mTOR levels, depletion of Rac1 resulted in higher levels of Akt phosphorylation (Fig. S6B), which motivated us to analyze its interplay with the Akt phosphatase, PHLPP1. Pulldown experiments from rat liver CMA-active lysosomes demonstrated physical association between Rac1 and PHLPP1 (Fig. 6F). We also found that lysosomal levels of PHLPP1 positively correlate with those of Rac1. Thus, incubation of isolated lysosomes with GTP, which resulted in a dose-dependent release of Rac1, also led to decreased levels of PHLPP1 in lysosomes (Fig. 6G). Conversely, addition of GDP to isolated lysosomes stabilized both lysosomal Rac1 and PHLPP1 (Fig. 6H). Furthermore, isolation of lysosomes from livers of LAMP-2A knock-out mice (Schneider et al., 2014) revealed that although the CMA receptor was not required for lysosomal binding of the mTORC2/PLHPP1/Akt axis components, they had a consistent 40% decrease in Rac1 (Fig. S6C) and PHLPP1 (Fig. S6D) levels.
Overall these findings support that CMA activation is attained and sustained during prolonged starvation through dephosphorylation of lysosomal Akt by PHLPP1 that is actively recruited to the lysosomal membrane and that the stability of PHLPP1 at the lysosomal membrane is positively modulated by Rac1 in a GTP/GDP dependent manner.
Regulation of the CMA translocation complex by lysosomal TORC2-Akt-PHLPP1
We next set to investigate the lysosomal mechanism(s) behind the CMA inhibitory and stimulatory effect of TORC2 and PHLPP1, respectively. Because inhibitors of both enzymes modify substrate uptake but did not affect substrate binding (Fig. 1F and 4E,F), we focused on the CMA translocation step. Internalization begins with the substrate-driven multimerization of LAMP-2A into a translocation complex that can be resolved by blue-native electrophoresis as a 700kDa LAMP-2A-containing complex (Bandyopadhyay et al., 2008). We found that addition of Torin1 to isolated lysosomes was sufficient to induce multimerization of LAMP-2A, even in the absence of substrate proteins and furthermore once substrate (GAPDH) was added to lysosomes (Fig. 7A; low LAMP-2A multimerization and lack of Torin1 effect on lysosomes of low CMA activity is shown as negative control). Torin1 did not modify the multimerization status of LAMP-2B, LAMP1 or lysosomal hsp90, reinforcing the selective nature of its effect on LAMP-2A (Fig. S7A). Inhibition of Akt activity in isolated lysosomes lead to a similar dose-dependent increase in the amount of CMA translocation complex both in the presence or absence of CMA substrates, whereas inhibition of PHLPP1 did not modify the amount of LAMP-2A organized in translocation complex in the absence of the substrates but reduced substrate-driven LAMP-2A multimerization (Fig. 7B).
Fig. 7. The mTORC2/PHLPP1/Akt lysosomal axis regulates the dynamics of the CMA translocation complex.

A. Blue-native electrophoresis (BNE) and immunoblot for LAMP-2A of rat liver lysosomes with high (+) or low (−) CMA activity incubated with Torin1 and/or GAPDH as labeled. Bottom: Percentage of lysosomal LAMP-2A present in the 700kDa multimeric complex, n=3. B. Lysosomes incubated with Akt or PHLPP1 inhibitors and GAPDH processed as in A. C. Co-immunoprecipitation of LAMP-2A with GFAP from rat liver lysosomes untreated (None) or treated with Akt inhibitors. D. Immunoblot of starved rat liver lysosomes incubated with PHLPP1 inhibitor. Right: Ratio of pGFAP/GFAP at the lysosomal membrane. n=6. E. Immunoblot for pGFAP in homogenates (Hom) and lysosome-enriched fractions (Lys) isolated from MEFs from wild type (WT) and Akt1 knock-out (KO) mice. F. Immunoblot for the indicated proteins in immunoprecipitates of GFAP from lysosomes incubated as in C. G. Immunoblot for pGFAP of purified GFAP incubated with Akt affinity purified from rat liver cytosol (Cyt) or lysosomes (Lys) using an antibody against pAkt (Ser473). Cytosol and lysosomes are run as negative control to indicate absence of pGFAP in these fractions. H. BNE and immunoblot for LAMP-2A of lysosomes isolated from cells control (Ctr) and knock-down for GFAP (KD) untransfected (−) or transfected with wild-type (WT) GFAP or GFAP in which the S in the consensus Akt phosphorylation motif has been mutated to A or E (3 clones for S/A, 2 clones for S/E are shown). Expression levels of each transfected protein are shown in Fig. S7E. Bottom: LAMP-2A present in the 700kDa multimeric complex. Values are expressed as folds levels in control cells attributed an arbitrary value of 1. All values are mean+s.e.m., and differences are significant for p<0.05. See also Figure S7.
Assembly and disassembly of the LAMP-2A translocation complex is modulated, at least in part, by binding of GFAP to LAMP-2A to stabilize the CMA translocation complex (Bandyopadhyay et al., 2010). We found that Akt inhibitors increased the amount of LAMP-2A co-immunoprecipitated with GFAP (Fig. 7C). Since the phosphorylation state of GFAP is limiting for LAMP-2A multimerization - phosphorylated GFAP forms a dimer with GFAP and deprives GFAP from LAMP-2A multi-complex resulting in the dissociation of this multi-complex (Bandyopadhyay et al., 2010) - and since GFAP contains a predicted consensus Akt phosphorylation motif (R-X-R-X-X-S8) (Obenauer et al., 2003), we next analyzed whether GFAP could be a direct target of the kinase activity of lysosomal Akt. Levels of pGFAP were markedly increased in lysosomes from LAMP-2A KO mice (Fig. S7D) where we previously noticed an increase in Akt phosphorylation (Fig. S6D). Furthermore, direct activation of lysosomal Akt, by treatment of isolated lysosomes with PHLPP1 inhibitors also increased GFAP phosphorylation (Fig. 7D and S7B; note that treatment did not change membrane levels of PHLPP1). Conversely, phosphorylation of GFAP was markedly reduced in lysosomes isolated from Akt1 KO (Fig. 7E) or upon treatment of isolated lysosomes with Torin1 to reduce Akt activity (Fig. S7C). Akt can be co-immunoprecipitated with GFAP in isolated lysosomes and chemical inhibition of Akt reduced the association between both proteins (Fig. 7F). We next purified activated cytosolic and lysosomal Akt using a pAkt (Ser473) antibody immobilized on Sepharose beads and analyzed their ability to directly phosphorylate GFAP. As shown in Fig. 7G, purified GFAP become phosphorylated upon incubation with not only cytosolic but also lysosomal Akt, supporting the ability of this kinase to directly phosphorylate GFAP.
To confirm that part of the regulatory effect of Akt on CMA was mediated through GFAP phosphorylation, we knocked-down GFAP in fibroblasts (Fig. S7E) and analyzed changes on CMA upon modulation of the mTORC2/Akt axis. Inhibition of TORC2 or Akt in GFAP KD cells did no longer result in increased CMA activity, whereas transfection to restore GFAP levels in KD cells was sufficient to restore the stimulatory effect of the drugs (Fig. S7F). Transfection of GFAP KD cells with mutant GFAP where the S of the predicted consensus Akt phosphorylation motif was replaced by either A (phosphorylation resistant) or E (phosphorylation mimetic) abolished the stimulatory effect of Torin1 or the Akt inhibitor, supporting that phosphorylation on this residue is important for the regulatory role of the mTORC2/PHLPP1/Akt axis on CMA (Fig. S7F). Interestingly, while transfection with wild-type GFAP fully restored LAMP-2A multimerization in GFAP KD cells, expression in these cells of either the phosphorylation resistant or the phospho-mimetic form of GFAP failed to restore their ability to assemble the CMA translocation complex (Fig. 7H). Although we cannot discard that failure to restore CMA could be due to a direct disruption of GFAP function by the mutation, these results are in agreement with previous findings reporting that rapid assembly and disassembly of the CMA translocation complex depends on a fine-tuned balance between levels of pGFAP and GFAP at the lysosomal membrane (Bandyopadhyay et al., 2010). Consequently, the presence in lysosomes of GFAP unable to undergo phosphorylation or unable to be dephosphorylated should both negatively impact the dynamics of the CMA translocation complex.
Overall our results support that activation of Akt by TORC2 increases the ratio of phosphorylated GFAP at the lysosomal membrane and this drives unmodified GFAP away from the multimerized LAMP-2A, with the subsequent destabilization of this translocation complex and reduced CMA activity (see graphical abstract). However, to assure proper assembly/disassembly of the complex, some level of GFAP phosphorylation should be maintained, providing an explanation for the continuous presence of TORC2 and Akt at the lysosomal membrane even under conditions of maximal CMA activation.
Discussion
In this study we have identified PHLPP1 and TORC2 as endogenous CMA stimulator and inhibitor, respectively, and unveiled how their opposite effects on Akt act coordinately in the modulation of basal and inducible CMA activity. The stress-induced increase in the association of the phosphatase with the lysosomal membrane and the modulation of its stability in this compartment by the GTPase, Rac1, contribute to neutralize the endogenous inhibitory effect of lysosomal TORC2/Akt on CMA.
Association of kinases and phosphatases to the cellular compartments where they exert their regulatory activity has been described in other instances. In fact, the well-characterized inhibitory effect of TORC1 on macroautophagy requires association of this kinase complex to lysosomes (Sancak et al., 2010). TORC1 activity on autophagy can be regulated by its Rag-mediated association/dissociation from lysosomes under extreme starvation (Sancak et al., 2010) or by changes in the proximity of lysosomes to the plasma membrane, under physiological starvation (Korolchuk et al., 2011). In the case of CMA, we have found that lysosomal levels of TORC2 remain almost constant and that instead the starvation-induced lysosomal association of the GTPase Rac1 and the Akt phosphatase PHLPP1 are required to modulate CMA inhibition by TORC2. GTP is an attractive signaling molecule for CMA activation because two CMA-related proteins, GFAP (Bandyopadhyay et al., 2010) and now Rac1 (this work) are modulated by this nucleotide. In fact integration of the starvation response with GTP homeostasis has been recently proposed (Kriel et al., 2012).
Macroautophagy and CMA cross-talk (Massey et al., 2006; Kaushik et al., 2008), although the molecular mechanisms that underlie this intercommunication remain unknown. The fact that two of the CMA regulatory molecules described in this work, Akt and mTOR, also modulate macroautophagy makes them attractive candidates for the communication between these two pathways. We have found differences in the distribution of TORC1 (macroautophagy inhibitor) and TORC2 (CMA inhibitor) among different lysosomal subtypes. Future identification of the determinants of this preference for a type of lysosomes could provide targets for the modulation of both autophagic pathways. Besides TORC1, recent studies support that TORC2 activity is required to sustain autophagosome biogenesis (Renna et al., 2013). Interestingly, this stimulatory effect of TORC2 on macroautophagy is mediated through its effect on PKC (Renna et al., 2013), whereas the inhibitory effect of TORC2 on CMA depends on Akt, suggesting that switch in TORC2 substrates may contribute to coordinate the activity of these two types of autophagy. Lastly, an inhibitory effect of Akt kinase activity is shared by both macroautophagy and CMA. Akt-dependent phosphorylation of the macroautophagy effector beclin1 promotes its association with 14-3-3 proteins and vimentin filaments leading to inhibition of autophagosome formation (Wang et al., 2012). Although Akt-dependent phosphorylation of different proteins at the lysosomal membrane could contribute to its inhibitory effect on CMA, our study supports that GFAP could be one of the Akt effectors in this compartment. The fact that some level of phosphorylated GFAP is always required to maintain dynamic assembly and disassembly of the CMA translocation complex, could explain why TORC2/Akt persist at the lysosomal membrane even upon maximal activation of CMA. It is then the arrival of PHLPP1 at the lysosomal membrane the one that changes pGFAP/GFAP ratio and enhances efficiency of substrate uptake. Whether other kinases may contribute to modulate lysosomal phosphorylation of GFAP and to antagonize the stimulatory effect of PHLPP1 on this pathway requires future investigation.
Our study highlights the importance of mTOR/Akt signaling on modulation of CMA activity and on its activation in response to nutritional stress. We propose that this signaling axis could become an attractive target for future therapeutic interventions aimed at enhancing CMA activity in conditions with compromised activity of this autophagic pathway such as aging, neurodegenerative disorders and diabetes.
EXPERIMENTAL PROCEDURES
Animals and cells
Adult male Wistar rats and C57BL/6 mice fed or starved for increasing periods of time were used under an institutional approved animal study protocol. The mouse model with hepatic conditional deletion for LAMP-2A was generated as described (Schneider et al., 2014). Cell lines and mouse embryonic fibroblasts and the shRNA hairpin for the knock-down experiments were as described under Supplemental Experimental Procedures.
Chemicals and plasmids
Sources of reagents and chemicals were as described before (Bandyopadhyay et al., 2010; Kiffin et al., 2004; Massey et al., 2006) and under Supplemental Experimental Procedures. Plasmids for PHLPP1 were from Addgene and for GFAP were from plasmid.med.harvard.edu. Mutagenesis was performed using the Quikchange II Site-directed mutagenesis kit (Agilent Technologies) using the primers described under Supplemental Experimental Procedures.
Isolation of subcellular fractions
Lysosomes were isolated from rat or mouse liver by centrifugation of a light mitochondrial-lysosomal fraction in a discontinuous metrizamide density gradient (Cuervo et al., 1997) or from cultured cells after disruption of the plasma membrane by nitrogen cavitation and sequential centrifugation in percoll/metrizamide discontinuous density gradients (Storrie and Madden, 1990). Preparations with more than 10% broken lysosomes, measured by β-hexosaminidase latency, were discarded. Lysosomal matrices and membranes were isolated after hypotonic shock and centrifugation. Washes of increasing stringency were performed after incubation on ice and subsequent centrifugation. Cytosolic fractions were obtained by centrifugation for 1h at 100,000g of the supernatant obtained after separating the mitochondria-lysosome-enriched fraction.
Measurement of lysosomal activity
Intracellular protein degradation was measured after metabolic labeling of cultured cells with [3H]-leucine (Kaushik and Cuervo, 2009). Macroautophagy activity was estimated by the difference in levels of LC3-II in cells incubated in the presence or absence of lysosomal protease inhibitors (LC3-flux). CMA activity was measured in isolated lysosomes incubated with substrate proteins as described before (Kaushik and Cuervo, 2009) and in Supplementary Experimental Material. CMA activity in intact cells was measured using lentivirus-mediated expression of fluorescent reporters (Koga et al., 2011).
Extracellular flux analysis
Glycolytic capacity under basal conditions or upon injection of 25mM Glucose was estimated by the extracellular acidification rate (ECAR) measured using XF 96-well extracellular flux analyzer (Seahorse Biosciences). Cells (15,000–30,000 cells per well) were seeded in a 96-well plate and kept in serum-depleted media 16h before the experiment. Glycolysis rate was calculated by discounting basal ECAR to the area below the curve upon glucose injection.
General methods
Immunofluorescence was performed on cells grown on coverslips, fixed with a 4% paraformaldehyde solution, blocked, and then incubated with the primary and corresponding fluorescence-conjugated secondary antibodies. Electrophoresis, immunoblot and co-immunoprecipitation procedures were standard following the details described under Supplemental Experimental Procedures. Cell Viability was measured using the CellTiter-Blue kit (Promega) 24h after addition of the different stressors according to manufacturer’s instructions.
Statistical Analysis
All numerical results are reported as mean + s.e.m., and represent data from a minimum of three independent experiments unless otherwise stated. We determined the statistical significance in instances of single comparisons by the two-tailed unpaired Student’s t test of the means with the SigmaPlot software (Jandel Scientific) and in instances of multiple means comparisons by one-way ANOVA followed by the Bonferroni post hoc test.
Supplementary Material
HIGHLIGHTS.
Dynamic association of PHLPP1 with the lysosomal membrane activates CMA
mTORC2 bound to the membrane of CMA-active lysosomes inhibits their activity
The phosphorylation state of lysosomal Akt is regulated by PHLPP1 and mTORC2
The stability of the CMA translocation complex is modulated by lysosomal Akt activity
Acknowledgments
We thank Dr. Susmita Kaushik and Dr. Fernando Macian for experimental advice, data discussion and critical reading of the manuscript. This work was supported by National Institutes of Health grants AG021904, AG031782 and DK098408, a Hirschl/Weill-Caulier Career Scientist Award and the generous support of R&R Belfer (to A.M.C.). E.A. was supported by Micinn/Fulbright Fellowship 2008-0128 and an Ellison Medical Foundation/AFAR Postdoctoral Fellowship.
Footnotes
Author Contributions
EA and HK performed most of the experiments in this study (EA focused on the TORC2 part and HK on the PHLPP), analyzed the data, prepared a draft of the manuscript and revised the final version of the manuscript; AD performed some of the CMA reporter studies using high content microscopy and assisted with cell maintenance, transfection and transduction; EM prepared the different mutant variants of GFAP; BP performed some of the experiments with inhibitors and did immunoblot assays; AMC coordinated the study, designed experiments, analyzed data and contributed to writing and revision of the paper.
Publisher's Disclaimer: This is a PDF file of an unedited manuscript that has been accepted for publication. As a service to our customers we are providing this early version of the manuscript. The manuscript will undergo copyediting, typesetting, and review of the resulting proof before it is published in its final citable form. Please note that during the production process errors may be discovered which could affect the content, and all legal disclaimers that apply to the journal pertain.
References
- Agarraberes F, Terlecky S, Dice J. An intralysosomal hsp70 is required for a selective pathway of lysosomal protein degradation. J Cell Biol. 1997;137:825–834. doi: 10.1083/jcb.137.4.825. [DOI] [PMC free article] [PubMed] [Google Scholar]
- Bandyopadhyay U, Kaushik S, Varticovski L, Cuervo AM. The chaperone-mediated autophagy receptor organizes in dynamic protein complexes at the lysosomal membrane. Mol Cell Biol. 2008;28:5747–5763. doi: 10.1128/MCB.02070-07. [DOI] [PMC free article] [PubMed] [Google Scholar]
- Bandyopadhyay U, Sridhar S, Kaushik S, Kiffin R, Cuervo AM. Identification of regulators of chaperone-mediated autophagy. Mol Cell. 2010;39:535–547. doi: 10.1016/j.molcel.2010.08.004. [DOI] [PMC free article] [PubMed] [Google Scholar]
- Benjamin D, Colombi M, Moroni C, Hall MN. Rapamycin passes the torch: a new generation of mTOR inhibitors. Nature reviews Drug discovery. 2011;10:868–880. doi: 10.1038/nrd3531. [DOI] [PubMed] [Google Scholar]
- Chiang H, Terlecky S, Plant C, Dice JF. A role for a 70-kilodalton heat shock protein in lysosomal degradation of intracellular proteins. Science. 1989;246:382–385. doi: 10.1126/science.2799391. [DOI] [PubMed] [Google Scholar]
- Copp J, Manning G, Hunter T. TORC-specific phosphorylation of mammalian target of rapamycin (mTOR): phospho-Ser2481 is a marker for intact mTOR signaling complex 2. Cancer Res. 2009;69:1821–1827. doi: 10.1158/0008-5472.CAN-08-3014. [DOI] [PMC free article] [PubMed] [Google Scholar]
- Cuervo AM, Dice JF. A receptor for the selective uptake and degradation of proteins by lysosomes. Science. 1996;273:501–503. doi: 10.1126/science.273.5274.501. [DOI] [PubMed] [Google Scholar]
- Cuervo AM, Dice JF, Knecht E. A population of rat liver lysosomes responsible for the selective uptake and degradation of cytosolic proteins. J Biol Chem. 1997;272:5606–5615. doi: 10.1074/jbc.272.9.5606. [DOI] [PubMed] [Google Scholar]
- Cuervo AM, Knecht E, Terlecky SR, Dice JF. Activation of a selective pathway of lysosomal proteolysis in rat liver by prolonged starvation. Am J Physiol. 1995;269:C1200–C1208. doi: 10.1152/ajpcell.1995.269.5.C1200. [DOI] [PubMed] [Google Scholar]
- Duran RV, Hall MN. Regulation of TOR by small GTPases. EMBO Rep. 2012;13:121–128. doi: 10.1038/embor.2011.257. [DOI] [PMC free article] [PubMed] [Google Scholar]
- Gao T, Brognard J, Newton AC. The phosphatase PHLPP controls the cellular levels of protein kinase C. J Biol Chem. 2008;283:6300–6311. doi: 10.1074/jbc.M707319200. [DOI] [PubMed] [Google Scholar]
- Gao T, Furnari F, Newton AC. PHLPP: a phosphatase that directly dephosphorylates Akt, promotes apoptosis, and suppresses tumor growth. Mol Cell. 2005;18:13–24. doi: 10.1016/j.molcel.2005.03.008. [DOI] [PubMed] [Google Scholar]
- Hubbi ME, Hu H, Kshitiz, Ahmed I, Levchenko A, Semenza GL. Chaperone-mediated Autophagy Targets Hypoxia-inducible Factor-1alpha (HIF-1alpha) for Lysosomal Degradation. J Biol Chem. 2013;288:10703–10714. doi: 10.1074/jbc.M112.414771. [DOI] [PMC free article] [PubMed] [Google Scholar]
- Kaushik S, Cuervo AM. Methods to monitor chaperone-mediated autophagy. Methods Enzymol. 2009;452:297–324. doi: 10.1016/S0076-6879(08)03619-7. [DOI] [PMC free article] [PubMed] [Google Scholar]
- Kaushik S, Cuervo AM. Chaperone-mediated autophagy: a unique way to enter the lysosome world. Trends Cell Biol. 2012;22:407–417. doi: 10.1016/j.tcb.2012.05.006. [DOI] [PMC free article] [PubMed] [Google Scholar]
- Kiffin R, Christian C, Knecht E, Cuervo AM. Activation of chaperone-mediated autophagy during oxidative stress. Mol Biol Cell. 2004;15:4829–4840. doi: 10.1091/mbc.E04-06-0477. [DOI] [PMC free article] [PubMed] [Google Scholar]
- Koga H, Martinez-Vicente M, Macian F, Verkhusha VV, Cuervo AM. A photoconvertible fluorescent reporter to track chaperone-mediated autophagy. Nat Commun. 2011;2:386. doi: 10.1038/ncomms1393. [DOI] [PMC free article] [PubMed] [Google Scholar]
- Kon M, Kiffin R, Koga H, Chapochnick J, Macian F, Varticovski L, Cuervo AM. Chaperone-mediated autophagy is required for tumor growth. Science translational medicine. 2011;3:109ra117. doi: 10.1126/scitranslmed.3003182. [DOI] [PMC free article] [PubMed] [Google Scholar]
- Korolchuk VI, Saiki S, Lichtenberg M, Siddiqi FH, Roberts EA, Imarisio S, Jahreiss L, Sarkar S, Futter M, Menzies FM, et al. Lysosomal positioning coordinates cellular nutrient responses. Nat Cell Biol. 2011;13:453–460. doi: 10.1038/ncb2204. [DOI] [PMC free article] [PubMed] [Google Scholar]
- Kriel A, Bittner AN, Kim SH, Liu K, Tehranchi AK, Zou WY, Rendon S, Chen R, Tu BP, Wang JD. Direct regulation of GTP homeostasis by (p)ppGpp: a critical component of viability and stress resistance. Mol Cell. 2012;48:231–241. doi: 10.1016/j.molcel.2012.08.009. [DOI] [PMC free article] [PubMed] [Google Scholar]
- Kroemer G, Marino G, Levine B. Autophagy and the integrated stress response. Mol Cell. 2010;40:280–293. doi: 10.1016/j.molcel.2010.09.023. [DOI] [PMC free article] [PubMed] [Google Scholar]
- Massey AC, Kaushik S, Sovak G, Kiffin R, Cuervo AM. Consequences of the selective blockage of chaperone-mediated autophagy. Proc Nat Acad Sci USA. 2006;103:5905–5910. doi: 10.1073/pnas.0507436103. [DOI] [PMC free article] [PubMed] [Google Scholar]
- Mizushima N, Levine B, Cuervo AM, Klionsky DJ. Autophagy fights disease through cellular self-digestion. Nature. 2008;451:1069–1075. doi: 10.1038/nature06639. [DOI] [PMC free article] [PubMed] [Google Scholar]
- Obenauer JC, Cantley LC, Yaffe MB. Scansite 2.0: Proteome-wide prediction of cell signaling interactions using short sequence motifs. Nucleic acids research. 2003;31:3635–3641. doi: 10.1093/nar/gkg584. [DOI] [PMC free article] [PubMed] [Google Scholar]
- Park C, Suh Y, Cuervo AM. Regulated Degradation of Chk1 by chaperone-mediated autophagy in response to DNA damage. Nat Comm. 2015 Apr 16;6:6823. doi: 10.1038/ncomms7823. [DOI] [PMC free article] [PubMed] [Google Scholar]
- Renna M, Bento CF, Fleming A, Menzies FM, Siddiqi FH, Ravikumar B, Puri C, Garcia-Arencibia M, Sadiq O, Corrochano S, et al. IGF-1 receptor antagonism inhibits autophagy. Hum Mol Genet. 2013;22:4528–4544. doi: 10.1093/hmg/ddt300. [DOI] [PMC free article] [PubMed] [Google Scholar]
- Saci A, Cantley LC, Carpenter CL. Rac1 regulates the activity of mTORC1 and mTORC2 and controls cellular size. Mol Cell. 2011;42:50–61. doi: 10.1016/j.molcel.2011.03.017. [DOI] [PMC free article] [PubMed] [Google Scholar]
- Sancak Y, Bar-Peled L, Zoncu R, Markhard AL, Nada S, Sabatini DM. Ragulator-Rag complex targets mTORC1 to the lysosomal surface and is necessary for its activation by amino acids. Cell. 2010;141:290–303. doi: 10.1016/j.cell.2010.02.024. [DOI] [PMC free article] [PubMed] [Google Scholar]
- Sarbassov D, Guertin DA, Ali SM, Sabatini DM. Phosphorylation and regulation of Akt/PKB by the rictor-mTOR complex. Science. 2005;307:1098–1101. doi: 10.1126/science.1106148. [DOI] [PubMed] [Google Scholar]
- Schneider JL, Suh Y, Cuervo AM. Deficient chaperone-mediated autophagy in liver leads to metabolic dysregulation. Cell Metab. 2014;20:417–432. doi: 10.1016/j.cmet.2014.06.009. [DOI] [PMC free article] [PubMed] [Google Scholar]
- Sierecki E, Sinko W, McCammon JA, Newton AC. Discovery of small molecule inhibitors of the PH domain leucine-rich repeat protein phosphatase (PHLPP) by chemical and virtual screening. Journal of medicinal chemistry. 2010;53:6899–6911. doi: 10.1021/jm100331d. [DOI] [PMC free article] [PubMed] [Google Scholar]
- Storrie B, Madden E. Isolation of subcellular organelles. Meth Enzymol. 1990;182:203–225. doi: 10.1016/0076-6879(90)82018-w. [DOI] [PubMed] [Google Scholar]
- Wang RC, Wei Y, An Z, Zou Z, Xiao G, Bhagat G, White M, Reichelt J, Levine B. Akt-mediated regulation of autophagy and tumorigenesis through Beclin 1 phosphorylation. Science. 2012;338:956–959. doi: 10.1126/science.1225967. [DOI] [PMC free article] [PubMed] [Google Scholar]
Associated Data
This section collects any data citations, data availability statements, or supplementary materials included in this article.