

Abstract
There is intense interest in developing non-invasive prognostic biomarkers of tumor response to therapy, particularly with regard to hypoxia. It has been suggested that oxygen sensitive MRI, notably Blood Oxygen Level Dependent (BOLD) and Tissue Oxygen Level Dependent (TOLD) may provide relevant measurements. This study examined the feasibility of interleaved T2*- and T1-weighted oxygen sensitive MRI, as well as R2* and R1 maps of rat tumors to assess the relative sensitivity to changes in oxygenation.Investigations used cohorts of Dunning Prostate R3327-AT1 and -HI tumors, which are reported to exhibit distinct size-dependent levels of hypoxia and response to hyperoxic gas breathing. Proton MRI R1 and R2* maps were obtained for tumors of anesthetized rats (isoflurane/air) at 4.7 T. Then, interleaved gradient echo T2*- and T1-weighted images were acquired during air breathing and a ten minute challenge with carbogen (95% O2/5% CO2).
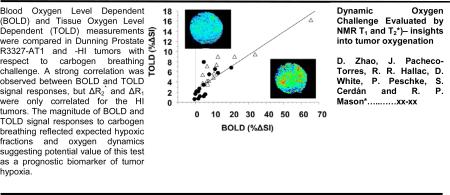
Signals were stable during air breathing and each type of tumor showed distinct signal response to carbogen. T2* (BOLD) response preceded T1 (TOLD) responses, as expected. Smaller HI tumors (reported to be well oxygenated) showed the largest BOLD and TOLD responses. Larger AT1 tumors (reported to be hypoxic and resist modulation by gas breathing) showed the smallest response. There was a strong correlation between BOLD and TOLD signal responses, but ΔR *2 and ΔR1 were only correlated for the HI tumors. The magnitude of BOLD and TOLD signal responses to carbogen breathing reflected expected hypoxic fractions and oxygen dynamics suggesting potential value of this test as a prognostic biomarker of tumor hypoxia.
Keywords: hypoxia, BOLD, TOLD, MRI, oxygen, carbogen, tumor, prostate
Graphical Abstract
INTRODUCTION
Tumor hypoxia is widely reported to influence response to therapy. Moreover, hypoxia has been linked to tumor aggressiveness resulting from stress induced genetic instability, stimulated angiogenesis and metastatic tendency (1). The fundamental studies of Gray et al. demonstrated the influence of hypoxia on response to radiation (2). More recently, polarographic electrode measurements of pO2 distributions and hypoxic fractions in patients confirmed poor outcome for hypoxic tumors in several disease sites including prostate (1, 3).
Stratifying patient tumors based on hypoxia is particularly timely since there are increasing opportunities to tailor therapy to tumor characteristics, potentially enhancing success through personalized medicine. Thus, there is a true need for prognostic biomarkers to identify hypoxia in human tumors and many diverse modalities and reporter molecules are under evaluation (1, 4, 5). Based on oxygen electrode measurements Movsas et al. showed poorer outcome in terms of locoregional control and distant metastasis in men with hypoxic prostate cancer (3). Vergis et al. found that biochemical failure was significantly more prevalent for men with elevated HIF1-α, VEGF and osteopontin expression in biopsy samples (6).
Oxygen sensitive MRI is attractive, since it is non-invasive and avoids the need for an exogenous reporter agent. Increasingly, reports suggest the feasibility of Blood Oxygen Level Dependent (BOLD) and Tissue Oxygen Level Dependent (TOLD) contrast MRI in patients (7-14). BOLD effects have been evaluated in numerous pre-clinical tumor types in animal models and several studies have demonstrated a correlation with measurements of pO2 based on polarographic electrodes (15, 16), fluorescent fiber optic probes (17), ESR (18, 19) and 19F MRI (20, 21). Others have examined consistency with immunohistochemical markers such as hypoxia, and vascular extent (22, 23).
BOLD MRI is sensitive to changes in deoxyhemoglobin concentration, but it is also influenced by vascular volume, flow, microvessel diameter and consequent transit ability of red blood cells containing deoxyhemoglobin to (24-26). R1 (=1/T1) is sensitive to pO2, since molecular oxygen is paramagnetic (27, 28). R1 is subject to modulation by many parameters including ionic strength, metal ions, and potentially deoxyhemoglobin, so that R1 is not expected to be directly correlated with pO2 in tumors. With respect to a simple hyperoxic gas challenge intervention many parameters such as ion and protein concentrations are expected to remain largely unchanged. A predicted TOLD effect was reported using hyperbaric (29) or hyperoxic oxygen breathing challenges (14). Recently, intense interest has developed in combining observations of both R1 and R2* in pre-clinical animal systems and patients (13, 30-33).
These reports prompted us to explore BOLD and TOLD measurements in response to carbogen breathing challenge in two rat prostate tumor types noted for differential growth rates, vascular development, oxygenation and radiation response (34, 35). Specifically, we examined differences in signal intensity in T1- and T2*-weighted images, as well as relaxation rates (R1 and R2*) with respect to carbogen breathing challenge.
EXPERIMENTAL
Investigations were approved by the Institutional Animal Care and Research Advisory Committee.
Tumor models
Two sublines of the Dunning prostate R3327 adenocarcinoma were selected based on extensive previous reports regarding differential hypoxia, response to hyperoxic gas challenge and response to radiation (34-38). The HI subline is moderately well-differentiated, hormone-insensitive and relatively slow growing with a tumor volume doubling time (VDT) of 9 days; while, the AT1 is a faster growing, poorly-differentiated subline with a VDT of 4.4 days (39). Pieces of freshly excised donor tumor tissue were implanted subcutaneously in the thigh of adult male Copenhagen rats (~250 g, Harlan, Indianapolis, IN), as described in detail previously (40). Typical histological characteristics are presented in Figure 1. Tumors were investigated by MRI when small (<3 cm3) or large (>3 cm3). Seventeen HI tumors, including 8 smaller (size range 0.7 – 2.6 cm3) and 9 larger (range 3.6 – 7 cm3), and 16 AT1 tumors, including 9 smaller (range 0.75 – 2.2 cm3) and 7 larger (range 3.1 – 5.8 cm3) were investigated.
Figure 1. Histological characteristics of small Dunning prostate R3327-AT1 and -HI tumors.

Upper row for AT1: A) poorly differentiated anaplastic structure is revealed by H&E; B) widespread hypoxia in both central and peripheral regions observed using pimonidazole (HRP-activated dark stain).
Lower row for HI: C) Moderately differentiated structures with extensive mucinous vacuoles; D) Minimal hypoxia with just non-specific background staining. These images show additional AT1 and HI tumors implanted specifically for histological comparison and do not correspond to any of the imaged animals.
MRI
MRI experiments were performed using a Varian Unity Inova® 4.7 T horizontal bore system (Agilent, Palo Alto, CA) equipped with actively shielded gradients. Each rat was maintained under general gaseous anesthesia (air and 1.5% isoflurane). The rat body temperature was maintained using a warm water blanket at about 36 °C, though not measured continuously. The tumor was placed inside a size-matched single-turn 1H volume coil, which provided both transmit and receive functions. Following shimming on tissue water signal to a typical linewidth of 50 Hz, a spin echo multiple slice (SEMS) sequence was applied to acquire R1 maps under air breathing (baseline) with acquisition parameters: repetition time (TR) arrayed as 9 values from 100 ms to 3.5 s, echo time (TE) = 20 ms, FOV = 40 × 40 mm, matrix = 64 × 64 and 3 adjacent slices each 1.5 mm thick and separated by 1 mm space in 10½ mins. Baseline R2* maps were obtained with a gradient echo multiple slice (GEMS) sequence with 7 echoes (TR = 195 ms, initial TE = 7 ms and spacing = 6 ms, echo train duration = 42 ms, using the same spatial resolution as for R1 maps) in 3 min. Then a series of 5 T1-weighted (TR = 30 ms, TE = 5 ms, flip angle = 45°; acquisition time = 3 s, matrix= 128x128) and T *2-weighted (TR = 150 ms, TE = 20 ms, flip angle = 20°, acquisition time = 19 s, matrix= 128x128) spoiled gradient-echo images were acquired in an interleaved fashion, as baseline. At this point, the breathing gas was changed to carbogen (CB; 95% O2 plus 5% CO2 at 1 dm3/min) and a series of 20 interleaved T1- and T2*-weighted images was acquired over 10 mins. Finally, R1 and R *2 values were measured again during CB inhalation.
Immunohistochemistry
Additional AT1 and HI tumors were implanted as above specifically for histological comparison based on published methods (36, 41). Briefly, when tumors reached about 1 cm diameter pimonidazole hydrochloride (Hypoxyprobe-1; NPI, Belmont, MA) was injected into the tail vein at a dose of 60 mg/kg. Ninety minutes later, rats were anesthetized and perfused for 20 minutes with physiological saline containing 5 mM CaCl2. Tumors were resected from living rats, cut in half, and halves rapidly placed in liquid nitrogen or 10% formalin respectively. Monoclonal antibody Mab1 (NPI) that detects pimonidazole–protein adducts was added to frozen sections (8 μm) followed by incubation for 2 hours at 37 °C. Slides were then incubated for 1 hour at 37 °C with horseradish peroxidase (HRP)–conjugated goat antimouse secondary. After a PBST wash, sections were immersed in 3,3′-diaminobenzidine (DAB) in H2O for 1 minute at room temperature to visualize HRP-enzyme activity. For H&E staining, tumor tissues were fixed in 10% formalin, embedded in paraffin, and sectioned (4 μm).
Data analysis
Data analysis was performed using IDL-based software. Signal Intensity (SI) in the initial five T1- or T2*-weighted images (during air breathing) was averaged to obtain mean baseline images and relative changes in signal intensity with respect to CB challenge were calculated on a voxel by voxel basis. R1 values for a given voxel were obtained by fitting the signal intensities corresponding to 9 delay values to a three-parameter least squares curve, using a Levenberg-Marquardt algorithm. R2* values for a given voxel were obtained by fitting an exponential model of signal decay curve. Common voxels (typically, 1,300 to 2,500 depending on tumor size) were compared under carbogen and air breathing and differences calculated: ΔR1 or 2* = (R1 or 2*CB - R1 or 2*air).
Statistical analysis
Statistical significance of changes in signal intensity in T1- and T2*-weighted images and relaxation rates was assessed using one way analysis of variance (ANOVA) and Fisher's PLSD (Protected Least Significant Difference) or Student's t-tests. Data are presented as mean ± standard error (SE).
RESULTS
Considerable spatial heterogeneity was observed during air breathing (baseline), particularly in T2*-weighted MR images, but signal intensity was generally stable (mean ΔSI in T2*- and T1-weighted images being less than 1%, Figs. 2-5). Increased signal intensity in T2*-weighted images was significant within 30 seconds of switching gases in 12 of 13 HI tumors and 13 of 16 AT1 tumors irrespective of size. Within two minutes signal reached a stable plateau for both smaller (8 of 8) and larger (3 of 5) HI tumors and smaller (6 of 9) AT1 tumors (Figs. 2-4 a-c). Larger AT1 tumors sometimes showed a transient increase with return to baseline after two to six minutes (4 of 7) (Fig. 5c). Response to carbogen was heterogeneous with focal signal changes ranging from plus 100% to minus 40%, but the mean value for each adjacent slice was quite uniform (Figs. 2-5 c). T1-weighted signal response was considerably smaller using these data acquisition parameters (ranging from 20% to minus 5%) and tended to be slower, reaching statistical significance within 1 minute of switching gases in 11 of 13 HI tumors and 12 of 16 AT1s (Figs. 2-5, d-f).
Figure 2. Response of T1- and T2*-weighted image signal intensity to carbogen challenge in a small Dunning prostate R3327-HI tumor (2.1 cm3).

Normalized spin echo planar T2*-weighted cross-sectional images of the tumor acquired while breathing (a) air (baseline), and (b) carbogen (image selected to show maximum change), c) Mean BOLD (normalized signal intensity (SI)) response in three adjacent image slices (○, △,◇) and mean over whole tumor (■). Corresponding normalized T1-weighted gradient echo images of the tumor acquired breathing (d) air and (e) carbogen. f) Mean variations across the tumor of normalized SI change vs. time (TOLD response). Heat scale bar shows % change and linear scale = 5 mm.
Figure 5. Signal response to carbogen challenge in a large R3327-AT1 tumor.

Data correspond to Figure 2, but in a larger AT1 tumor (5.8 cm3). The BOLD and TOLD responses were each considerably smaller than in the other tumors.
Figure 4. Signal response to carbogen challenge in small R3327-AT1 tumor.

Data correspond to Figure 2, but in a small AT1 tumor (0.75 cm3). The BOLD and TOLD responses were each considerably less than in the small HI tumor.
Smaller HI tumors generally showed the largest BOLD response with mean signal increase ranging from 6 to 57% within 1 minute of changing gas and settling on a plateau of 4% to 66% enhancement (mean 21 ∓ 7%, Table 1), as shown for a typical tumor (Fig. 2 a-c). The mean response of three adjacent image slices was highly consistent (Fig. 2c) and comparison of the variation of signal intensity with carbogen challenge showed no significant difference between slices (p>0.7). TOLD response was smaller and initial rapid response was followed by continued increase over 10 minutes reaching 4 to 16 % (e.g., Fig. 2 d-f). Larger HI tumors showed a smaller T2*-weighted response (Fig. 3c), but T1-weighted response (3 to 9%) approached that of the smaller tumors (Figs. 2 & 3 f). Smaller AT1 tumors responded rapidly in both T1- and T2*-weighted images with little further change after 2 minutes. There was marked spatial heterogeneity with greatest response close to the tumor periphery in both T2*- and T1-weighted images (Fig. 4). Larger AT1 tumors showed particularly small BOLD and TOLD response (Fig. 5 c & f).
Table 1.
T2*- (BOLD) and T1- (TOLD) weighted signal response to carbogen challenge in groups of Dunning prostate R3327 tumors
| Tumor | BOLD (%ΔSI) range | TOLD (%ΔSI) range |
|---|---|---|
| Smaller HI (n=8) | 21 ± 7a 4-66% |
8 ± 1 4-16% |
| Smaller AT1 (n=9) | 8 ± 2 0.6-20% |
4.5 ± 0.9 1-8% |
| Larger HI (n=5c) | 7 ± 1 4-13% |
5 ± 1 3-9% |
| Larger AT1 (n=7) | 1.8 ± 0.8 −0.6-5.6% |
1.9 ± 0.3b 0.7-2.7% |
p<0.05 versus smaller and larger AT1
versus smaller AT1 and small or large HI
BOLD and TOLD data available for 5 of 9 large HI tumors.
Figure 3. Signal response to carbogen challenge in a large Dunning prostate R3327-HI tumor.

Data correspond to Figure 2, but for a larger HI tumor (5.7 cm3). The BOLD response was significant, but considerably less than in the smaller HI tumor, whereas TOLD response was quite similar to smaller tumors.
Each tumor type showed consistent responses and mean time courses are presented for both BOLD and TOLD experiments (Fig. 6 a, b) and summarized in Table 1. Noting the initial rapid dynamic response leading to stable plateau, the data in Table 1 show the mean values for ΔSI considering only the last ten measurements during carbogen breathing. Mean changes in SI in T1- and T2*-weighted images of small HI tumors (reported to be well oxygenated (34, 37, 42, 43)) were significantly greater than in small or large AT1 tumors (p<0.05). The T1-weighted image response was also significantly different between larger HI and larger AT1 tumors (Table 1).
Figure 6. Comparison of BOLD and TOLD response in groups of Dunning prostate tumors.


a. Dynamic normalized T2*-weighted signal response to carbogen challenge in the four different groups of tumors. ▲ (smaller HI; n= 8), ◆ (smaller AT1; n= 9), □ (larger HI; n= 5), ○ (larger AT1; n= 7), showing mean ± SEM.
b. Corresponding T1-weighted signal responses.
T2*- and T1-weighted signal responses were well matched with a general trend of larger TOLD response being associated with larger BOLD response (Fig. 7). Considering the 29 tumors, where T2*- and T1-weighted signal responses were evaluated, the linear correlation coefficient R2>0.75 (p<0.0001), which strengthened considerably for HI tumors alone (R2>0.85; p<0.0001), although it was weaker for AT1 alone (R2>0.53; p<0.002). One tumor showed particularly high values for both BOLD and TOLD responses and might be considered an outlier. If this point is neglected then the correlation for the remaining 28 tumors becomes R2>0.61 (p<0.0001) and for HI alone becomes R2>0.59 (p<0.005).
Figure 7. Correlation of TOLD and BOLD response to carbogen challenge.

Signal enhancement showed a distinct linear correlation for all tumors (n=29) from this study (red and blue symbols; R2>0.75; p<0.0001). HI tumors (open red triangles) alone showed even stronger correlation (R2>0.85; p<0.0001). AT1 tumors from this study (blue circles) showed a somewhat weaker correlation (R2>0.54; p<0.005).
To investigate the origin of the changes in SI, R1 and R2* maps were evaluated for 27 of the tumors during air and carbogen breathing (e.g., Fig. 8) and mean values are presented in Table 2. R2* ranged from 28 to 108 s-1 and changed significantly for many individual tumors, though the change was not statistically significant for any of the groups of tumors (Table 2). There was an inverse correlation between ΔSI and ΔR2* irrespective of tumor type and size (R2>0.48; p<0.0002), which improved to R2>0.55 (p<0.002) for AT1 tumors alone. A very similar result was observed if percentage change in R2* was considered in place of absolute ΔR2*. Not surprisingly, R1 and R2* values measured during carbogen breathing were very tightly correlated with respective baseline air breathing values, since the changes were relatively small (e.g., R2*(AT1) R2>0.98; R1(AT1) R2>0.938; R2* (HI) R2>0.79; R1(HI) R2>0.8; all p<0.001; Fig. 8). Mean R1 and R2* values were significantly different between larger HI tumors and other groups, as shown in Table 2, but none of the other groups differed significantly. Baseline R ranged from 0.389 to 0.711 s-1 (Table 2). If all AT1 and HI tumors are considered together then no apparent correlation was found between T1-weighted signal and ΔR1 (R2<0.05). Likewise for AT1 or HI tumors alone, however, if small HI tumors are considered in isolation then a strong correlation was found between T1-weighted signal and ΔR1 based on absolute change in R1 (R2>0.58) or percent change in R1 (R2>0.62). A strong correlation was observed for mean ΔR1 vs. ΔR2* in HI tumors (R2>0.67; p<0.001), but AT1 tumors showed no obvious trend (R2<0.25; Fig. 9). No significant correlations were found for either tumor type on a voxelby-voxel basis (see examples in Supplementary Data Fig. S1). Heterogeneity of baseline R1 and R2* distributions, as well as response to carbogen breathing is seen in the maps (Fig. 8) and emphasized by histograms of individual voxels (Supplementary Materials, Fig. S2).
Figure 8. Influence of carbogen challenge on R1 and R2*.

Groups of AT1 (●) and HI (△) tumors are shown separately with respect to carbogen gas breathing challenge. a) a strong correlation was observed between baseline R and that measured during carbogen breathing with R2 = 0.802 (HI) and R2 = 0.936 (AT1). b) R1 map for a slice through a small HI tumor, revealing baseline spatial heterogeneity. c) corresponding R1 map with CB breathing; d) difference map showing response to CB challenge; e) baseline R1 map for large AT1 tumor; f) corresponding R1 map with CB; g) difference map showing small response in large AT1 tumor. Corresponding R2* data with tumors matching those in a-g; h) Correlations were quite similar for R2* (R2 = 0.798 (HI); R2 = 0.981 (AT1)), as expected since the changes in each relaxation rate was relatively small. i) baseline R2* small HI; j) R2* (CB) small HI; k) R2* difference small HI; l) baseline R2* big AT1; m) R2* CB big AT1; n) △R2* big AT1.
Table 2.
Mean relaxation rates, R1 and R2*, in groups of tumors with respect to carbogen breathing challenge
| Tumor (n) | R2* air (s−1) | R2* CB (s−1) | ΔR2* (s−1) | R1 air (s−1) | R1 CB (s−1) | ΔR1 (s−1) |
|---|---|---|---|---|---|---|
| HI (smaller) (5) | 66 ± 6d 72.5 (45-82) |
65 ± 8d 71.8 (42-85) |
−1.0 | 0.45 ± 0.02 0.442 (0.389-0.514) |
0.46 ± 0.02d 0.430 (0.413-0.512) |
0.007 |
| HI (larger) (8) | 44 ± 4 41.3 (34-72) |
37 ± 2 35.5 (34-48) |
−5.5 | 0.51 ± 0.01 0.515 (0.472-0.563) |
0.54 ± 0.01 0.544 (0.464-0.605) |
0.033 |
| AT1 (smaller) (8) | 64 ± 8d 64.6 (28-108) |
64 ± 8d 61.0 (27-110) |
−0.1 | 0.52 ± 0.04 0.468 (0.440-0.711) |
0.51 ± 0.03 0.469 (0.412-0.671) |
−0.007d |
| AT1* (larger) (6) | 58 ± 5 59.9 (44-69) |
59 ± 4d 61.0 (44-70) |
1.6d | 0.46 ± 0.02 0.428 (0.413-0.528) |
0.46 ± 0.03 0.426 (0.415-0.539) |
0.000d |
(ΔR = RCB – Rair); data presented as mean ± se, followed by median and range in parentheses; (n) represents number of tumors with R1 and R2* data available
p<0.05 vs. larger HI tumors (Fisher's PLSD using ANOVA).
Figure 9. Correlation of quantitative TOLD and BOLD response to carbogen challenge.

Comparison of AT1 (●) and HI (△) tumors showed distinct trends for the group of 29 tumors. Mean change in R1 was closely reflective of R2* for HI tumors (linear fit shown, R2>0.67), but there was no obvious relationship for the AT1 tumors.
DISCUSSION
As expected, BOLD and TOLD contrast responses to breathing hyperoxic gas were quite different for the tumor sublines and sizes. Smaller HI tumors, reported to be well oxygenated and highly responsive to hyperoxic gas challenge (34, 37, 42, 43), showed the largest signal changes, whereas large AT1 tumors, reported to be hypoxic and unresponsive (33, 35, 36, 43), showed the smallest responses. Each tumor showed considerable heterogeneity within an image slice, but quite similar response between slices and overall consistency between multiple tumors of a given group.
BOLD signal responses were larger than TOLD using the current acquisition parameters, but there was a strong correlation between the magnitude of each (Fig. 7). This is reasonable since BOLD is thought to represent conversion of deoxyhemoglobin to oxyhemoglobin and additional delivery of oxygen is expected to increase pO2. There was a general inverse trend between magnitude of BOLD signal response and change in R2*, but the correlation was weak. This suggests influences beyond deoxyhemoglobin concentration affected the signal intensity, which has been reported to be subject to changes in blood flow and vascular volume (24). Indeed, carbogen breathing has been reported to increase both oxyhemoglobin and total hemoglobin, as observed using near infrared spectroscopy of small HI tumors (44).
Noting that BOLD response was generally greater than TOLD response, prompts the question as to the advantage of measuring both parameters. BOLD is expected to primarily reflect vascular oxygenation, but has been reported to exhibit contradictory behavior with respect to tumor oxygenation in some cases (24, 45). Noting that TOLD responses followed BOLD (Figs. 2-6) adds confidence to the oxygen dependence, since enhanced oxygen delivery generates elevated pO2. In HI tumors a strong correlation was found between ΔR1 and ΔR2* (Fig. 9) consistent with change in vascular oxygenation generating change in tumor pO2. Thus, in HI tumors TOLD may add little information regarding hypoxia and response to intervention, beyond emphasizing the BOLD response. Meanwhile, in the AT1 tumors semi quantitative BOLD and TOLD signal responses appear correlated (Fig. 7), whereas quantitative R1 and R2* showed distinct lack of correlation (Fig. 9). These results suggest that R1 and R2* may be sensitive to different biological processes emphasizing the importance of measuring both parameters and ultimately determining which may be most relevant as a prognostic biomarker for a given intervention or tumor type, as also emphasized by others (13, 32).
BOLD showed significant differences between the most responsive tumors (small HI) and small or large AT1 tumors (Table 1). By comparison TOLD showed a significant difference between the responses of larger AT1 tumors versus all the other groups. The large BOLD and TOLD responses in the HI tumors, as compared with AT1 tumors were expected, since the HI tumors are reported to be better vascularized and less hypoxic (34-36, 42, 43), as also seen in Fig. 1.
Significantly, we recently found that for a cohort of AT1 tumors, a TOLD response could be used to stratify tumors, whereby those showing a larger positive response to oxygen breathing challenge prior to single high dose radiation showed a significantly longer tumor growth delay when irradiated while breathing oxygen (33). This was not the case for BOLD response. Predictive correlation of TOLD, but not BOLD was also reported by Arias et al. in orthotopic C6 rat glioma with respect to single high dose radiation (46). By contrast, it has been reported that G3H prolactinomas showed a strong BOLD response to carbogen challenge, which coincided with improved tumor growth delay, while RIF-1 fibrosarcomas showed minimal response (32, 47). Baker et al. recently confirmed that large ΔR2* response in a group of G3H tumors coincided with significant reduction in hypoxia assessed using immunohistochemical markers CCI-103F and pimonidazole in a pulse chase fashion (23). For individual G3H tumors the ΔR2*response was quite variable, in that a large BOLD response could be associated with large or minimal change in hypoxic fraction (23); perhaps indicating that some tumors were already well oxygenated, as we believe to be the case of small HI tumors here. We previously reported that larger BOLD response coincided with elimination of hypoxic fraction in 13762NF rat breast tumors accompanying oxygen breathing (20), though we have not yet tested the radiation responsiveness in those tumors. Anecdotally, it would appear that BOLD response is relevant in well vascularized tumors (HI, GH3 and 13762NF), whereas less so in poorly vascularized tumors (RIF-1 and AT1). It will be important to evaluate the relevance of BOLD and TOLD to irradiation of HI tumors in due course.
The T2*-weighted signal response was very similar to that reported previously for AT1 tumors (48) and baseline R2* values fell within the range reported for diverse tumors types at 4.7 T (7, 20, 22, 47, 49). Human prostate tumors xenografts (DU145 and PC3) in mice were reported to have R2* values and signal responses at 4.7 T similar to the R3327-AT1 and HI tumors found here (7). When tumors show a substantial BOLD response to hyperoxic gas breathing it is normally maintained until gas is returned to air (15, 17, 48). However, a transient response was reported in PC3 tumors (7), as seen for the larger AT1 tumors here (Fig. 5c). R1 values were in the range reported for many other tumor types at 4.7 T (50), though much lower than those reported for SCC tumors in a study of hyperoxic and hyperbaric gas intervention (29).
Semi-quantitative approaches based on change in signal intensity alone provide simple rapid indication of response to intervention (Figs. 2-7), but we recognize that the magnitude of response depends on R1 and R2*, together with TE and TR times. Moreover, tumor motion sometimes precludes effective signal subtraction. Immobilizing tumors in small animals is reasonably straightforward, but in patients, respiratory or cardiac motion, or other movements such as swallowing, bladder filling and bowel peristalsis, may preclude effective signal subtraction (11). Quantitative R1 and R2* measurements are slower, but even if image co-registration isn't perfect, histograms for R1 and R2* distributions may be compared with respect to interventions. One might expect T1-weighted signal response to be closely related to change in R1, however this was only observed for the group of small HI tumors here. Various factors could be responsible for the lack of correlation; in particular the use of a spin echo acquisition protocol (SEMS) for R1 mapping, as opposed to the SPGRE sequence for T1 weighted imaging. The SEMS approach would be too slow for practical assessment of transient dynamics, whereas GRE provides faster time resolution. However, the two approaches are expected to experience differential sensitivity to flow effects (51). The spin echo approach using TE = 20 ms might also be biased by short T2 water protons (e.g., those near deoxygenated blood vessels that produce large magnetic field gradients).
Given that R1 is directly dependent on pO2 in solution, it has been suggested that changes in R1 could directly indicate changes in tissue pO2. Indeed in the vitreous human of the eye, a well-defined medium, Berkowitz et al. achieved measurements consistent with invasive electrodes (27). When we applied the calibration curve of Matsumoto et al. (29) to the current ΔR1 responses, we found general trends consistent with published 19F oximetry, but also substantial discrepancies, potentially due to flow effects or temperature drift. We have recently introduced a further refinement providing quantitative oximetry based on R1, R2 and IVIM during air breathing (so-called MOXI) (52). However, such measurements currently require 14 minutes and make assumptions regarding oxygen hemoglobin binding and the relative amounts of oxygen carried by hemoglobin versus that dissolved in plasma, which may not be appropriate for hyperoxic gas breathing situations.
Another issue potentially confounding the use of water relaxation measurements for assessment of tumor oxygenation is the sensitivity to temperature. Sensitivity of R1 to temperature has been reported at many magnetic fields ranging from 0.2 to 11.7 T with a general trend of decreased sensitivity at higher field (53-55). We found no data relating R1 to temperature of aqueous solutions at 4.7 T and have undertaken a preliminary examination of an aqueous solution of Gadavist contrast agent (12.5 μM to approximately match R1 observed for tumor). We determined a sensitivity of approximately 3% change in R1 per degree Celsius (unpublished data). This emphasizes the importance of maintaining stable temperature during examinations of oxygen sensitive MRI, since we observed mean ΔR1 in the range 1.4 to 7% (Table 2), though individual tumors showed responses as large as 16% (Fig. 9). We would expect temperature variation to appear as drift rather than the acute transition seen upon oxygen challenge (Figs. 2-5), and thus the observed changes should not be overly influenced by any temperature variations. However, changes in R1 represent differences in maps achieved during baseline air breathing and at the end of the CB breathing period, so that temperature instability could be more significant. This should serve as a caveat for interpreting R1 responses and may contribute to lack of correlation between %ΔSI and ΔR1 in some cases.
One might expect oxygen breathing to uniformly enhance tumor oxygenation, and generate increased R1 (induced by higher oxygen concentrations) and reduced R2* (induced by conversion of deoxygenation to oxyhemoglobin). In some cases we observed decreased R1 accompanying CB breathing; notably, 6 of 13 AT1 and 2 of 13 HI tumors. Regional decrease in R1 is noticeable in Figure 8 d and g. Negative response was extensively characterized in the recent work of Linnik et al. (14), who provided evidence that decreased R1 in OE-MRI (TOLD) was spatially associated with poor perfusion (based on DCE MRI) and hypoxia (based on pimonidazole detected histologically post mortem). This is certainly consistent with the greater hypoxia often observed in AT1 tumors as compared with HI, as reported extensively (4, 33-37, 42, 43) and indicated by Figure 1.
Any new technique should be placed in the context of competing techniques (4). Many diverse approaches are available to measure pO2 directly including invasive polarographic electrodes and fluorescent tipped fiber optic probes (15-17). Analogous measurements have been achieved using reporter molecules such as hexafluorobenzene, with 19F MRI (56-58), hexamethyldisiloxane with 1H MRI (59) or crystals of lithium phthalocyanine using ESR (18), based on direct injection into tissue followed by non-invasive measurement of dynamic response to interventions. Appropriate ESR and MRI reporters may be delivered systemically avoiding potential tissue damage, but potentially biasing measurements towards better perfused regions (19, 60). Hypoxia itself is widely interrogated with 18F-labeled nitroimidazoles such as EF5, FAZA and F-misonidazole, but such studies involve the cost and logistic complications of handling radionuclides (61, 62). There remains debate over the optimal methodology in terms of static versus dynamic measurements and preferred timing of measurements and such reporters may not reach ischemic tissues, such as those induced by vascular disrupting agents (63). Insights into tumor oxygenation avoiding the need for reporter molecules appear particularly attractive. Near infrared spectroscopy has been used to evaluate oxy/deoxy hemoglobin ratio, though many studies have lacked spatial resolution (64, 65). In this respect photoacoustic tomography has advantages (66), although depth of signal penetration is usually limited to about 3 cm. A recent report suggests that MRI R1 of lipids offers greater sensitivity to changes in pO2, compared with water (67). We do note that the current study could have been strengthened if histological validation were available for each tumor, as presented by Robinson et al. (26) in prolactinomas and recently by Linnik et al. (14) for glioma on air breathing mice or Baker et al. (23), revealing changes in hypoxia based on pulse chase delivery of two immunohistological markers of hypoxia.
Studies comparing BOLD and TOLD in tumors have been presented in patients (glioma (13)), rabbits (VX2 (30)) and xenografts in mice (G3H and PC3 (32)). We are only aware of two previous studies in rats: Arias et al. (46) in glioma and our own work on AT1 tumors (33). The very different behaviors of the two syngeneic rat tumor types (AT1 and HI), consistent with reported oximetry is potentially important and coincides with the recent study of G3H and PC3 xenografts in mice (32). Importantly, oxygen sensitive MRI is non invasive, simple to implement, highly reproducible and reveals spatial and temporal heterogeneity of oxygen dynamics. It does not quantify pO2 or hypoxic fraction (potential advantages of 19F oximetry, ESR, or electrodes (1)), but requires no needle insertion or exogenous reporter molecule beyond breathing hyperoxic. We believe evaluation of an oxygen challenge by NMR T1 and T2* provides a non-invasive method to distinguish between responsive and non-responsive tumors to hyperoxic gas challenge, potentially allowing hypoxic tumor identification and therapy to be tailored to these characteristics.
Supplementary Material
ACKNOWLEDGMENTS
This research was supported in part by grants from the NIH NCI R01 CA139043 and DOD CDMRP W81XWH-06-1-0149 and the infrastructure provided by the Southwestern Small Animal Imaging Research Program (SWSAIRP) supported in part by 1U24 CA126608 and Simmons Cancer Center (P30 CA142543), as well as the Advanced Imaging Research Center (P41RR02584; EB015908). JPT thanks the Community of Madrid for a fellowship. We are grateful to Jennifer McAnally, Jennifer Magnusson and Angelina Contero for technical assistance and Drs. Eric Hahn and Zhongwei Zhang for valuable discussions.
Abbreviations
- BOLD
blood oxygen level dependent contrast
- TOLD
tissue oxygen level dependent contrast
- HF
hypoxic fraction
- SI
signal intensity
- VDT
volume doubling time
- SEMS
spin echo multiple slice
- GEMS
gradient echo multiple slice
- TR
repetition time
- TE
echo time
- FOV
field of view
- CB
carbogen
- ESR
electron spin resonance
References
- 1.Tatum JL, Kelloff GJ, Gillies RJ, Arbeit JM, Brown JM, Chao KSC, Chapman JD, Eckelman WC, Fyles AW, Giaccia AJ, Hill RP, Koch CJ, Krishna MC, Krohn KA, Lewis JS, Mason RP, Melillo G, Padhani AR, Powis G, Rajendran JG, Reba R, Robinson SP, Semenza GL, Swartz HM, Vaupel P, Yang D, Croft B, Hoffman J, Liu GY, Stone H, Sullivan D. Hypoxia: Importance in tumor biology, noninvasive measurement by imaging, and value of its measurement in the management of cancer therapy. Int. J. Radiat. Biol. 2006;82:699–757. doi: 10.1080/09553000601002324. [DOI] [PubMed] [Google Scholar]
- 2.Gray L, Conger A, Ebert M, Hornsey S, Scott O. The concentration of oxygen dissolved in tissues at time of irradiation as a factor in radiotherapy. Br. J. Radiol. 1953;26:638–648. doi: 10.1259/0007-1285-26-312-638. [DOI] [PubMed] [Google Scholar]
- 3.Turaka A, Buyyounouski MK, Hanlon AL, Horwitz EM, Greenberg RE, Movsas B. Hypoxic Prostate/Muscle PO2 Ratio Predicts for Outcome in Patients With Localized Prostate Cancer: Long-Term Results. Int. J. Radiat. Oncol. Biol. Phys. 2012;82:E433–E439. doi: 10.1016/j.ijrobp.2011.05.037. [DOI] [PubMed] [Google Scholar]
- 4.Mason RP, Zhao D, Pacheco-Torres J, Cui W, Kodibagkar VD, Gulaka PK, Hao G, Thorpe P, Hahn EW, Peschke P. Multimodality imaging of hypoxia in preclinical settings. QJ Nucl. Med. Mol. Imaging. 2010;54:259–280. [PMC free article] [PubMed] [Google Scholar]
- 5.Pacheco-Torres J, López-Larrubia P, Ballesteros P, Cerdán S. Imaging tumor hypoxia by magnetic resonance methods. NMR Biomed. 2011;24:1–16. doi: 10.1002/nbm.1558. [DOI] [PubMed] [Google Scholar]
- 6.Vergis R, Corbishley CM, Norman AR, Bartlett J, Jhavar S, Borre M, Heeboll S, Horwich A, Huddart R, Khoo V, Eeles R, Cooper C, Sydes M, Dearnaley D, Parker C. Intrinsic markers of tumour hypoxia and angiogenesis in localised prostate cancer and outcome of radical treatment: a retrospective analysis of two randomised radiotherapy trials and one surgical cohort study. Lancet Oncology. 2008;9:342–351. doi: 10.1016/S1470-2045(08)70076-7. [DOI] [PubMed] [Google Scholar]
- 7.Alonzi R, Padhani AR, Maxwell RJ, Taylor NJ, Stirling JJ, Wilson JI, d'Arcy JA, Collins DJ, Saunders MI, Hoskin PJ. Carbogen breathing increases prostate cancer oxygenation: a translational MRI study in murine xenografts and humans. Br J Cancer. 2009;100:644–648. doi: 10.1038/sj.bjc.6604903. [DOI] [PMC free article] [PubMed] [Google Scholar]
- 8.Chopra S, Foltz WD, Milosevic MF, Toi A, Bristow RG, Menard C, Haider MA. Comparing oxygen-sensitive MRI (BOLD R2*) with oxygen electrode measurements: A pilot study in men with prostate cancer. Int. J. Radiat. Biol. 2009;85:805–813. doi: 10.1080/09553000903043059. [DOI] [PubMed] [Google Scholar]
- 9.Rijpkema M, Kaanders JH, Joosten FB, van der Kogel AJ, Heerschap A. Effects of breathing a hyperoxic hypercapnic gas mixture on blood oxygenation and vascularity of head-and-neck tumors as measured by magnetic resonance imaging. Int. J. Radiat. Oncol. Biol. Phys. 2002;53:1185–1191. doi: 10.1016/s0360-3016(02)02825-0. [DOI] [PubMed] [Google Scholar]
- 10.O'Connor JPB, Naish JH, Parker GJM, Waterton JC, Watson Y, Jayson GC, Buonaccorsi GA, Cheung S, Buckley DL, McGrath DM, West CML, Davidson SE, Roberts C, Mills SJ, Mitchell CL, Hope L, Ton C, Jackson A. Preliminary Study of Oxygen-Enhanced Longitudinal Relaxation in MRI: a Potential Novel Biomarker of Oxygenation Changes in Solid Tumors. Int. J. Radiat. Oncol. Biol. Phys. 2009;75:1209–1215. doi: 10.1016/j.ijrobp.2008.12.040. [DOI] [PubMed] [Google Scholar]
- 11.Hallac RR, Ding Y, Yuan Q, McColl RW, Lea J, Sims RD, Weatherall PT, Mason RP. Oxygenation in cervical cancer and normal uterine cervix assessed using blood oxygenation level-dependent (BOLD) MRI at 3T. NMR Biomed. 2012;25:1321–1330. doi: 10.1002/nbm.2804. [DOI] [PMC free article] [PubMed] [Google Scholar]
- 12.Jiang L, Weatherall PT, McColl RW, Tripathy D, Mason RP. Blood oxygenation level-dependent (BOLD) contrast magnetic resonance imaging (MRI) for prediction of breast cancer chemotherapy response: A pilot study. J. Magn. Reson. Imaging. 2013;37:1083–1092. doi: 10.1002/jmri.23891. [DOI] [PubMed] [Google Scholar]
- 13.Remmele S, Sprinkart AM, Muller A, Traber F, von Lehe M, Gieseke J, Flacke S, Willinek WA, Schild HH, Senegas J, Keupp J, Murtz P. Dynamic and simultaneous MR measurement of R1 and R2*changes during respiratory challenges for the assessment of blood and tissue oxygenation. Magn. Reson. Med. 2013;70:136–146. doi: 10.1002/mrm.24458. [DOI] [PubMed] [Google Scholar]
- 14.Linnik IV, Scott MLJ, Holliday KF, Woodhouse N, Waterton JC, O'Connor JPB, Barjat H, Liess C, Ulloa J, Young H, Dive C, Hodgkinson CL, Ward T, Roberts D, Mills SJ, Thompson G, Buonaccorsi GA, Cheung S, Jackson A, Naish JH, Parker GJM. Noninvasive tumor hypoxia measurement using magnetic resonance imaging in murine U87 glioma xenografts and in patients with glioblastoma. Magn. Reson. Med. 2014;71:1854–1862. doi: 10.1002/mrm.24826. [DOI] [PubMed] [Google Scholar]
- 15.Robinson SP, Collingridge DR, Howe FA, Rodrigues LM, Chaplin DJ, Griffiths JR. Tumor response to hypercapnia and hyperoxia monitored by FLOOD magnetic resonance imaging. NMR Biomed. 1999;12:98–106. doi: 10.1002/(sici)1099-1492(199904)12:2<98::aid-nbm556>3.0.co;2-i. [DOI] [PubMed] [Google Scholar]
- 16.Al-Hallaq HA, River JN, Zamora M, Oikawa H, Karczmar GS. Correlation of magnetic resonance and oxygen microelectrode measurements of carbogen-induced changes in tumor oxygenation. Int. J. Radiat. Oncol. Biol. Phys. 1998;41:151–159. doi: 10.1016/s0360-3016(98)00038-8. [DOI] [PubMed] [Google Scholar]
- 17.Baudelet C, Gallez B. How does blood oxygen level-dependent (BOLD) contrast correlate with oxygen partial pressure (pO2) inside tumors? Magn. Reson. Med. 2002;48:980–986. doi: 10.1002/mrm.10318. [DOI] [PubMed] [Google Scholar]
- 18.Dunn JF, O'Hara JA, Zaim-Wadghiri Y, Lei H, Meyerand ME, Grinberg OY, Hou H, Hoopes PJ, Demidenko E, Swartz HM. Changes in oxygenation of intracranial tumors with carbogen: a BOLD MRI and EPR oximetry study. J. Magn. Reson. Imaging. 2002;16:511–521. doi: 10.1002/jmri.10192. [DOI] [PubMed] [Google Scholar]
- 19.Elas M, Williams BB, Parasca A, Mailer C, Pelizzari CA, Lewis MA, River JN, Karczmar GS, Barth ED, Halpern HJ. Quantitative tumor oxymetric images from 4D electron paramagnetic resonance imaging (EPRI): Methodology and comparison with blood oxygen level-dependent (BOLD) MRI. Magn. Reson. Med. 2003;49:682–691. doi: 10.1002/mrm.10408. [DOI] [PubMed] [Google Scholar]
- 20.Zhao D, Jiang L, Hahn EW, Mason RP. Comparison of 1H blood oxygen level-dependent (BOLD) and 19F MRI to investigate tumor oxygenation. Magn. Reson. Med. 2009;62:357–364. doi: 10.1002/mrm.22020. [DOI] [PMC free article] [PubMed] [Google Scholar]
- 21.Fan XB, River JN, Zamora M, Al-Hallaq HA, Karczmar GS. Effect of carbogen on tumor oxygenation: Combined fluorine-19 and proton MRI measurements. Int. J. Radiat. Oncol. Biol. Phys. 2002;54:1202–1209. doi: 10.1016/s0360-3016(02)03035-3. [DOI] [PubMed] [Google Scholar]
- 22.Robinson SP, Rijken PF, Howe FA, McSheehy PM, van der Sanden BP, Heerschap A, Stubbs M, Van Der Kogel AJ, Griffiths JR. Tumor vascular architecture and function evaluated by non-invasive susceptibility MRI methods and immunohistochemistry. J. Magn. Reson. Imaging. 2003;17:445–454. doi: 10.1002/jmri.10274. [DOI] [PubMed] [Google Scholar]
- 23.Baker LCJ, Boult JKR, Jamin Y, Gilmour LD, Walker-Samuel S, Burrell JS, Ashcroft M, Howe FA, Griffiths JR, Raleigh JA, van der Kogel AJ, Robinson SP. Evaluation and Immunohistochemical Qualification of Carbogen-Induced R2* as a Noninvasive Imaging Biomarker of Improved Tumor Oxygenation. Int. J. Radiat. Oncol. Biol. Phys. 2013;87:160–167. doi: 10.1016/j.ijrobp.2013.04.051. [DOI] [PubMed] [Google Scholar]
- 24.Howe FA, Robinson SP, McIntyre DJO, Stubbs M, Griffiths JR. Issues in flow and oxygenation dependent contrast (FLOOD) imaging of tumours. NMR Biomed. 2001;14:497–506. doi: 10.1002/nbm.716. [DOI] [PubMed] [Google Scholar]
- 25.Baudelet C, Gallez B. Current issues in the utility of blood oxygen level dependent MRI for the assessment of modulations in tumor oxygenation. Curr Med Imaging Rev. 2005;1:229–243. [Google Scholar]
- 26.Robinson SP, Rijken P, Howe FA, McSheehy PMJ, van der Sanden BPJ, Heerschap A, Stubbs M, van der Kogel AJ, Griffiths JR. Tumor vascular architecture and function evaluated by non-invasive susceptibility MRI methods and immunohistochemistry. J. Magn. Reso. Imaging. 2003;17:445–454. doi: 10.1002/jmri.10274. [DOI] [PubMed] [Google Scholar]
- 27.Berkowitz BA, McDonald C, Ito Y, Tofts PS, Latif Z, Gross J. Measuring the human retinal oxygenation response to a hyperoxic challenge using MRI: Eliminating blinking artifacts and demonstrating proof of concept. Magn. Reson. Med. 2001;46:412–416. doi: 10.1002/mrm.1206. [DOI] [PubMed] [Google Scholar]
- 28.Akber SF. Correlation between oxygen tension and spin-lattice relaxation rate in tumors. Europ. J. Radiol. 1989;9:56–59. [PubMed] [Google Scholar]
- 29.Matsumoto K, Bernardo M, Subramanian S, Choyke P, Mitchell JB, Krishna MC, Lizak MJ. MR assessment of changes of tumor in response to hyperbaric oxygen treatment. Magn. Reson. Med. 2006;56:240–246. doi: 10.1002/mrm.20961. [DOI] [PubMed] [Google Scholar]
- 30.Winter JD, Akens MK, Cheng H-LM. Quantitative MRI assessment of VX2 tumour oxygenation changes in response to hyperoxia and hypercapnia. Phys. Med. Biol. 2011;56:1225. doi: 10.1088/0031-9155/56/5/001. [DOI] [PubMed] [Google Scholar]
- 31.O'Connor JPB, Naish JH, Jackson A, Waterton JC, Watson Y, Cheung S, Buckley DL, McGrath DM, Buonaccorsi GA, Mills SJ, Roberts C, Jayson GC, Parker GJM. Comparison of Normal Tissue R-1 and R-2* Modulation by Oxygen and Carbogen. Magn. Reson. Med. 2009;61:75–83. doi: 10.1002/mrm.21815. [DOI] [PubMed] [Google Scholar]
- 32.Burrell JS, Walker-Samuel S, Baker LCJ, Boult JKR, Jamin Y, Halliday J, Waterton JC, Robinson SP. Exploring ΔR2* and ΔR1 as imaging biomarkers of tumor oxygenation. J. Magn. Reson. Imaging. 2013;38:429–434. doi: 10.1002/jmri.23987. [DOI] [PubMed] [Google Scholar]
- 33.Hallac RR, Zhou H, Pidikiti R, Song K, Stojadinovic S, Zhao D, Solberg T, Peschke P, Mason RP. Correlations of noninvasive BOLD and TOLD MRI with pO2 and relevance to tumor radiation response. Magn. Reson. Med. 2014;71:1863–1873. doi: 10.1002/mrm.24846. [DOI] [PMC free article] [PubMed] [Google Scholar]
- 34.Zhao D, Constantinescu A, Chang C-H, Hahn EW, Mason RP. Correlation of Tumor Oxygen Dynamics with Radiation Response of the Dunning Prostate R3327-HI Tumor. Radiat. Res. 2003;159:621–631. doi: 10.1667/0033-7587(2003)159[0621:cotodw]2.0.co;2. [DOI] [PubMed] [Google Scholar]
- 35.Bourke VA, Zhao D, Gilio J, Chang C-H, Jiang L, Hahn EW, Mason RP. Correlation of Radiation Response with Tumor Oxygenation in the Dunning Prostate R3327-AT1 Tumor. Int. J. Radiat. Oncol. Biol. Phys. 2007;67:1179–1186. doi: 10.1016/j.ijrobp.2006.11.037. [DOI] [PMC free article] [PubMed] [Google Scholar]
- 36.Zhao D, Ran S, Constantinescu A, Hahn EW, Mason RP. Tumor oxygen dynamics: correlation of in vivo MRI with histological findings. Neoplasia. 2003;5:308–318. doi: 10.1016/S1476-5586(03)80024-6. [DOI] [PMC free article] [PubMed] [Google Scholar]
- 37.Zhao D, Constantinescu C, Hahn EW, Mason RP. Differential oxygen dynamics in two diverse Dunning prostate R3327 rat tumor sublines (MAT-Lu and HI) with respect to growth and respiratory challenge. Int. J. Radiat. Oncol. Biol. Phys. 2002;53:744–756. doi: 10.1016/s0360-3016(02)02822-5. [DOI] [PubMed] [Google Scholar]
- 38.Peschke P, Hahn EW, Wenz F, Lohr F, Braunschweig F, Wolber G, Zuna I, Wannenmacher M. Differential Sensitivity of Three Sublines of the Rat Dunning Prostate Tumor System R3327 to Radiation and/or Local Tumor Hyperthermia. Radiat. Res. 1998;150:423–430. [PubMed] [Google Scholar]
- 39.Isaacs JT, Isaac WB, Feitz WFJ, Scheres J. Establishment and characterization of 7 Dunning prostate cancer cell lines and their use in developing methods for predicting metastatic ability of prostate cancer. Prostate. 1986;9:261–281. doi: 10.1002/pros.2990090306. [DOI] [PubMed] [Google Scholar]
- 40.Hahn EW, Peschke P, Mason RP, Babcock EE, Antich PP. Isolated tumor growth in a surgically formed skin pedicle in the rat: A new tumor model for NMR studies. Magn. Reson. Imaging. 1993;11:1007–1017. doi: 10.1016/0730-725x(93)90219-4. [DOI] [PubMed] [Google Scholar]
- 41.Zechmann CM, Woenne EC, Brix G, Radzwill N, Ilg M, Bachert P, Peschke P, Kirsch S, Kauczor HU, Delorme S, Semmler W, Kiessling F. Impact of stroma on the growth, microcirculation, and metabolism of experimental prostate tumors. Neoplasia. 2007;9:57–67. doi: 10.1593/neo.06688. [DOI] [PMC free article] [PubMed] [Google Scholar]
- 42.Zhao D, Constantinescu A, Hahn EW, Mason RP. Tumor oxygen dynamics with respect to growth and respiratory challenge: investigation of the Dunning prostate R3327-HI tumor. Radiat. Res. 2001;156:510–520. doi: 10.1667/0033-7587(2001)156[0510:todwrt]2.0.co;2. [DOI] [PubMed] [Google Scholar]
- 43.Eble MJ, Wenz F, Bachert KB, Lohr F, Peschke P. Invasive pO2 histography in Dunning prostate tumor R-3327-AT1 and R3327-HI: Correlation with 31P-MR spectroscopy and in-vivo radiosensitivity. In: Vaupel PW, Kelleher DK, Günderoth M, editors. Tumor Oxygenation. Gustav Fischer; Stuttgart: 1995. pp. 95–105. [Google Scholar]
- 44.Liu H, Gu Y, Kim JG, Mason RP. Near Infrared Spectroscopy and Imaging of Tumor Vascular Oxygenation. Methods Enzymol. 2004;386:349–378. doi: 10.1016/S0076-6879(04)86017-8. [DOI] [PubMed] [Google Scholar]
- 45.Jordan BF, Crokart N, Baudelet C, Cron GO, Ansiaux R, Gallez B. Complex relationship between changes in oxygenation status and changes in R-2(*): The case of insulin and NS-398, two inhibitors of oxygen consumption. Magn. Reson. Med. 2006;56:637–643. doi: 10.1002/mrm.20963. [DOI] [PubMed] [Google Scholar]
- 46.Arias N, Pacheco-Torres J, López-Larrubia P. Proc. Intl. Soc. Mag. Reson. Med. Vol. 20. Melbourne: 2012. Predicting response to hyperbaric oxygen radiotherapy treatment in high grade gliomas using Magnetic Resonance Imaging techniques. p. 852. [Google Scholar]
- 47.Rodrigues LM, Howe FA, Griffiths JR, Robinson SP. Tumor R-2 * is a prognostic indicator of acute radiotherapeutic response in rodent tumors. J. Magn. Reson. Imaging. 2004;19:482–488. doi: 10.1002/jmri.20024. [DOI] [PubMed] [Google Scholar]
- 48.Jiang L, Zhao D, Constantinescu A, Mason RP. Comparison of BOLD contrast and Gd-DTPA Dynamic Contrast Enhanced imaging in rat prostate tumor. Magn. Reson. Med. 2004;51:953–960. doi: 10.1002/mrm.20069. [DOI] [PubMed] [Google Scholar]
- 49.McPhail LD, Robinson SP. Intrinsic Susceptibility MR Imaging of Chemically Induced Rat Mammary Tumors: Relationship to Histologic Assessment of Hypoxia and Fibrosis. Radiology. 2010;254:110–118. doi: 10.1148/radiol.2541090395. [DOI] [PubMed] [Google Scholar]
- 50.McSheehy PMJ, Weidensteiner C, Cannet C, Ferretti S, Laurent D, Ruetz S, Stumm M, Allegrini PR. Quantified Tumor T1 Is a Generic Early-Response Imaging Biomarker for Chemotherapy Reflecting Cell Viability. Clin. Cancer Res. 2010;16:212–225. doi: 10.1158/1078-0432.CCR-09-0686. [DOI] [PubMed] [Google Scholar]
- 51.Howe FA, Robinson SP, Rodrigues LM, Griffiths JR. Flow and oxygenation dependent (FLOOD) contrast MR imaging to monitor the response of rat tumors to carbogen breathing. Magn. Reson. Imaging. 1999;17:1307–1318. doi: 10.1016/s0730-725x(99)00089-2. [DOI] [PubMed] [Google Scholar]
- 52.Zhang Z, Hallac RR, Peschke P, Mason RP. A noninvasive tumor oxygenation imaging strategy using magnetic resonance imaging of endogenous blood and tissue water. Magn. Reson. Med. 2014;71:561–569. doi: 10.1002/mrm.24691. [DOI] [PMC free article] [PubMed] [Google Scholar]
- 53.Peller M, Reinl HM, Weigel A, Meininger M, Issels RD, Reiser M. T-1 rtelaxation time at 0.2 Tesla for monitoring regional hyperthermia: Feasibility study in muscle and adipose tissue. Magn. Reson. Med. 2002;47:1194–1201. doi: 10.1002/mrm.10155. [DOI] [PubMed] [Google Scholar]
- 54.Zaharchuk G, Busse RF, Rosenthal G, Manley GT, Glenn OA, Dillon WP. Noninvasive oxygen partial pressure measurement of human body fluids in vivo using magnetic resonance imaging. Acad. Radiol. 2006;13:1016–1024. doi: 10.1016/j.acra.2006.04.016. [DOI] [PubMed] [Google Scholar]
- 55.Lin AL, Qin Q, Zhao X, Duong TQ. Blood longitudinal (T (1)) and transverse (T (2)) relaxation time constants at 11.7 Tesla. Magn. Reson. Mat. Phys. Biol. Med. 2012;25:245–249. doi: 10.1007/s10334-011-0287-2. [DOI] [PMC free article] [PubMed] [Google Scholar]
- 56.Zhao D, Jiang L, Mason RP. Measuring Changes in Tumor Oxygenation. Methods Enzymol. 2004;386:378–418. doi: 10.1016/S0076-6879(04)86018-X. [DOI] [PubMed] [Google Scholar]
- 57.Mignion L, Magat J, Schakman O, Marbaix E, Gallez B, Jordan BF. Hexafluorobenzene in comparison with perfluoro-15-crown-5-ether for repeated monitoring of oxygenation using 19F MRI in a mouse model. Magn. Reson. Med. 2013;69:248–254. doi: 10.1002/mrm.24245. [DOI] [PubMed] [Google Scholar]
- 58.Robinson SP, Griffiths JR. Current Issues in the Utility of 19F Nuclear Magnetic Resonance Methodologies for the Assessment of Tumour Hypoxia. Phil. Trans Biol. Sci. 2004;359:987–996. doi: 10.1098/rstb.2003.1376. [DOI] [PMC free article] [PubMed] [Google Scholar]
- 59.Kodibagkar VD, Wang X, Pacheco-Torres J, Gulaka P, Mason RP. Proton Imaging of Siloxanes to map Tissue Oxygenation Levels (PISTOL): a tool for quantitative tissue oximetry. NMRBiomed. 2008;21:899–907. doi: 10.1002/nbm.1279. [DOI] [PMC free article] [PubMed] [Google Scholar]
- 60.Mason RP, Antich PP, Babcock EE, Constantinescu A, Peschke P, Hahn EW. Non-invasive determination of tumor oxygen tension and local variation with growth. Int. J. Radiat. Oncol. Biol. Phys. 1994;29:95–103. doi: 10.1016/0360-3016(94)90231-3. [DOI] [PubMed] [Google Scholar]
- 61.Krohn KA, Link JM, Mason RP. Molecular Imaging of Hypoxia. J. Nucl. Med. 2008;49:129S–148S. doi: 10.2967/jnumed.107.045914. [DOI] [PubMed] [Google Scholar]
- 62.Tran L-B-A, Bol A, Labar D, Jordan B, Magat J, Mignion L, Gregoire V, Gallez B. Hypoxia imaging with the nitroimidazole 18F-FAZA PET tracer: A comparison with OxyLite, EPR oximetry and 19F-MRI relaxometry. Radiother. Oncol. 2012;105:29–35. doi: 10.1016/j.radonc.2012.04.011. [DOI] [PubMed] [Google Scholar]
- 63.Oehler C, O'Donoghue JA, Russell J, Zanzonico P, Lorenzen S, Ling CC, Carlin S. F-18-Fluromisonidazole PET Imaging as a Biomarker for the Response to 5,6-Dimethylxanthenone-4-Acetic Acid in Colorectal Xenograft Tumors. J. Nucl. Med. 2011;52:437–444. doi: 10.2967/jnumed.110.081372. [DOI] [PMC free article] [PubMed] [Google Scholar]
- 64.Gu Y, Xia M, Liu H, Kodibagkar VD, Constantinescu A, Mason RP. Biomedical Topical Meetings p. FB6, The Optical Society of America. Washington, DC: 2004. Correlation of NIR spectroscopy with BOLD MR imaging of assessing breast tumor vascular oxygen status. [Google Scholar]
- 65.Xia M, Kodibagkar V, Liu H, Mason RP. Tumour oxygen dynamics measured simultaneously by near infrared spectroscopy and 19F magnetic resonance imaging in rats. Phys. Med. Biol. 2006;51:45–60. doi: 10.1088/0031-9155/51/1/004. [DOI] [PubMed] [Google Scholar]
- 66.Burton NC, Patel M, Morscher S, Driessen WHP, Claussen J, Beziere N, Jetzfellner T, Taruttis A, Razansky D, Bednar B, Ntziachristos V. Multispectral Opto-acoustic Tomography (MSOT) of the Brain and Glioblastoma Characterization. Neuroimage. 2013;65:522–528. doi: 10.1016/j.neuroimage.2012.09.053. [DOI] [PubMed] [Google Scholar]
- 67.Jordan BF, Magat J, Colliez F, Ozel E, Fruytier A-C, Marchand V, Mignion L, Bouzin C, Cani PD, Vandeputte C, Feron O, Delzenne N, Himmelreich U, Denolin V, Duprez T, Gallez B. Mapping of oxygen by imaging lipids relaxation enhancement: A potential sensitive endogenous MRI contrast to map variations in tissue oxygenation. Magn. Reson. Med. 2013;70:732–744. doi: 10.1002/mrm.24511. [DOI] [PubMed] [Google Scholar]
Associated Data
This section collects any data citations, data availability statements, or supplementary materials included in this article.