

Abstract
Aging is associated with a pro-inflammatory state, often referred to as inflammaging. The origin of the pro-inflammatory mediators and their role in the pathogenesis of the aging-associated diseases remain poorly understood. As aging is also associated with profound changes in the transcriptomic and epigenetic (e.g., DNA methylation) profiles of cells in the peripheral blood, we analyzed the correlation of these profiles with inflammaging using the “classical” marker interleukin-6 as an indicator. The analysis of the whole-genome peripheral blood mononuclear cell (PBMC) gene expression revealed 62 transcripts with expression levels that significantly correlated with the plasma interleukin-6 (IL-6) levels in men, whereas no correlations were observed in women. The Gene Ontology analysis of plasma IL-6-associated transcripts in men revealed processes that were linked to the inflammatory response. Additionally, an Ingenuity Pathway Analysis (IPA) pathway analysis identified Tec kinase signaling as an affected pathway and upstream regulator analysis predicted the activation of IL-10 transcript. DNA methylation was assessed using a HumanMethylation450 array. Seven genes with expression profiles that were associated with the plasma IL-6 levels in men were found to harbor CpG sites with methylation levels that were also associated with the IL-6 levels. Among these genes were IL1RN, CREB5, and FAIM3, which mapped to a network of inflammatory response genes. According to our results, inflammaging is manifested differently at the genomic level in nonagenarian men and women. Part of this difference seems to be of epigenetic origin. These differences point to the genomic regulation of inflammatory response and suggest that the gender-specific immune system dimorphism in older individuals could be accounted for, in part, by DNA methylation.
Electronic supplementary material
The online version of this article (doi:10.1007/s11357-015-9814-9) contains supplementary material, which is available to authorized users.
Keywords: Aging, Inflammaging, IL-6, Epigenetics, DNA methylation, Gene expression
Introduction
Aging is characterized as a progressive decline in functionality, accompanied by reduced capability to cope with stress and an increased risk of certain degenerative diseases. As a result of the aging process, the body undergoes several characteristic changes in tissues and body systems (Lopez-Otin et al. 2013), whereas some of the most significant alterations take place within the immune system (Wang and Casolaro 2014). With advancing age, the immune system undergoes remodeling and chronic, low-grade, systemic inflammation is ultimately established; this phenomenon has been termed inflammaging (Franceschi et al. 2000; Pawelec et al. 2014). Although the acute inflammatory response is beneficial, chronic, persistent inflammation can have detrimental consequences, as collateral tissue damage and degeneration are associated effects (Franceschi and Campisi 2014). Inflammation is known to be a pivotal component of several age-related diseases such as cardiovascular disease, diabetes, Alzheimer’s disease, and cancer (Singh and Newman 2011; De Martinis et al. 2005). Additionally, chronic inflammation is associated with other degenerative processes such as osteoporosis, sarcopenia, cognitive decline, and neurodegeneration (Singh and Newman 2011). Inflammaging has been proposed to stem from a lifelong cumulative antigenic burden (De Martinis et al. 2005), but the causality remains unknown. Interleukin-6 (IL-6) is a widely used marker of systemic inflammation that has been used to estimate the extent of inflammaging (Morrisette-Thomas et al. 2014; Singh and Newman 2011; Lin et al. 2014). High levels of circulating IL-6 are also associated with an increased risk for morbidity and mortality among older individuals (Harris et al. 1999; Schnabel et al. 2013).
Establishment of the chronic inflammatory state is determined not only by genetic factors, but also by environmental factors through epigenetic modifications (Bayarsaihan 2011). DNA methylation, the covalent addition of methyl groups to the cytosine base of CpG dinucleotide, is one of the most studied epigenetic modifications. CpG islands, local concentrations of CpG sites, are often present at the transcription start sites (TSS) of gene promoters, thus bringing forth an additional level of gene expression regulation. At gene promoters, methylated CpGs silence the transcription of genes by preventing transcription factor binding, whereas outside of the promoters, the effects of methylation might vary (Jones 2012). Both aging and aging-related pathologies are associated with changes in DNA methylation. Global hypomethylation and promoter-specific hypermethylation have been shown to be characteristic aging-associated changes (Bacalini et al. 2014; Marttila et al. 2015; Hannum et al. 2013). Aberrant methylation patterns have been observed in neurological disorders (Iraola-Guzman et al. 2011) such as Alzheimer’s disease and Parkinson’s disease, as well as in autoimmune diseases such as systemic lupus erythematosus, rheumatoid arthritis, and type 1 diabetes (Meda et al. 2011). In addition, many cancers are known to have an epigenetic component as part of their etiology through the hypermethylation of tumor suppressor gene promoters (Johnson et al. 2012). It is noteworthy that all of these diseases also share an inflammatory component.
The origin of inflammaging and its role in aging-associated diseases remain poorly understood. Recently, there have been studies associating IL-6 levels with transcriptomics data (Cheng et al. 2013; Lai et al. 2013; Lin et al. 2014). In this study, we likewise investigated the genome-wide associations of gene expression, but we also added an extra level of depth by introducing an epigenetic approach; we analyzed whether DNA methylation could explain the observed associations between plasma IL-6 levels and the peripheral blood mononuclear cell (PBMC) gene expression. We have previously reported that there are gender-specific differences in aging-associated gene expression changes (Marttila et al. 2013), as well as in aging-associated DNA methylation changes (Marttila et al. 2015). It has also been suggested that inflammaging is manifested differentially in men and women (Salvioli et al. 2006). Therefore, by investigating the IL-6-associated transcriptomic associations and the levels of DNA methylation of CpGs within these gene bodies separately in men and women, we aimed to shed light on the gender-specific genomic manifestations of inflammaging in very old individuals.
Materials and methods
Study population
The study population consisted of 156 nonagenarian individuals (women n = 109, men n = 47) who were participants in the Vitality 90+ study, an ongoing prospective population-based study involving individuals aged 90 years and older and living in the city of Tampere, Finland. The recruitment and characterization of the participants were carried out as previously described for earlier Vitality 90+ cohorts (Goebeler et al. 2003). All individuals in the study were of Western European descent. Written informed consent was obtained from each study participant, and the research protocol followed the guidelines of the Declaration of Helsinki. This study included individuals born in 1920, and the biological samples were collected in 2010, when subjects were 90 years old (Jylhava et al. 2013). Gene expression data were available for all the subjects whereas methylation data were available for 115 individuals (women n = 84, men n = 31).
Sample collection
Blood samples were drawn into EDTA tubes by trained medical students during home visits. All of the blood samples were collected between 8 a.m. and 12 a.m. Leukocyte separation was performed directly on the blood samples with a Ficoll-Paque density gradient (Ficoll-Paque™ Premium, cat no. 17-5442-03, GE Healthcare Bio-Sciences AB, Uppsala, Sweden). The PBMC layers were collected, and a subset of the cells was suspended in 150 μl of RNAlater solution (Ambion Inc., Austin TX, USA) to be used for gene expression microarray analysis. The subset of PBMCs that were to be used for FACS analysis and DNA extraction was stored in 1 ml of freezing solution (5/8 FBS, 2/8 RPMI-160 medium, 1/8 DMSO) (FBS cat. no. F7524, Sigma-Aldrich, MO, USA; RPMI: cat. no. R0883, Sigma-Aldrich, MO, USA; DMSO: cat. no. 1.02931.0500, VWR, Espoo, Finland).
Quantification of IL-6
The quantification of IL-6 levels in the plasma samples was carried out with the PeliKine compact™ human IL-6 ELISA kit (Sanquin Reagents, Amsterdam, The Netherlands), following the manufacturer’s protocol. IL-6 concentrations were measured using a standard curve obtained with static incubation, and absorbances were recorded at 450 nm with ELISA reader (Multiskan Ascent, Thermo Labsystems, Helsinki, Finland). Additionally, expression levels of IL-6 transcript in PBMCs were analyzed to address whether these cells contribute to the plasma IL-6 levels (see expression array below).
DNA extraction
The PBMC DNA was extracted using the spin protocol of the QIAamp DNA Mini kit (Qiagen, CA, USA), following the manufacturer’s instructions. The DNA was eluted in 60 μl of the elution buffer AE and stored at −20 °C for later use. The concentration of the extracted DNA was measured using the Qubit dsDNA HS Assay (Invitrogen, Eugene, OR, USA).
RNA extraction
For RNA extraction, equal amounts of PBS and RNAlater were added to the cell suspensions, followed by their removal by centrifugation, to leave only the cell pellets. A miRNeasy mini kit (Qiagen, CA, USA) was used to purify the RNA, according to the manufacturer’s protocol, using on-column DNase digestion (AppliChem GmbH, Darmstadt, Germany). The concentration and quality of the RNA were determined using an Agilent RNA 6000 Nano Kit on an Agilent 2100 Bioanalyzer (Agilent Technologies, CA, USA).
FACS
FACS analysis (BD FACSCanto II) was used to assess the proportions of different lymphocyte populations, and the results were analyzed using BD FACS DIVA, version 6.1.3 (BD Biosciences, Franklin Lakes, NJ, USA). The antibodies used were FITC-CD14 (cat. no. 11-0149), PerCP-Cy5.5-CD3 (45-0037), APC-CD28 (17-0289) (eBioscience, San Diego, CA, USA), PE-Cy™7-CD4 (cat. no. 557852), and APC-Cy™7-CD8 (557834 (BD Biosciences).
Expression array
The Illumina TotalPrep RNA Amplification Kit (Ambion Inc., TX, USA) was used to prepare labeled complementary RNA (cRNA) from 330 ng of total RNA. This was carried out with an overnight incubation, according to the manufacturer’s protocol. The quality of the obtained cRNA was assessed using a 2100 Bioanalyzer (Agilent Technologies). Of labeled cRNA, 1500 ng was hybridized to a HumanHT-12 v4 expression BeadChip (cat. no. BD-103-0204, Illumina Inc., CA, USA) according to the Illumina protocol in the Core Facility at the Department of Biotechnology, University of Tartu. Randomization was utilized when applying samples to the BeadChips. BeadScan (Illumina Inc., CA, USA) was used to scan the chips.
Preprocessing of the gene expression microarray data
The gene expression data obtained from the HumanHT-12 v4 microarray were preprocessed as a Lumibatch object and with the lumi pipeline using the R software (Du et al. 2008). The background was corrected using the bgAdjust.affy package. Log2 transformation was applied to the gene expression values, followed by normalization with the rsn method. To filter out non-expressed probes and bad-quality data, we only included probes with log2-transformed expression values between 5 and 100 from all of the chips. The quality of the data was verified using visualizations such as boxplots and principal component analysis (PCA) plots.
Correlations of gene expression with plasma IL-6 concentration
The associations between gene expression and plasma levels of IL-6 were investigated with bivariate correlation (Spearman) analyses, separately for men and women. The nominal Benjamini-Hochberg-adjusted p value was set to 0.05. The data analyses were performed using the R software (R version 2.15.3).
Subpopulation divisions of women
To address the unequal sample sizes between genders, the women were divided into four subpopulations of n = 47, so that their frequencies and frailty index distributions corresponded to those of men. Plasma IL-6 levels correlated significantly with the frailty index and were therefore taken into account. Correlation analysis for detecting gene expression associations with IL-6 in the subsamples was conducted as described above.
Pathway analyses
The identified genes were analyzed for potential enrichment in terms of Gene Ontology. This was accomplished using two dedicated online tools: Gene Ontology enrichment analysis and visualization tool (GOrilla) and Ingenuity Pathway Analysis (IPA) (Ingenuity Systems®, www.ingenuity.com). GOrilla (Eden et al. 2007, 2009) was used to identify the enriched GO processes for the IL-6-associated gene expression changes, and the analysis was carried out in a single ranked list running mode, including all the 7072 transcripts ranked according to their p value. The p value threshold was set to p < 10−4 to exclude majority of low-significance GO processes, and unresolved or duplicated transcripts were not included in the run. This corresponded to a Benjamini-Hochberg multiple test correction p value cutoff of 0.05. For pathway analysis, the IL-6-associated genes were analyzed on the IPA software. The IPA included all data sources provided by the Ingenuity Knowledge Base; it was also used as a reference set in all analyses. Only experimentally observed results were accepted for the molecular associations, and only data from humans were considered. The Benjamini-Hochberg multiple testing correction was applied to calculate the p values for the pathways. Canonical pathways containing at least three genes were considered as significant at the level of p < 0.05 (−logP >1.3).
DNA methylation array
Methylation profiling was carried out at the Institute for Molecular Medicine Finland (FIMM) Technology Centre, University of Helsinki, in two batches (time interval of 6 months). First, 1 μg of DNA was used for bisulfite conversion with the EZ-96 DNA Methylation Kit (Zymo Research), Irvine, CA, USA), according to the manufacturer’s instructions. Then, 4 μl of the DNA obtained from the bisulfite conversion was whole-genome amplified, enzymatically fragmented, and hybridized to the Infinium HumanMethylation450 BeadChip (Illumina Inc., CA, USA), which is designed to cover more than 485,000 CpG sites and allow for their investigation at single-nucleotide resolution. The order of the samples on the BeadChips was randomized. The iScan reader (Illumina Inc., San Diego, CA, USA) was used to scan the BeadChips.
Preprocessing of the methylation data
The R software (R version 2.15.3) was used to preprocess the methylation data as a MethyLumiSet object with an array-specific package, wateRmelon (Pidsley et al. 2013). Prior to any processing, all nonspecific or polymorphic sites (N = 76775) with a minor allele frequency (MAF) of higher than 5 % were removed based on database information (Chen et al. 2013). Bad-quality samples and target sites were filtered out by excluding sites with a beadcount <3 in 5 % of the samples (N = 515) and sites with 1 % of the samples with a detection p value >0.05 (N = 698). Background correction and quantile normalization with the dasen method were individually conducted for both chemistries (Infinium I and II), as well as for the intensities of methylation (m) and un-methylation (u). Following the dasen treatment, the u and m intensities were transformed to beta (β) values. β represents the ratio of the methylated probe (m) intensities and the overall intensities (m + u + α), where α is the constant offset of 100. Therefore, the values of β linearly range between 0 (non-methylated, 0 %) and 1 (completely methylated, 100 %). The batch effect of the two chemistries was addressed using the BMIQ method based on the beta mixture models and EM algorithm (Teschendorff et al. 2013). The quality of the preprocessed data was assessed with several visualization styles such as boxplots from the raw intensities, Kernel density plots for the chemistry correction procedure, and PCA plots for normalized data. The batch effect originating from the two laboratory days (time interval of 6 months) was confirmed by PCA (PC2 6.8 %) to be a cause of bias in the data. Thus, the bias was taken into account in the regression analysis stage.
Detection of DMCs
First, the CpG sites with substantial differences in the absolute value of DNA methylation (obtained using 450K bead chip, as described above) between nonagenarians in the highest and lowest quartiles of IL-6 plasma concentrations were extracted. This was conducted by calculating the median values of methylation in the IL-6 extreme groups, and sites with −0.01 < Δβ < 0.01 were included for further analysis. Next, to assess the relationship between IL-6 and site-specific methylation levels, i.e., to explore differentially methylated CpG sites (DMCs) as a function of IL-6, a generalized regression model, referred to as variable dispersion beta regression, was utilized in an iterative manner (n = 132,660 models for men). The plasma IL-6 concentration was employed as a regulator of the site-specific methylation outcome in the form of β-values (ranging from 0 to 1) in each equation, using the mean model with a linker function of logit. Furthermore, as was previously observed by PCA, methylation levels fluctuate based on the composition of blood cell subtypes (Marttila et al. 2015), so the variables corresponding to cell-type proportions (the CD4+ to CD8+ ratio and the proportions of CD28−/CD4+, CD28−/CD8+, and CD14+ cells) were set as adjustments in the analysis (characterization of these cell populations in the nonagenarian men is shown in the supplementary Table 1). In particular, the proportions of CD28−/CD4+ and CD28−/CD8+ cells were shown to clearly correlate with principal component 1, which explained 20 % of the overall variance in the methylation. The batch effect of the two laboratory periods of the 450K array analyses was used as an additional covariate in the multiple regression analysis. The analyses were performed using R software (R version 2.15.3). The regression analysis was conducted with algorithms implemented in the betareg package (Francisco Cribari-Neto 2010; Ferrari 2004), and the nominal Benjamini-Hochberg-adjusted p value was set to 0.05.
Array data
The array data are available in the GEO database (http://www.ncbi.nlm.nih.gov/geo/), with accession numbers GSE40366 for the gene expression data and GSE58888 for the methylation data.
Results
Plasma IL-6 concentrations in nonagenarian women and men
The mean (SD) plasma concentrations of IL-6 in nonagenarian women (n = 101) and men (n = 43) who had transcriptional data available were 4.66 pg/ml (3.31) and 5.21 pg/ml (3.88) (see supplementary Fig. 1), respectively, with no statistically significant difference. The 31 men from whom the methylation data were available had a mean (SD) plasma IL-6 concentration of 5.66 pg/ml (4.20). As regard to PBMC gene expression, the IL-6 transcript was filtered out due to low expression in the preprocessing of the transcriptomic data. However, if calculated, no correlation was observed between PBMC IL-6 gene expression and plasma IL-6 levels.
Plasma IL-6 concentration is associated with PBMC gene expression in men but not in women
The analysis on gene expression revealed 62 transcripts with expression levels that correlated with IL-6 levels in nonagenarian men (with a cutoff of Benjamini-Hochberg-corrected p < 0.2, Table 1). The gene with the most significant association with plasma IL-6 levels was SPOCK2 (Benjamini-Hochberg-corrected p = 0.014), which encodes a member of the Ca2+-binding proteoglycan family that is expressed in multiple neuronal cell types and potentially acts in neurogenesis (Vannahme et al. 1999). The PBMC gene expression profiles of women did not show any associations with plasma IL-6 levels. Analyzing women in four randomly selected frailty score-matched subsamples (n = 47) did not change this result, which ensures that the negative result was not due to the unequal sample sizes between men and women.
Table 1.
Sixty-two transcripts whose expression levels significantly correlated with plasma IL-6 levels in nonagenarian men
| Gene | Description | p value | R |
|---|---|---|---|
| SPOCK2 | Sparc/osteonectin, cwcv, and kazal-like domains proteoglycan (testican) 2 | 0.0144 | −0.6386 |
| NA | NA | 0.0458 | 0.5868 |
| LRRFIP2 | Leucine-rich repeat (in FLII) interacting protein 2 | 0.0458 | 0.5841 |
| SMA4 | Glucuronidase, beta pseudogene | 0.0458 | 0.5821 |
| LILRA5 | Leukocyte immunoglobulin-like receptor, subfamily A (with TM domain), member 5 | 0.0458 | 0.5763 |
| NA | NA | 0.0458 | 0.5723 |
| GUSBP1 | Glucuronidase, beta pseudogene 1 | 0.0458 | 0.5687 |
| RAB1A | RAB1A, member RAS oncogene family | 0.0740 | 0.5527 |
| ASGR2 | Asialoglycoprotein receptor 2 | 0.0822 | 0.5453 |
| DSC2 | Desmocollin 2 | 0.0822 | 0.5438 |
| MTMR14 | Myotubularin-related protein 14 | 0.0894 | 0.5377 |
| ASGR2 | Asialoglycoprotein receptor 2 | 0.0894 | 0.5364 |
| CHSY1 | Chondroitin sulfate synthase 1 | 0.1364 | 0.5204 |
| RHOU | Ras homolog family member u | 0.1364 | 0.5169 |
| MAGED1 | Melanoma antigen family d, 1 | 0.1364 | −0.5151 |
| COTL1 | Coactosin-like 1 (Dictyostelium) | 0.1364 | 0.5147 |
| NANS | N-acetylneuraminic acid synthase | 0.1364 | 0.5106 |
| NA | NA | 0.1364 | −0.5094 |
| CSF3R | Colony-stimulating factor 3 receptor (granulocyte) | 0.1364 | 0.5091 |
| RHOQ | Ras homolog family member Q | 0.1364 | 0.5077 |
| CREB5 | cAMP-responsive element-binding protein 5 | 0.1364 | 0.5075 |
| FCGR1A | Fc fragment of IgG, high affinity Ia, receptor (CD64) | 0.1370 | 0.5046 |
| NLRP12 | NLR family, pyrin domain containing 12 | 0.1370 | 0.5038 |
| CSTA | Cystatin A (stefin A) | 0.1370 | 0.5032 |
| LILRB2 | Leukocyte immunoglobulin-like receptor, subfamily B (with TM and ITIM domains), member 2 | 0.1432 | 0.4988 |
| LILRB4 | Leukocyte immunoglobulin-like receptor, subfamily B (with TM and ITIM domains), member 4 | 0.1432 | 0.4977 |
| ACTB | Actin, beta | 0.1432 | 0.4963 |
| VMP1 | Vacuole membrane protein 1 | 0.1432 | 0.4951 |
| NUMB | Numb homolog (Drosophila) | 0.1432 | 0.4950 |
| SMARCD3 | SWI/SNF-related, matrix-associated, actin-dependent regulator of chromatin, subfamily d, member 3 |
0.1432 | 0.4948 |
| FBN2 | Fibrillin 2 | 0.1473 | 0.4928 |
| C12orf57 | Chromosome 12 open reading frame 57 | 0.1515 | −0.4907 |
| BLOC1S4 | Biogenesis of lysosomal organelles complex-1, subunit 4, cappuccino | 0.1515 | −0.4890 |
| HCK | Hemopoietic cell kinase | 0.1515 | 0.4887 |
| TTLL4 | Tubulin tyrosine ligase-like family, member 4 | 0.1515 | 0.4880 |
| MXD1 | MAX dimerization protein 1 | 0.1811 | 0.4812 |
| FAIM3 | Fas apoptotic inhibitory molecule 3 | 0.1826 | −0.4795 |
| KCNMB1 | Potassium large conductance calcium-activated channel, subfamily m, beta member 1 | 0.1826 | 0.4784 |
| C19orf59 | Chromosome 19 open reading frame 59 | 0.1826 | 0.4780 |
| CAPRIN1 | Cell cycle-associated protein 1 | 0.1826 | 0.4762 |
| NAE1 | NEDD8 activating enzyme E1 subunit 1 | 0.1826 | −0.4757 |
| NA | NA | 0.1826 | −0.4750 |
| MIB2 | Mindbomb E3 ubiquitin protein ligase 2 | 0.1826 | −0.4748 |
| LILRA5 | Leukocyte immunoglobulin-like receptor, subfamily A (with TM domain), member 5 | 0.1826 | 0.4741 |
| SLC22A15 | Solute carrier family 22, member 15 | 0.1832 | 0.4731 |
| ABHD14A | Abhydrolase domain containing 14A | 0.1832 | −0.4707 |
| GNA15 | Guanine nucleotide-binding protein (G protein), alpha 15 (Gq class) | 0.1832 | 0.4705 |
| SLC19A1 | Solute carrier family 19 (folate transporter), member 1 | 0.1832 | 0.4702 |
| NA | NA | 0.1832 | 0.4697 |
| IL1RN | Interleukin 1 receptor antagonist | 0.1832 | 0.4683 |
| PDLIM7 | PDZ and LIM domain 7 (enigma) | 0.1832 | 0.4681 |
| C20orf194 | Chromosome 20 open reading frame 194 | 0.1832 | 0.4675 |
| SNRPN | Small nuclear ribonucleoprotein polypeptide N | 0.1832 | −0.4672 |
| VCAN | Versican | 0.1832 | 0.4669 |
| TLR5 | Toll-like receptor 5 | 0.1881 | 0.4650 |
| ZNF333 | Zinc finger protein 333 | 0.1881 | 0.4647 |
| LRRFIP2 | Leucine-rich repeat (in FLII) interacting protein 2 | 0.1948 | 0.4629 |
| SKAP1 | Src kinase-associated phosphoprotein 1 | 0.1964 | −0.4618 |
| AQP9 | Aquaporin 9 | 0.1964 | 0.4614 |
| MEFV | Mediterranean fever | 0.1968 | 0.4607 |
| SLC12A6 | Solute carrier family 12 (potassium/chloride transporter), member 6 | 0.1968 | 0.4598 |
| STK3 | Serine/threonine kinase 3 | 0.1968 | 0.4595 |
Table shows gene, description, Benjamini-Hochberg-adjusted p value and correlation coefficient (Spearman’s rho)
GOrilla revealed 20 enriched processes (Benjamini-Hochberg-corrected p value <0.05) in a single ranked list analysis (Table 2). The top GO processes included immune system-related actions such as inflammatory response and defense response. GO function analysis revealed three enriched terms, including receptor activity, calcium ion binding, and scavenger receptor activity.
Table 2.
Analysis of Gene Ontology in IL-6-associated differentially expressed genes yielded enriched processes in nonagenarian men
| GO term | Description | p value | q value |
|---|---|---|---|
| GO:0022610 | Biological adhesion | 6.22E − 8 | 6.15E − 4 |
| GO:0007155 | Cell adhesion | 6.66E − 8 | 3.29E − 4 |
| GO:0006954 | Inflammatory response | 6.85E − 8 | 2.26E − 4 |
| GO:0098602 | Single organism cell adhesion | 5.94E − 7 | 1.47E − 3 |
| GO:0006952 | Defense response | 9.89E − 7 | 1.96E − 3 |
| GO:0046903 | Secretion | 4.69E − 6 | 7.72E − 3 |
| GO:0009605 | Response to external stimulus | 6.69E − 6 | 9.44E − 3 |
| GO:0016337 | Single organismal cell-cell adhesion | 9.01E − 6 | 1.11E − 2 |
| GO:0051241 | Negative regulation of multicellular organismal process | 9.6E − 6 | 1.05E − 2 |
| GO:0050896 | Response to stimulus | 1.36E − 5 | 1.35E − 2 |
| GO:0030198 | Extracellular matrix organization | 1.5E − 5 | 1.34E − 2 |
| GO:0043062 | Extracellular structure organization | 1.5E − 5 | 1.23E − 2 |
| GO:0065008 | Regulation of biological quality | 1.53E − 5 | 1.17E − 2 |
| GO:0048878 | Chemical homeostasis | 1.72E − 5 | 1.22E − 2 |
| GO:0006887 | Exocytosis | 2.04E − 5 | 1.34E − 2 |
| GO:0032940 | Secretion by cell | 2.21E − 5 | 1.36E − 2 |
| GO:0003008 | System process | 3.03E − 5 | 1.76E − 2 |
| GO:0032501 | Multicellular organismal process | 4.51E − 5 | 2.48E − 2 |
| GO:0044707 | Single-multicellular organism process | 4.53E − 5 | 2.36E − 2 |
| GO:0042592 | Homeostatic process | 5.57E − 5 | 2.75E − 2 |
Table shows descriptions of the processes, as well as their significance. q value is Benjamini-Hochberg multiple testing-corrected p value
Furthermore, IPA was used to acquire more specific transcript-associated pathway information, revealing one significant pathway (Benjamini-Hochberg-corrected p value <0.05). This pathway, Tec kinase signaling, included five affected genes: ACTB, GNA15, HCK, RHOQ, and RHOU. In the IPA upstream regulator analysis, IL-10 was identified as activated (activation z-score of 2.190), upregulating five transcripts (FCGR1A, IL1RN, LILRB2, LILRB4, and VCAN). However, no correlation was observed between the PBMC IL-10 expression levels and the IL-6 plasma levels in either men or women. Finally, the IPA revealed three enriched networks, woven from the altered transcripts. These networks were as follows: (1) cell death and survival, renal necrosis/cell death, and cellular growth and proliferation; (2) inflammatory response, infectious disease, and cellular function and maintenance; and (3) cellular compromise, embryonic development, and organismal development. These networks included 16, 14, and 14 transcripts, respectively.
Plasma IL-6-associated DMCs in identified gene bodies
The associations between plasma IL-6 levels and gene targeted DNA methylation was investigated with a regression analysis with a p < 0.05 (Benjamini-Hochberg adjusted) cutoff. Seven genes with expression profiles associated with IL-6 levels were found to harbor CpG sites with methylation levels that were also associated with IL-6 (Table 3). These genes were CREB5 (cg20997268, cg05929675, cg21004899), FAIM3 (cg17460386), IL1RN (cg25265126), LRRFIP2 (cg06853609), SKAP1 (cg00582562, cg24636368), SLC19A1 (cg21279603), and SPOCK2 (cg14614581). Of these, for FAIM3, SLC19A1, and SPOCK2, there was a significant inverse correlation between methylation and expression levels (r = −0.435, r = −0.680, r = −0.698 and p = 0.011, p < 0.005, and p < 0.005, respectively, see Fig. 1). The IPA network analysis of the seven identified genes revealed a network categorized as inflammatory response, cell-to-cell signaling and interaction, and cellular movement (Fig. 2), which contained the genes CREB5, FAIM3, and IL1RN.
Table 3.
The seven observed genes identified in both IL-6-associated differentially expressed genes and IL-6-associated DMCs in nonagenarian men
| CpG site | Gene | Description | Chromosome |
|---|---|---|---|
| cg20997268 | CREB5 | cAMP-responsive element-binding protein 5 | 7 |
| cg05929675 | CREB5 | cAMP-responsive element-binding protein 5 | 7 |
| cg21004899 | CREB5 | cAMP-responsive element-binding protein 5 | 7 |
| cg17460386 | FAIM3 | Fas apoptotic inhibitory molecule 3 | 1 |
| cg25265126 | IL1RN | Interleukin 1 receptor antagonist | 2 |
| cg06853609 | LRRFIP2 | Leucine-rich repeat (in FLII) interacting protein 2 | 3 |
| cg00582562 | SKAP1 | Src kinase-associated phosphoprotein 1 | 17 |
| cg24636368 | SKAP1 | Src kinase-associated phosphoprotein 1 | 17 |
| cg21279603 | SLC19A1 | Solute carrier family 19 (folate transporter), member 1 | 21 |
| cg14614581 | SPOCK2 | Sparc/osteonectin, cwcv and kazal-like domains proteoglycan (testican) 2 | 10 |
Table shows description of these genes and their chromosomal location
Fig. 1.
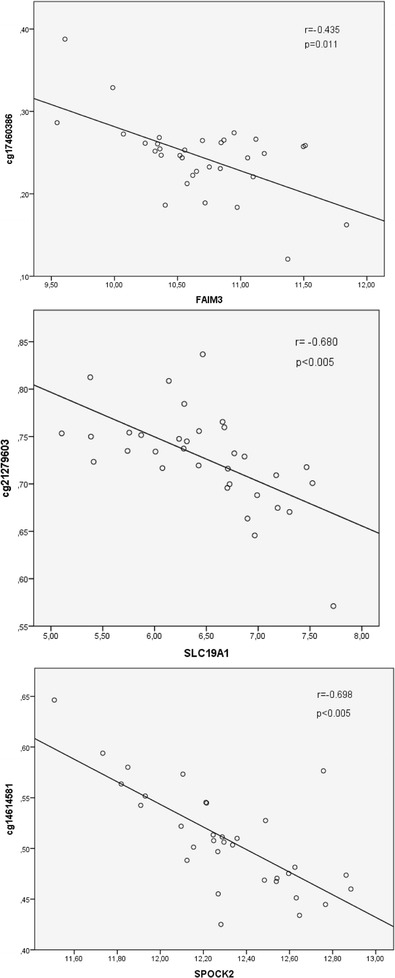
Inverse correlations were observed between the expression levels of the three genes and the CpG sites that resided in their corresponding gene bodies. X-axis visualizes the relative gene expression level of the gene while the Y-axis depicts the β-value, corresponding to the level of DNA methylation
Fig. 2.
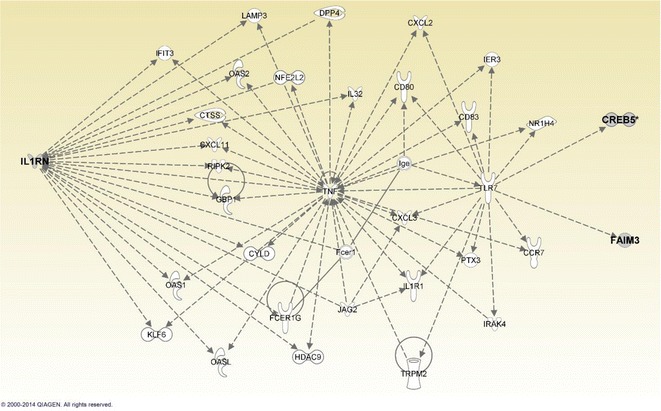
IPA network categorized as inflammatory response, cell-to-cell signaling and interaction, and cellular movement. Three genes of this network, IL1RN, CREB5, and FAIM3, were identified as associated with plasma IL-6 levels in both epigenetic and transcriptomic analyses in nonagenarian men. The figure shows interactions that these genes have within the network
Discussion
The goal of this study was to combine epigenetic and transcriptomic profiling to investigate their associations with the aging-associated chronic inflammatory state termed inflammaging in elderly individuals. Plasma levels of the pro-inflammatory cytokine IL-6 were used as an indicator of inflammaging, as its levels are characteristically elevated with age and the magnitude of the immune response (Wei et al. 1992; Ershler and Keller 2000; Baylis et al. 2013). In this study, we wanted to address the possible gender-specific effects because we have previously reported that there are gender-specific gene expression differences associated with the aging of the immune system (Marttila et al. 2013), as well as with aging-associated DNA methylation changes that link to immune system processes (Marttila et al. 2015).
The baseline expression level of the IL-6 transcript in PBMCs was low, which suggests that the main source of circulating IL-6 is not the PBMCs but cells in some other tissue. In support of this notion, a role for adipose tissue as a source of IL-6 in inflammaging has been proposed (Baylis et al. 2013) and the hepatic residential macrophages, Kupffer cells, are another potential source (Gregory et al. 1998). However, our data do not allow us to unravel the source of plasma IL-6 or to discriminate between immunosenescence- and disease-induced elevations in the IL-6 plasma levels. We acknowledge that this is a limitation of our study.
The analysis of the correlation of the PBMC gene expression with the plasma IL-6 levels identified 62 associated transcripts in nonagenarian men, whereas none was found in women. This could be an indication of how men and women are differentially affected by inflammaging (Salvioli et al. 2006) at advanced ages. Thus, the women were omitted from the DNA methylation association analysis due to the lack of any associations between the gene expression and the plasma IL-6 levels. The analysis of the Gene Ontology of the genes that were differentially expressed in men identified GO processes that were involved in the inflammatory response, cell adhesion, and secretion. Additionally, the GO function analysis revealed terms such as receptor activity, calcium ion binding, and scavenger receptor activity, which imply that IL-6-associated gene expression patterns are mainly signaling related.
The IPA pathway analysis revealed Tec kinase signaling as the only significant pathway. Tec kinase signaling has been shown to play a pivotal role in signaling through immune cell antigen receptors such as the TCR, BCR, and Fcɛ receptor. Signaling through this pathway leads to cytokine production, clonal expansion, lymphocyte development, differentiation, and apoptosis (Miller and Berg 2002). In addition, downstream effects could involve cytoskeletal reorganization accompanied by β1 integrin activation and β-actin polymerization (Woods et al. 2001).
The interactions of IL-6-associated transcripts were further investigated with IPA network analysis. One of the top networks identified was categorized as inflammatory response, infectious disease, and cellular function and maintenance, in which most of the focus molecules were associated with the nuclear factor kappa B (NF-κB) complex, which is one of the most pivotal agents in the pro-inflammatory signaling pathways (Lawrence 2009). This finding also indicates that the gene expression changes associated with the plasma IL-6 levels in men are related to the immune system.
In the IPA upstream regulator analysis, which was predicted according to the gene expression data, IL-10 activation was observed in men. IL-10 activation is a well-known anti-inflammatory activity that is initiated by IL-6 (Steensberg et al. 2003), and this observation could at least partly explain the differential regulation of inflammaging between genders, which is also referred as the anti-inflammaging component, as suggested by Franceschi et al. (2007). However, the IL-10 expression levels in PBMCs did not correlate with the plasma IL-6 levels.
One association study between IL-6 levels and gene expression profiles has been previously conducted. Recently, Lin et al. reported associations between whole-blood gene expression and IL-6 levels, identifying a total of 807 IL-6-associated transcripts (Lin et al. 2014). Compared with our results, we were able to identify 62 genes, and 11 of these genes overlapped with those reported by Lin et al. The difference may be partly attributable to the different ages of the samples. Additionally, our gene expression profiling was carried out using PBMCs, which likely narrowed down the number of identified transcripts.
The analysis of DNA methylation targeted to the CpG sites that were harbored by the genes identified as being differentially expressed in men in the transcriptomic association analysis. The gene bodies of 62 associated transcripts included a total of ten identified DMCs in seven transcripts. For three of these genes, a classical regulatory relationship was observed, where hypomethylated DMCs corresponded to increased gene expression while hypermethylation corresponded to decreased gene expression (Fig. 1). This, however, is usually applied to CpG sites within promoter regions; methylation within the gene body is less understood. Thus, the causality of IL-6 levels and the association between DNA methylation and gene expression can only be speculated. IL-6 has been reported to be capable of affecting the activity of DNMT1, thus indirectly affecting DNA methylation (Hodge et al. 2007). Thus, a prolonged inflammatory response could affect PBMC methylation patterns through elevated IL-6 levels.
Network analysis of the seven overlapping genes in the IPA revealed that three out of the seven genes mapped into the same network, inflammatory response, cell-to-cell signaling and interaction, and cellular movement. Of the three related genes, CREB5 and FAIM3 were connected to TLR7, which is a crucial agent in the innate immune system. IL1RA, on the other hand, is an important regulator of the inflammatory response (Arend et al. 1998). We have also previously reported that high plasma IL-1Ra levels predict mortality in nonagenarians (Jylha et al. 2007). The innate immune system is known to undergo dysregulation as we get older, and this appears to be affected differently in men and women.
In conclusion, our results demonstrate that aging-associated chronic inflammation, termed inflammaging, is manifested differently at the genomic level in nonagenarian men and women and that part of this difference seems to be of epigenetic origin. These differences point to genomic regulation of the inflammatory response and suggest that the gender-specific immune system dimorphism in older individuals could be manifested for, at least in part, by DNA methylation.
Electronic supplementary material
Characterization of the cell populations used for the adjustment of the beta regression in nonagenarian men (n = 31). (.doc) (DOC 31 kb)
Characterization of plasma IL-6 levels in nonagenarian men (n = 43) and women (n = 101) who had gene expression data available. (.doc) (DOC 35 kb)
Acknowledgments
We would like to thank Sinikka Repo-Koskinen, Janette Hinkka, Katri Välimaa, and Sanna Tuominen for their skillful technical assistance.
Conflict of interest
None declared.
Author’s contributions
TN was primarily responsible for writing the manuscript. JJ and TN and SM performed the experiments. LK processed the data and performed statistical analyses. AH and MJ were responsible for recruiting the study population. MH provided the reagents and materials for the study. TN, SM, LK, JJ, and MH contributed to the design of the study. All authors contributed to the writing of the manuscript.
Contributor Information
T. Nevalainen, Email: tapio.l.nevalainen@uta.fi
L. Kananen, Email: laura.kananen@uta.fi
S. Marttila, Email: saara.marttila@uta.fi
M. Jylhä, Email: marja.jylha@uta.fi
A. Hervonen, Email: antti.hervonen@uta.fi
M. Hurme, Email: mikko.a.hurme@uta.fi
J. Jylhävä, Email: juulia.jylhava@uta.fi
References
- Arend WP, Malyak M, Guthridge CJ, Gabay C. Interleukin-1 receptor antagonist: role in biology. Annu Rev Immunol. 1998;16:27–55. doi: 10.1146/annurev.immunol.16.1.27. [DOI] [PubMed] [Google Scholar]
- Bacalini MG, Friso S, Olivieri F, Pirazzini C, Giuliani C, Capri M, et al. Present and future of anti-ageing epigenetic diets. Mech Ageing Dev. 2014;136-137:101–115. doi: 10.1016/j.mad.2013.12.006. [DOI] [PubMed] [Google Scholar]
- Bayarsaihan D. Epigenetic mechanisms in inflammation. J Dent Res. 2011;90:9–17. doi: 10.1177/0022034510378683. [DOI] [PMC free article] [PubMed] [Google Scholar]
- Baylis D, Bartlett DB, Patel HP, Roberts HC (2013) Understanding how we age: insights into inflammaging. Longev Healthspan 2:8-2395-2-8 [DOI] [PMC free article] [PubMed]
- Chen YA, Lemire M, Choufani S, Butcher DT, Grafodatskaya D, Zanke BW, et al. Discovery of cross-reactive probes and polymorphic CpGs in the Illumina Infinium HumanMethylation450 microarray. Epigenetics. 2013;8:203–209. doi: 10.4161/epi.23470. [DOI] [PMC free article] [PubMed] [Google Scholar]
- Cheng CC, Hsueh CM, Chen CY, Chen TH, Hsu SL. Interleukin-6 upregulates paraoxonase 1 gene expression via an AKT/NF-kappaB-dependent pathway. Biochem Biophys Res Commun. 2013;437:55–61. doi: 10.1016/j.bbrc.2013.06.034. [DOI] [PubMed] [Google Scholar]
- De Martinis M, Franceschi C, Monti D, Ginaldi L. Inflamm-ageing and lifelong antigenic load as major determinants of ageing rate and longevity. FEBS Lett. 2005;579:2035–2039. doi: 10.1016/j.febslet.2005.02.055. [DOI] [PubMed] [Google Scholar]
- Du P, Kibbe WA, Lin SM. lumi: a pipeline for processing Illumina microarray. Bioinformatics. 2008;24:1547–1548. doi: 10.1093/bioinformatics/btn224. [DOI] [PubMed] [Google Scholar]
- Eden E, Lipson D, Yogev S, Yakhini Z. Discovering motifs in ranked lists of DNA sequences. PLoS Comput Biol. 2007;3:e39. doi: 10.1371/journal.pcbi.0030039. [DOI] [PMC free article] [PubMed] [Google Scholar]
- Eden E, Navon R, Steinfeld I, Lipson D, Yakhini Z (2009) GOrilla: a tool for discovery and visualization of enriched GO terms in ranked gene lists. BMC Bioinformatics 10: 48-2105-10-48 [DOI] [PMC free article] [PubMed]
- Ershler WB, Keller ET. Age-associated increased interleukin-6 gene expression, late-life diseases, and frailty. Annu Rev Med. 2000;51:245–270. doi: 10.1146/annurev.med.51.1.245. [DOI] [PubMed] [Google Scholar]
- Ferrari C. Beta regression for modelling rates and proportions. J Appl Stat. 2004;31:799–815. doi: 10.1080/0266476042000214501. [DOI] [Google Scholar]
- Franceschi C, Campisi J. Chronic inflammation (inflammaging) and its potential contribution to age-associated diseases. J Gerontol A Biol Sci Med Sci. 2014;69(Suppl 1):S4–S9. doi: 10.1093/gerona/glu057. [DOI] [PubMed] [Google Scholar]
- Franceschi C, Bonafe M, Valensin S, Olivieri F, De Luca M, Ottaviani E, et al. Inflamm-aging. An evolutionary perspective on immunosenescence. Ann N Y Acad Sci. 2000;908:244–254. doi: 10.1111/j.1749-6632.2000.tb06651.x. [DOI] [PubMed] [Google Scholar]
- Franceschi C, Capri M, Monti D, Giunta S, Olivieri F, Sevini F, et al. Inflammaging and anti-inflammaging: a systemic perspective on aging and longevity emerged from studies in humans. Mech Ageing Dev. 2007;128:92–105. doi: 10.1016/j.mad.2006.11.016. [DOI] [PubMed] [Google Scholar]
- Francisco Cribari-neto, A.Z., 2010—last update, beta regression in R. [Homepage of Journal of Statistical Software 34(2), 1-24.], [Online]. Available: http://www.jstatsoft.org/v34/i02/
- Goebeler S, Jylha M, Hervonen A. Medical history, cognitive status and mobility at the age of 90. A population-based study in Tampere, Finland. Aging Clin Exp Res. 2003;15:154–161. doi: 10.1007/BF03324494. [DOI] [PubMed] [Google Scholar]
- Gregory SH, Wing EJ, Danowski KL, van Rooijen N, Dyer KF, Tweardy DJ. IL-6 produced by Kupffer cells induces STAT protein activation in hepatocytes early during the course of systemic listerial infections. J Immunol. 1998;160:6056–6061. [PubMed] [Google Scholar]
- Hannum G, Guinney J, Zhao L, Zhang L, Hughes G, Sadda S, et al. Genome-wide methylation profiles reveal quantitative views of human aging rates. Mol Cell. 2013;49:359–367. doi: 10.1016/j.molcel.2012.10.016. [DOI] [PMC free article] [PubMed] [Google Scholar]
- Harris TB, Ferrucci L, Tracy RP, Corti MC, Wacholder S, Ettinger WH, Jr, et al. Associations of elevated interleukin-6 and C-reactive protein levels with mortality in the elderly. Am J Med. 1999;106:506–512. doi: 10.1016/S0002-9343(99)00066-2. [DOI] [PubMed] [Google Scholar]
- Hodge DR, Cho E, Copeland TD, Guszczynski T, Yang E, Seth AK, et al. IL-6 enhances the nuclear translocation of DNA cytosine-5-methyltransferase 1 (DNMT1) via phosphorylation of the nuclear localization sequence by the AKT kinase. Cancer Genomics Proteomics. 2007;4:387–398. [PubMed] [Google Scholar]
- Iraola-Guzman S, Estivill X, Rabionet R. DNA methylation in neurodegenerative disorders: a missing link between genome and environment? Clin Genet. 2011;80:1–14. doi: 10.1111/j.1399-0004.2011.01673.x. [DOI] [PubMed] [Google Scholar]
- Johnson AA, Akman K, Calimport SR, Wuttke D, Stolzing A, de Magalhaes JP. The role of DNA methylation in aging, rejuvenation, and age-related disease. Rejuvenation Res. 2012;15:483–494. doi: 10.1089/rej.2012.1324. [DOI] [PMC free article] [PubMed] [Google Scholar]
- Jones PA. Functions of DNA methylation: islands, start sites, gene bodies and beyond. Nat Rev Genet. 2012;13:484–492. doi: 10.1038/nrg3230. [DOI] [PubMed] [Google Scholar]
- Jylha M, Paavilainen P, Lehtimaki T, Goebeler S, Karhunen PJ, Hervonen A, et al. Interleukin-1 receptor antagonist, interleukin-6, and C-reactive protein as predictors of mortality in nonagenarians: the vitality 90+ study. J Gerontol A Biol Sci Med Sci. 2007;62:1016–1021. doi: 10.1093/gerona/62.9.1016. [DOI] [PubMed] [Google Scholar]
- Jylhava J, Nevalainen T, Marttila S, Jylha M, Hervonen A, Hurme M. Characterization of the role of distinct plasma cell-free DNA species in age-associated inflammation and frailty. Aging Cell. 2013;12:388–397. doi: 10.1111/acel.12058. [DOI] [PubMed] [Google Scholar]
- Lai HS, Lin WH, Lai SL, Lin HY, Hsu WM, Chou CH, et al. Interleukin-6 mediates angiotensinogen gene expression during liver regeneration. PLoS One. 2013;8:e67868. doi: 10.1371/journal.pone.0067868. [DOI] [PMC free article] [PubMed] [Google Scholar]
- Lawrence T. The nuclear factor NF-kappaB pathway in inflammation. Cold Spring Harb Perspect Biol. 2009;1:a001651. doi: 10.1101/cshperspect.a001651. [DOI] [PMC free article] [PubMed] [Google Scholar]
- Lin H, Joehanes R, Pilling LC, Dupuis J, Lunetta KL, Ying SX et al (2014) Whole blood gene expression and interleukin-6 levels. Genomics [DOI] [PMC free article] [PubMed]
- Lopez-Otin C, Blasco MA, Partridge L, Serrano M, Kroemer G. The hallmarks of aging. Cell. 2013;153:1194–1217. doi: 10.1016/j.cell.2013.05.039. [DOI] [PMC free article] [PubMed] [Google Scholar]
- Marttila S, Jylhava J, Nevalainen T, Nykter M, Jylha M, Hervonen A, et al. Transcriptional analysis reveals gender-specific changes in the aging of the human immune system. PLoS One. 2013;8:e66229. doi: 10.1371/journal.pone.0066229. [DOI] [PMC free article] [PubMed] [Google Scholar]
- Marttila S, Kananen L, Hayrynen S, Jylhava J, Nevalainen T, Hervonen A, et al. Ageing-associated changes in the human DNA methylome: genomic locations and effects on gene expression. BMC Genomics. 2015;16:179. doi: 10.1186/s12864-015-1381-z. [DOI] [PMC free article] [PubMed] [Google Scholar]
- Meda F, Folci M, Baccarelli A, Selmi C. The epigenetics of autoimmunity. Cell Mol Immunol. 2011;8:226–236. doi: 10.1038/cmi.2010.78. [DOI] [PMC free article] [PubMed] [Google Scholar]
- Miller AT, Berg LJ. New insights into the regulation and functions of Tec family tyrosine kinases in the immune system. Curr Opin Immunol. 2002;14:331–340. doi: 10.1016/S0952-7915(02)00345-X. [DOI] [PubMed] [Google Scholar]
- Morrisette-Thomas V, Cohen AA, Fulop T, Riesco E, Legault V, Li Q, et al. Inflamm-aging does not simply reflect increases in pro-inflammatory markers. Mech Ageing Dev. 2014;139:49–57. doi: 10.1016/j.mad.2014.06.005. [DOI] [PMC free article] [PubMed] [Google Scholar]
- Pawelec G, Goldeck D, Derhovanessian E. Inflammation, ageing and chronic disease. Curr Opin Immunol. 2014;29:23–28. doi: 10.1016/j.coi.2014.03.007. [DOI] [PubMed] [Google Scholar]
- Pidsley R, Y Wong CC, Volta M, Lunnon K, Mill J, Schalkwyk LC (2013) A data-driven approach to preprocessing Illumina 450K methylation array data. BMC Genomics 14, 293. doi:10.1186/1471-2164-14-293 [DOI] [PMC free article] [PubMed]
- Salvioli S, Capri M, Valensin S, Tieri P, Monti D, Ottaviani E, et al. Inflamm-aging, cytokines and aging: state of the art, new hypotheses on the role of mitochondria and new perspectives from systems biology. Curr Pharm Des. 2006;12:3161–3171. doi: 10.2174/138161206777947470. [DOI] [PubMed] [Google Scholar]
- Schnabel RB, Yin X, Larson MG, Yamamoto JF, Fontes JD, Kathiresan S, et al. Multiple inflammatory biomarkers in relation to cardiovascular events and mortality in the community. Arterioscler Thromb Vasc Biol. 2013;33:1728–1733. doi: 10.1161/ATVBAHA.112.301174. [DOI] [PMC free article] [PubMed] [Google Scholar]
- Singh T, Newman AB. Inflammatory markers in population studies of aging. Ageing Res Rev. 2011;10:319–329. doi: 10.1016/j.arr.2010.11.002. [DOI] [PMC free article] [PubMed] [Google Scholar]
- Steensberg A, Fischer CP, Keller C, Moller K, Pedersen BK. IL-6 enhances plasma IL-1ra, IL-10, and cortisol in humans. Am J Physiol Endocrinol Metab. 2003;285:E433–E437. doi: 10.1152/ajpendo.00074.2003. [DOI] [PubMed] [Google Scholar]
- Teschendorff AE, Marabita F, Lechner M, Bartlett T, Tegner J, Gomez-Cabrero D, et al. A beta-mixture quantile normalization method for correcting probe design bias in Illumina Infinium 450 k DNA methylation data. Bioinformatics. 2013;29:189–196. doi: 10.1093/bioinformatics/bts680. [DOI] [PMC free article] [PubMed] [Google Scholar]
- Vannahme C, Schubel S, Herud M, Gosling S, Hulsmann H, Paulsson M, et al. Molecular cloning of testican-2: defining a novel calcium-binding proteoglycan family expressed in brain. J Neurochem. 1999;73:12–20. doi: 10.1046/j.1471-4159.1999.0730012.x. [DOI] [PubMed] [Google Scholar]
- Wang GC, Casolaro V. Immunologic changes in frail older adults. Transl Med UniSa. 2014;9:1–6. [PMC free article] [PubMed] [Google Scholar]
- Wei J, Xu H, Davies JL, Hemmings GP. Increase of plasma IL-6 concentration with age in healthy subjects. Life Sci. 1992;51:1953–1956. doi: 10.1016/0024-3205(92)90112-3. [DOI] [PubMed] [Google Scholar]
- Woods ML, Kivens WJ, Adelsman MA, Qiu Y, August A, Shimizu Y. A novel function for the Tec family tyrosine kinase Itk in activation of beta 1 integrins by the T-cell receptor. EMBO J. 2001;20:1232–1244. doi: 10.1093/emboj/20.6.1232. [DOI] [PMC free article] [PubMed] [Google Scholar]
Associated Data
This section collects any data citations, data availability statements, or supplementary materials included in this article.
Supplementary Materials
Characterization of the cell populations used for the adjustment of the beta regression in nonagenarian men (n = 31). (.doc) (DOC 31 kb)
Characterization of plasma IL-6 levels in nonagenarian men (n = 43) and women (n = 101) who had gene expression data available. (.doc) (DOC 35 kb)