Abstract
Background
Studies using isolated sinoatrial node (SAN) cells indicate that rhythmic spontaneous sarcoplasmic reticulum calcium release (Ca clock) plays an important role in SAN automaticity. In the intact SAN, cross contamination of optical signals from the SAN and the right atrium (RA) prevented the definitive testing of Ca clock hypothesis. The aim of this study was to use a novel approach to selectively map intact SAN to examine the Ca clock mechanism.
Methods and Results
We simultaneously mapped intracellular Ca (Cai) and membrane potential (Vm) in 10 isolated, Langendorff-perfused normal canine RAs. The excitability of the RA was suppressed with high potassium Tyrode’s solution, allowing selective optical mapping of Vm and Cai of the SAN. Isoproterenol (ISO, 0.03 µmol/L) decreased cycle length of the sinus beats, and shifted the leading pacemaker site from the middle or inferior SAN to the superior SAN in all RAs. The Cai upstroke preceded the Vm in the leading pacemaker site by up to 18±2 ms. ISO-induced changes to SAN were inhibited by ryanodine (3 µmol/L), but not ZD7288 (3 µmol/L), a selective If blocker.
Conclusions
We conclude that, in isolated canine right atrium, high extracellular potassium concentration can suppress atrial excitability thus leading to SAN-RA conduction block, allowing selective optical mapping of the intact SAN. Acceleration of calcium cycling in the superior SAN underlies the mechanism of sinus tachycardia during sympathetic stimulation.
Keywords: calcium, nervous system, sympathetic, potassium, sarcoplasmic reticulum, sinoatrial node
Introduction
Among the many techniques that have been used to measure the sinoatrial node (SAN) function, optical mapping appears to be ideal for visualizing activation and propagation in intact multicellular and multilayered SAN. However, because of the cross contamination of the optical signals from the SAN and the surrounding right atrium (RA), data interpretation remains a significant challenge. A recently published article1 highlights the many technical difficulties associated with optical mapping of the intact SAN. We2 previously showed in intact canine SAN that the heart rate acceleration induced by β-adrenergic stimulation is primarily dependent on sarcoplasmic reticulum (SR) calcium release (or Ca clock),3–6 and to a lesser extent on the activation of pacemaker current (If). Our modeling study also demonstrated that the SR Ca2+ cycling rate is a major determinant of SAN automaticity.7 If current is a major component of the “membrane clock” that involves multiple membrane ionic currents to initiate SAN depolarization.5 The Ca and membrane clocks work synergistically to provide a robust pacemaking mechanism. Deficiency in both clocks in normal or diseased hearts can cause sinus node dysfunction.8 However, optical signals of the SAN and RA overlap with each other because the canine SAN is a 3 dimensional structure.1, 9 Therefore, in spite of our findings, the mechanisms of SAN acceleration during sympathetic stimulation remain controversial. It is highly desirable to develop a method to selectively map the SAN in intact canine RA preparation. As has been shown previously, when extracellular potassium concentration is increased, the propagation in the atrial myocytes progressively decreases whereas the cells in specialized conduction system remain active.10,11–13 When SAN activation and RA activations are separated, the SAN can be selectively mapped. The purposes of the present study are (1) To establish a selective optical mapping technique of SAN in intact RA by increasing the extracellular potassium concentration in the perfusate; and (2) To reevaluate the previous result2 that Ca clock underlies the mechanism of SAN rate acceleration during sympathetic stimulation using the selective SAN mapping technique.
Methods
Langendorff-perfused canine SAN preparation
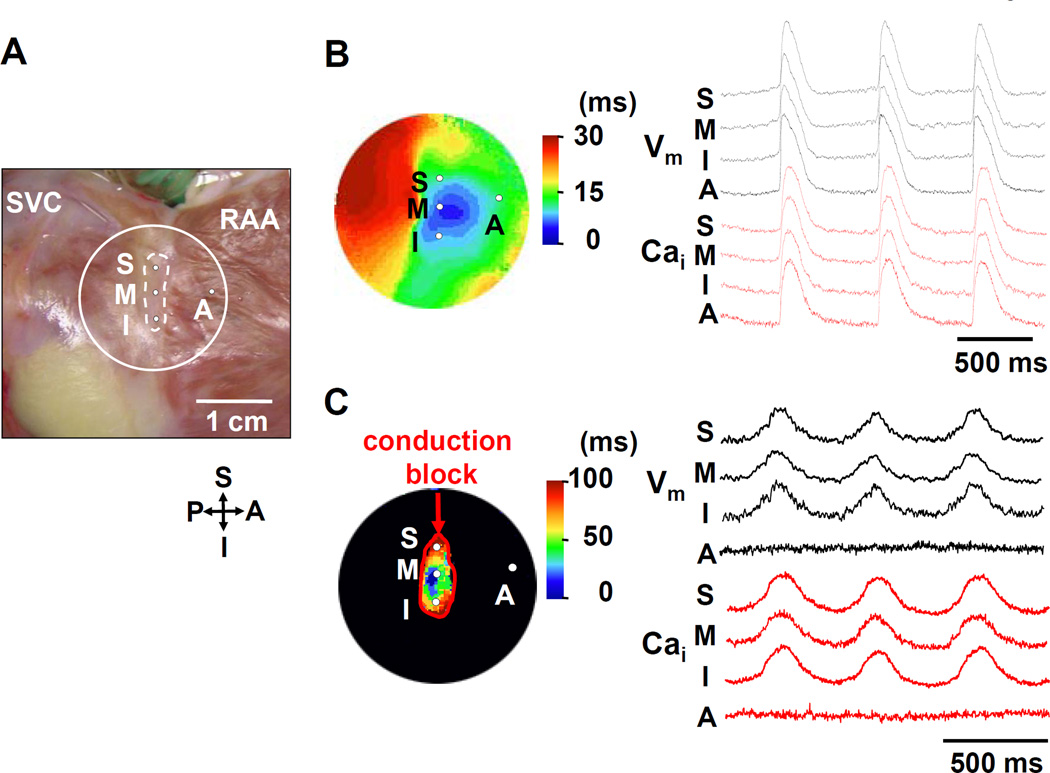
This study protocol was approved by the Institutional Animal Care and Use Committee of Indiana University School of Medicine and the Methodist Research Institute, and conforms to the guidelines of the American Heart Association. We studied isolated canine RAs in 12 male mongrel dogs weighing 22 to 28 kg. The dogs were anesthetized with pentobarbital (30 mg/Kg IV) followed by isoflurane inhalation anesthesia. A median sternotomy was performed and the heart was rapidly excised. The right coronary artery was perfused with 37°C Tyrode’s solution equilibrated with 95% O2 and 5% CO2 to maintain a PH of 7.4. The composition of Tyrode's solution was (in mmol/L): 125 NaCl, 4.5 KCl, 0.25 MgCl2, 24 NaHCO3, 1.8 NaH2PO4, 1.8 CaCl2, and 5.5 glucose. The coronary perfusion pressure was regulated between 50 and 60 mm Hg. To ensure adequate atrial perfusion, all ventricular coronary branches were tied off. Both ventricles and left atrium were removed. The SAN structure is subepicardial in dogs,14 therefore we mapped the epicardial side of the tissue (Figure 1A). The SAN area was located posterior to the sulcus terminalis. Contractility was inhibited by 10 to 17 µmol/L of blebbistatin, and the motion artifact was negligible even after isoproterenol (ISO) infusion.
Figure 1. Complete loss of RA excitability.
A: Photo of the isolated RA preparation showing the SAN (within dotted lines) and surrounding RA. The encircled area corresponds to isochronal map field in B and C. B: Activation pattern with normal potassium concentration (4.5 mmol/L). The color picture shows an isochronal map. The Vm (black) and Cai (red) recordings from the superior (S), middle (M), inferior (I) SAN, and RA (A) are presented. C: Activation pattern of SAN and surrounding RA when perfused with 10 mmol/L potassium Tyrode’s solution. A red line indicates the conduction block. Note there is no optical signal at the RA site. RAA = right atrial appendage; SVC = superior vena cava.
Dual Vm and Cai Recordings
Simultaneous membrane potential (Vm) and intracellular calcium (Cai) mapping was performed using previously described techniques.2 The hearts were stained with Rhod-2 AM and RH237 (Molecular Probes, Eugene, Ore) and excited with laser light at 532 nm. Fluorescence from the Rhod-2 (580±20 nm) and RH237 (>715 nm) was separated with a dichroic mirror (center wavelength 650 nm) and collected with 2 cameras (MiCAM Ultima, Brain Vision, Tokyo, Japan) at 1 ms/frame and 100 × 100 pixels with spatial resolution of 0.35 × 0.35 mm2/pixel. After dual Vm and Cai optical mapping of baseline spontaneous heart beats, we increased the potassium concentration in the Tyrode’s solution to 10 mmol/L. Pharmacological intervention was then performed with ISO 0.01 to 0.1 µmol/L (N=6). Furthermore, we examined the effects of ISO in the presence of ryanodine (3 µmol/L), the SR Ca release inhibitor (N=4), or received ZD 7288 (3 µmol/L), a selective If blocker (N=5).15
Data analysis
The Cai and Vm traces were normalized to their respective peak-to-peak amplitude for comparison in timing and morphology. Isochronal maps were generated using 50% of the peak amplitude as the activation time. Data were expressed as the mean ± SEM. Statistical analysis was performed using paired Student’s t-test, or one-way analyses of variance (ANOVA) with Bonferroni’s post hoc analysis. A p value of ≤ 0.05 was considered significant.
Results
Suppression of RA Excitability
Figure 1B shows a typical activation pattern of the SAN and surrounding RA during baseline recording with normal potassium (4.5 mmol/L) concentration. The electric activity promptly propagated from the SAN to RA. In 3 preliminary studies, we tried to cause the exit block from SAN with the long-term (10 min) pacing as previously reported.9 However, conduction block could not be reliably induced in these studies. Alternatively, tetrodotoxin (TTX) treatment could potentially inhibit the sodium current (INa) and RA activation while maintain the SAN function. We used 1, 5 and 10 µM TTX in 2 preliminary experiments. TTX at 1 and 5 µM did not inhibit conduction in either RA or SAN, hence the respective activation in these regions could not be separated. However, at 10 µM of TTX, no activations were observed in either the RA or the SAN. Therefore, we tested the efficacy of high potassium concentration (10 mmol/L) in causing SAN-RA block. The results showed that conduction block from the SAN to the surrounding RA (Figure 1C) was reliably induced by suppressing the RA excitability in all 10 preparations. The leading pacemaker sites were located in the middle and inferior SANs in 5 and 5 preparations, respectively. Conduction velocity within the SAN was slow (105±12 mm/s). The Cai upstroke in the leading pacemaker site occurred simultaneously with the action potential upstroke.
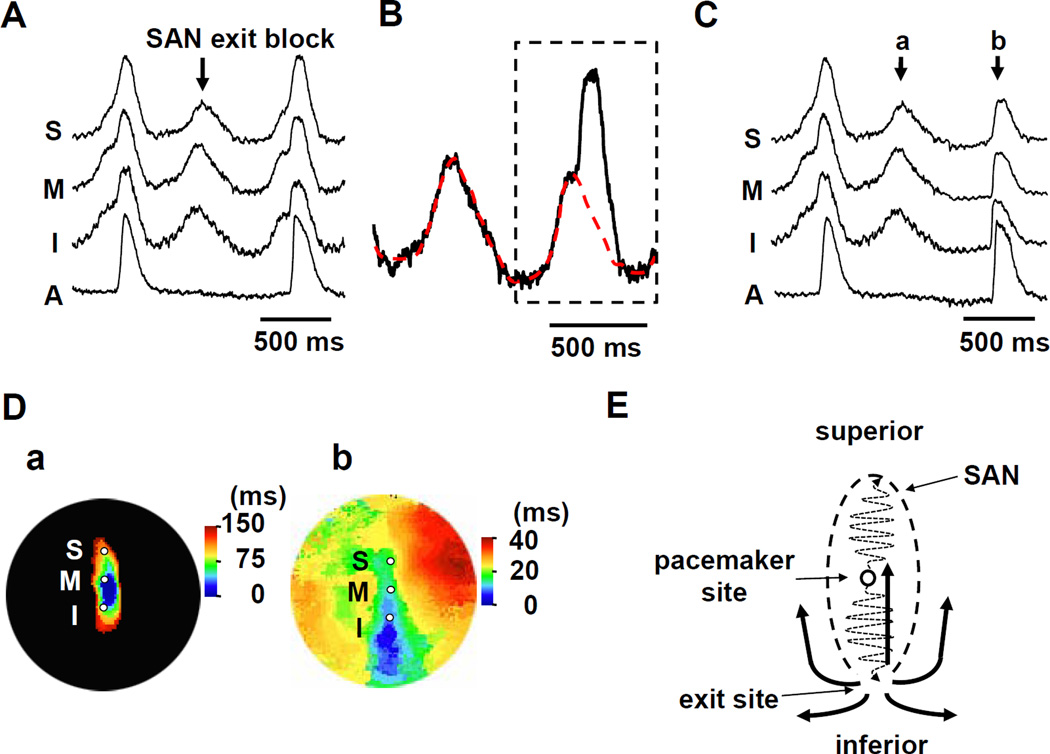
Intermittent SAN exit block was occasionally observed (Figure 2A; Supplemental movie I) during the initial period of high potassium Tyrode’s infusion. The intermittent exit block offered the opportunity to numerically separate the SAN and overlapping RA signals assuming that the recorded fluorescence is a linear summation of light coming from the SAN and RA. The separated SAN and RA signals were then used for visualization of electrical conduction in these layers. The last beat of Figure 2A includes both the RA and SAN optical signals. In Figure 2B, we assumed that the SAN signals in two beats have the same time-course. We first subtracted SAN signal (dotted red line in Figure 2B) from the combined signals to estimate the pure RA signal (Figure 2C, beat b; Supplemental movie II). We then separately constructed isochronal maps of beat 2Ca and 2Cb, and displayed them in Figure 2D(a) and 2D(b), respectively. The electric activity propagated slowly within the SAN (Figure 2D(a)), and exited from the inferior SAN to RA (blue region, Figure 2D(b)). It then propagated in all directions, including the RA tissues that overlap with the SAN, and promptly activated the entire RA (Figure 2D(b)). The width of the optical action potentials from the SAN (Figure 2Ca) averaged 420±26 ms for all dogs studies, which was significantly wider than the width of the RA signals (Figure 2Cb) (206±20 ms, P<0.001). Figure 2E shows a schematic of the RA propagation that initiated from the inferior SAN-RA junction. The activation of the pacemaker started from the center of the SAN, propagated to both end of the SAN structure, and exit at the inferior end. The electrical activity that propagated through the overlaying RA tissue gave rise to the second upstroke of the action potential as shown in Figure 2B. The intermittent SAN exit block was a transient phenomenon only observed before a stable condition was achieved with high potassium perfusion. After more than 10-minute of perfusion, only SAN signal remained in the optical recordings.
Figure 2. Intermittent RA activation.
A: The Vm recordings from the superior (S), middle (M), inferior (I) SAN, and RA (A) are presented. B: Magnified view of Vm tracing in the leading pacemaker site (middle SAN). The Vm signal surrounded by the dotted black line shows the overlapping signal of SAN and RA. The red dotted line indicates the putative SAN signal obtained from previous isolated SAN activation. C: This view shows the selective RA signals (b) after subtracting the SAN signals (a). D: The a and b panels show the isochronal maps of beats a and b in C, respectively. E: The schema of the conduction from the SAN to surrounding RA. SAN = sinoatrial node.
Effects of β-adrenergic stimulation
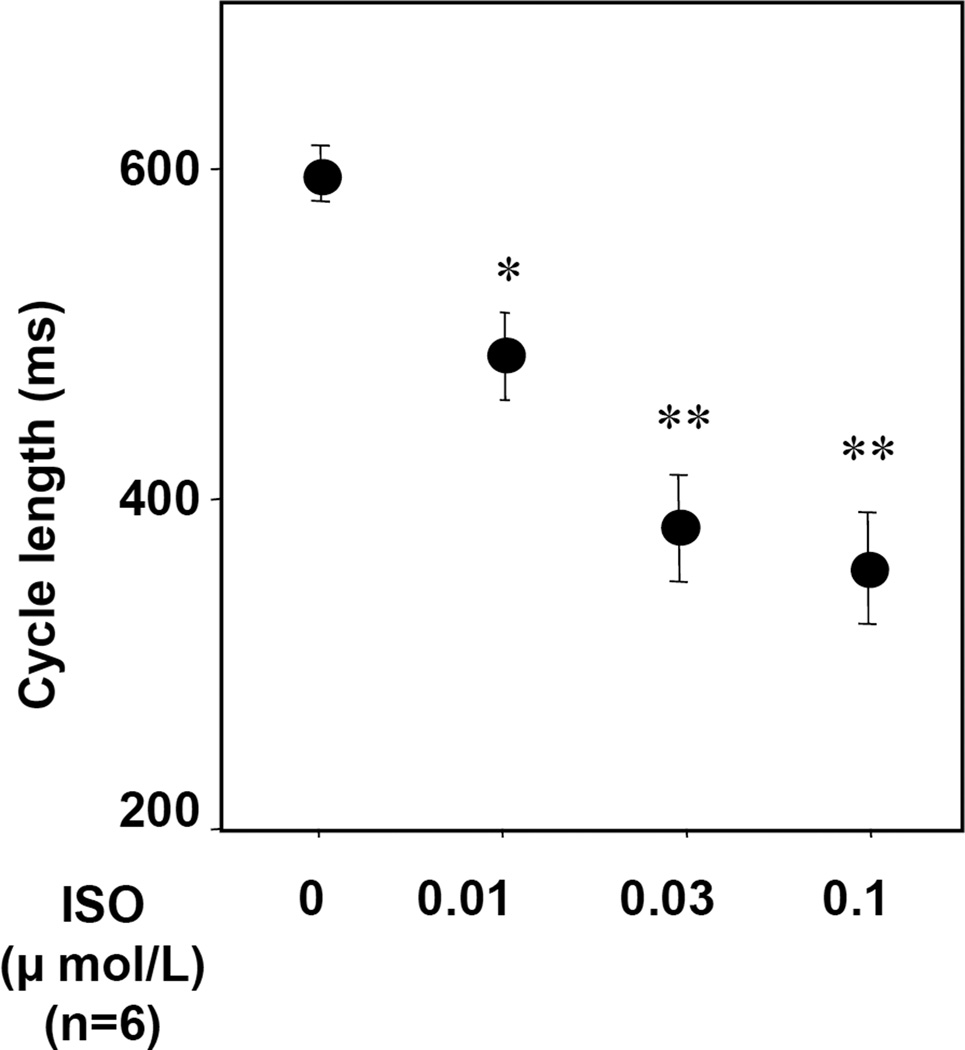
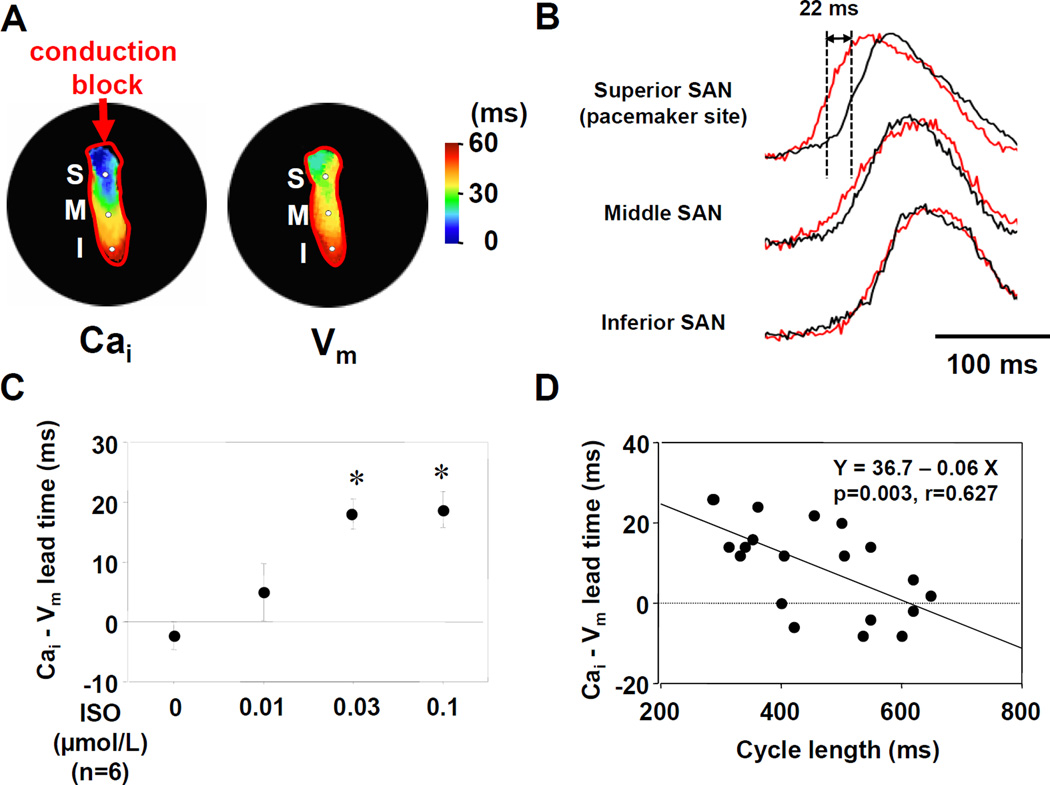
Figure 3 shows the dose-response curves of cycle length to ISO in the preparations with high potassium Tyrode’s solution. ISO dose-dependently decreased cycle length (387±34 ms at 0.03 µmol/L, N=6, P<0.001). ISO infusion shifted the leading pacemaker site to the superior SAN in all preparations with high potassium Tyrode’s solution (Figure 4A). The Cai activation proceded the Vm activation in the leading pacemaker site (superior SAN). We calculated the lead time of Cai upstroke to action potential upstroke using 50% of the peak amplitude in each optical signal. The Cai upstroke preceded the Vm upstroke in the leading pacemaker site (superior SAN), while in inferior SAN the Cai upstroke did not precede the Vm upstroke (Figure 4B). The lead time of Cai upstroke to action potential upstroke increased dose-dependently with ISO infusion (18±2 ms at ISO 0.03 µmol/L, N=6, P<0.01, Figure 4C). Figure 4D shows the interaction between cycle length and the lead time of Cai upstroke in the leading pacemaker site. The lead time of Cai upstroke was well correlated with the shortening of cycle length during increasing doses of ISO infusion.
Figure 3. Change of cycle length by isoproterenol infusion with high potassium Tyrode’s solution.
Isoproterenol treatment dose-dependently decreases cycle length. *P<0.01 and **P<0.001 vs. baseline. ISO = isoproterenol.
Figure 4. Effect of isoproterenol on the activation pattern of SAN.
A: Selective SAN isochronal maps during isoproterenol (ISO, 0.03 µmol/L) infusion. The left and right panels show Cai and Vm isochronal activation maps, respectively. B: Upper panel shows the magnified view of Cai (red) and Vm (black) tracings at the leading pacemaker site (superior SAN) with 0.03 µmol/L ISO. The Cai upstroke precedes the Vm upstroke (by 22 ms) at superior SAN but not at middle and inferior SAN. C: The lead time of Cai upstroke to action potential upstroke. *P<0.01 vs. baseline. D: The interaction between cycle length and the lead time of Cai upstroke at the leading pacemaker site.
The effect of SR Ca release inhibitor to β-adrenergic stimulation
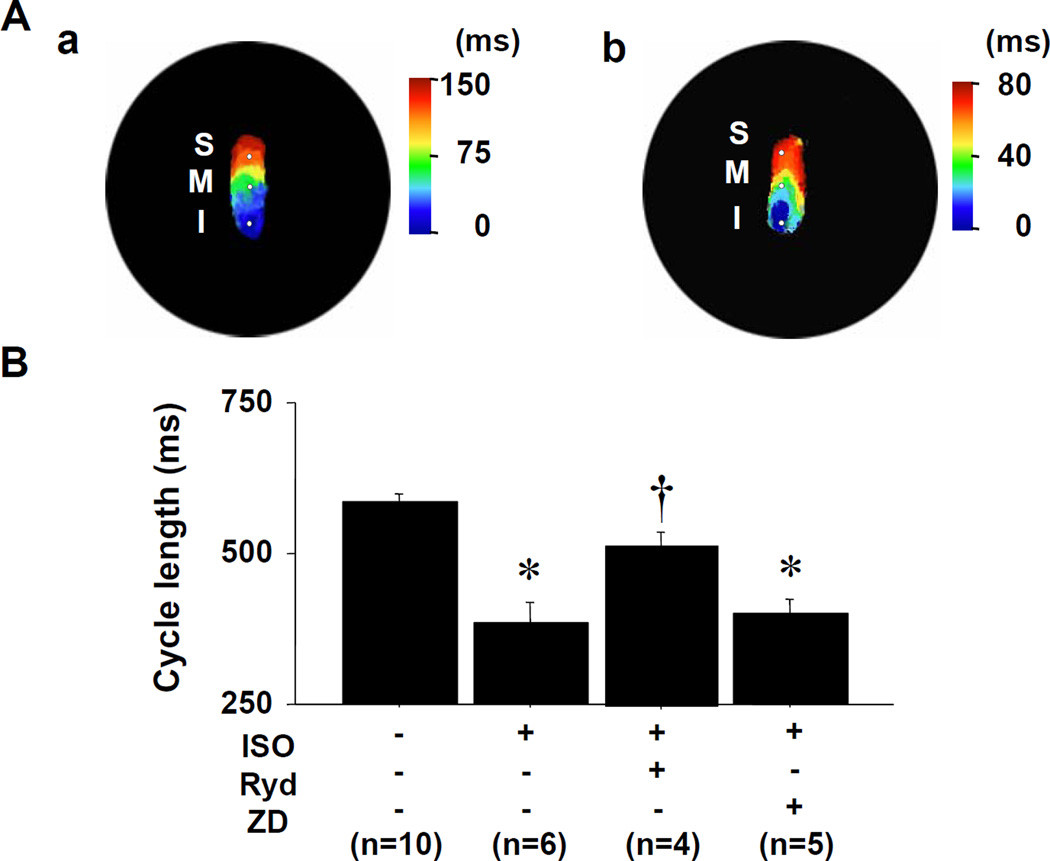
If the stimulation of Ca clock causes a shift of the leading pacemaker site to the superior SAN and cycle length shortening, then agents that interfere with SR Ca release should suppress these phenomena. Figure 5A shows isochronal maps before (Figure 5A(a)) and during ISO infusion (Figure 5A(b)) in the preparation with the pretreatment of ryanodine (3 µmol/L), the SR Ca release inhibitor. After 20-minutes pretreatment of the tissue with ryanodine (3 µmol/L), ISO infusion no longer resulted in shift of the pacemaking site to the superior SAN in all preparations perfused with high-potassium Tyrode’s solution (Figure 5A(b)). Ryanodine (3 µmol/L) or ZD7288 (3 µmol/L) treatment increased cycle length in SAN with same degree (608±23 to 638±25 ms and 609±22 to 631±23 ms, respectively). Figure 5B shows that the effects of ryanodine (Ryd) and ZD7288 (ZD) on ISO-induced the cycle length shortening in the SAN. Pretreatment of the tissue with ryanodine inhibited the ISO-induced cycle length shortening (N=4), while pretreatment with ZD7288, a selective If blocker, did not significantly influence the cycle length (N=5).
Figure 5. Effect of ryanodine in the preparations with high potassium Tyrode’s solution.
A: Isochronal maps during ryanodine infusion of 3 µmol/L. (a) without isoproterenol (ISO). (b) ISO infusion. B: The changes of cycle length in SAN by the treatments of ISO (0.03 µmol/L), ryanodine (Ryd, 3 µmol/L), and ZD7288 (ZD, 3 µmol/L). *P<0.001 vs. baseline. †P<0.01 vs. ISO treatment.
Microelectrode Recording
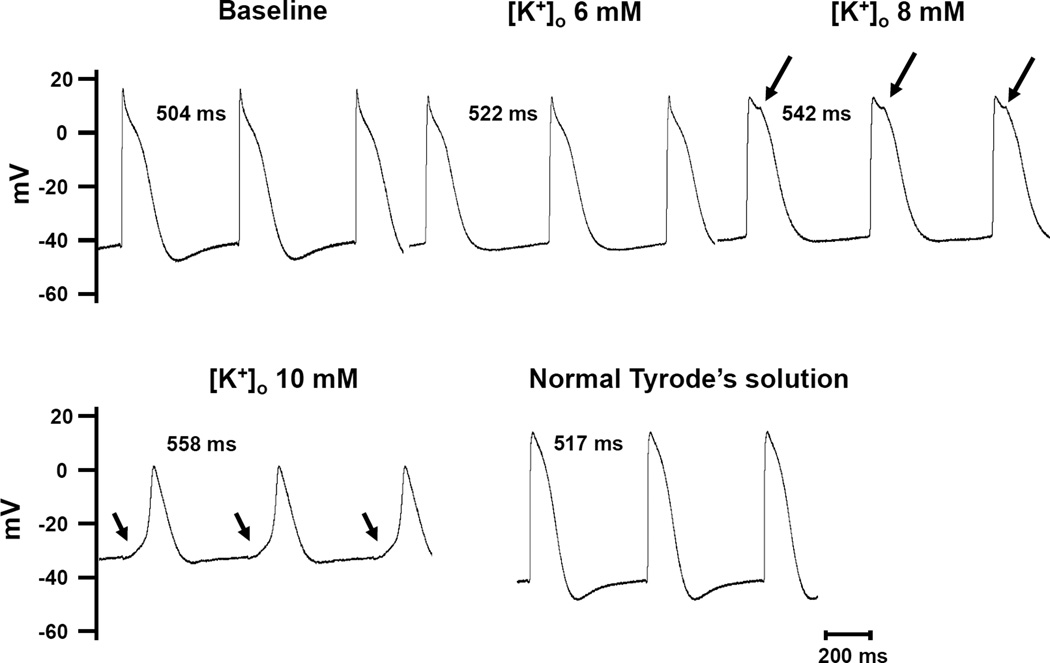
In additional 2 dog hearts, we used glass microelectrode to record transmembrane potential from cells in intact SAN. In both studies, there was progressive reduction of action potential amplitude with the increasing [K+]o. However, spontaneous phase 4 depolarization was present both at baseline and during infusion of high potassium Tyrode’s solution. Figure 6 shows an example of the recording from an isolated RA. The microelectrode was inserted into the SAN region. From the morphology of the action potentials, it is likely that the electrode did not directly impale a SAN cell, but rather it was positioned in the SAN-RA transition or border zone. It has been demonstrated that the SAN-RA dissociation can be observed in this area.1, 16 The SAN-RA dissociation started at 8 mM [K+]o(arrows). At 10 mM [K+]o, the RA was fully depolarized, leaving only activations of the SAN cells. There was a smooth transition between the phase 4 and phase 0 (arrows in the lower panels), suggesting that the recording was made at or near the origin of the pacemaking cell in the SAN in this preparation. After the resumption of the normal Tyrode’s solution, the action potential amplitude and diastolic potential normalized. The tracings from both figures were obtained continuously with the microelectrode stably impaled in the same cell. No adjustment in depth or location was made during these recordings. In both preparations, the action potential in the SAN region at 10 mM [K+]o had a slow upstroke and exhibited a symmetrical morphology similar to the optical potentials as shown in Figure 1. Therefore, the selective mapping technique can reproduce optical potentials with similar morphology of action potentials obtained with microelectrode intracellular recording. Furthermore, the mapping results are useful for investigating the shift of early activation site due to β-stimulation.
Figure 6. Microelectrode recording of SAN-RA transition zone.
The microelectrode was inserted in the SAN region near the SAN-RA border. Note that when the [K+]o was at 8 mM, there were notches (arrows) on the action potential, indicating the beginning of SAN-RA separation. The separation was complete at 10 mM of [K+]o, leading to isolated SAN activation. There was a smooth transition between phase 4 and the next phase 0 on the action potential (arrows). The action potential normalized when normal Tyrode’s solution was used.
Discussion
We conclude that it is feasible to perform selective SAN mapping in isolated canine right atrium by increasing extracellular potassium concentration. The results show that optical signals from the SAN can be effectively separated from that of RA with high potassium perfusion, and the dominant pacemaking cite moves to the superior SAN region with β-stimulation under high extracellular potassium. Data from the selective mapping technique also confirm previous results from intact RA that (1) ISO shortened the cycle length of SAN activation and shifted the leading pacemaker site to the superior SAN; (2) The Cai upstroke preceded action potential upstroke during ISO infusion; and (3) The effects of ISO were inhibited by pretreatment of ryanodine but not ZD7288. Taken together, these findings indicate that Ca clock underlies the mechanisms of SAN rate acceleration during β-adrenergic stimulation.
Technical Difficulties in SAN mapping
The primary technical difficulty is that the optical signals may originate from both the SAN and RA. Because of the overlapping optical signals, the authors propose that studies in intact SAN have not conclusively supported the Ca clock hypothesis.1 That manuscript contained a study involving 3 intact RA preparations. The authors found that in all 3 experiments, both the voltage and calcium optical signals from SAN region contain 2 upstrokes during normal sinus rhythm. Both upstroke components of voltage optical traces preceded calcium upstrokes by 7 to 20 ms. The authors implied that these results are inconsistent with the Ca clock mechanism of SAN automaticity. However, these results were in fact consistent with that found by Joung et al,2 who showed little or no late diastolic Ca elevation (LDCAE) before ISO infusion. However, after ISO infusion, LDCAE consistently occurred prior to the onset of membrane voltage signals. Nevertheless, because of the report by Efimov et al,1 the importance of Ca clock in SAN rate acceleration remains controversial.
Methods to Overcome the Difficulties of SAN Mapping
Recognizing that the optical signals from intact RA could originate from multiple sources, Fedorov et al9 proposed to decompose the SAN-RA signals using amplitude and signal derivatives as determining factors for separating the individual components. They also used rapid atrial pacing to depress SAN-RA conduction and to separate optical signals from SAN and RA. The latter method allowed them to separately map the SAN and RA signals. However, rapid pacing can lead to SAN suppression, and the beat following the long pause may potentially come from ectopic origins. In addition, the use of endocardial mapping might have contributed to the reduced amplitudes of the optical signal from the SAN in that study. We therefore took a different approach to selectively map the SAN. It is known since at least 196017 that in isolated rabbit RA, specialized fibers in the SAN, atrioventricular node and latent pacemakers in the crista terminalis are less sensitive to excess potassium than atrial muscle fibers. When KCl concentration in the Tyrode’s solution was increased, the propagation in the atrial myocytes progressively decreased while the SAN cells remain active. Complete cessation of atrial propagation in their studies occurred at 13.5 mmol/L of KCl. Racker11 demonstrated that during exposure to 10 mmol/L extracellular potassium, atrial electrograms and atrial contractions ceased, indicating electrical quiescence of the contractile myocardium; however, the unique pattern of discharge of the atrioventricular junction structures persisted. We adopted this method to separate the activations of SAN from the RA. We also chose to map from the epicardium and not the endocardium. We found that while RA excitability was effectively suppressed by high extracellular potassium concentration, the Cai and Vm signals from the SAN were easily detectable. In addition, our epicardial mapping data indicate that the amplitudes of the SAN component and RA component of the optical signals were similar in amplitude. These findings suggest that selective optical mapping of intact canine SAN should preferably be done from the epicardium with high extracellular potassium concentration to suppress RA excitability.
Ca Clock and membrane ionic clock in the Intact SAN
The funny current (If) is known to play an important role in SAN automaticity.18 The If activates during hyperpolarization, which is mostly responsible for the initial portion of the spontaneous phase 4 depolarization. Mutation of the gene encoding If results in significant resting bradycardia, confirming that If is important in human SAN automaticity.19 However, the same patients are asymptomatic for bradycardia because their heart rate can adequately increase during exercise, sometimes reaching > 150 bpm. The latter data indicate that additional mechanisms may contribute to the SAN automaticity during β-adrenergic stimulation. Based on data from single isolated SAN cells and computer simulation studies, Lakatta et al5 proposed that a coupled system of intracellular Ca clock and surface membrane voltage clock controls the timekeeping mechanism of the SAN. Under such circumstances, β-adrenergic stimulation increases the phosphorylation level of calcium handling proteins, leading to increased local Ca release and acceleration of the SAN rate.
Due to the intimate coupling of many membrane currents and intracellular events leading to activation of the SAN cells, the mechanism of heart beat initiation has been controversial and under intense debate. Also for the same reason, mathematical modeling is considered a valuable tool allowing manipulation of individual parameters to dissect the mechanisms of SAN automaticity. An interesting recent study20 combined mathematical modeling and single cell recording to investigate the SAN automaticity under suppression of intracellular calcium cycling, and found that rapid disruption of calcium dynamics both in models and in experiment did not markedly change the SAN rhythm. Based on these observations, the authors argued that the Ca clock had only a minor contribution to the SAN rhythm in guinea pig SAN cells. However, such a view was later disputed from technical considerations.21 The ensuing debate22 further exemplifies the difficulty to study the contribution of individual component in SAN automaticity where multiple components are functionally coupled.
We2 used dual optical mapping techniques to study intact canine SAN. The results showed that during sympathetic stimulation, LDCAE occurs prior to the onset of action potential, leading to increased SAN rate. These findings support the hypothesis that Ca clock underlies the mechanisms of SAN rate acceleration during sympathetic stimulation in intact canine RA preparation. However, other investigators disagree with this conclusion. They propose that technical limitations have invalidated the conclusion of that study.1 The present study shows definitive evidence with selective SAN mapping that Cai preceded Vm in the superior SAN, thus confirms the enhanced Ca clock pacemaking function under β-adrenergic stimulation. During β-adrenergic stimulation, the leading pacemaker site shifted to the superior SAN along with dose-dependent rate acceleration. The inhibition of the SR Ca release by ryanodine consistently abolished the shifting of the leading pacemaking site and the acceleration of the SAN rate, while If blocking did not inhibit ISO-induced rate acceleration. These data confirm the findings of our previous study,2 and indicate that spontaneous SR Ca release is largely responsible for SAN rate acceleration during sympathetic stimulation.
Differential Effects of TTX and Hyperkalemia on SAN-RA Conduction Blocks
Canine SAN cells are known to have TTX-sensitive (non-cardiac form) INa.23 Due to a high resting membrane potential in the SAN, these TTX-sensitive INa does not contribute to normal automaticity in isolated adult cells. Therefore, the suppression of SAN activity by TTX in this study cannot be explained by INa suppression within the SAN. Rather, a more likely explanation is that INa suppression inhibited the depolarization of the surrounding RA, which in turn inhibited the SAN automaticity through electrotonic inhibition.24 Because both RA activation and SAN automaticity were suppressed, we could not use TTX to differentiate the RA and SAN activations. Unlike TTX, the effects of hyperkalemia on excitability are not purely inhibitory. In isolated human atrial cells, elevated extracellular potassium shifts the resting potential in the depolarizing direction and reduces input resistance by increasing an inwardly rectifying K+ conductance, IK1.25 While the membrane depolarization reduces the availability of INa, it also reduces the required depolarization current to reach threshold. Increased extracellular potassium therefore increases cellular excitability to short-duration stimuli but reduces excitability for long duration pulses.26 Through the modulation of IK1 rectification, elevated extracellular potassium concentration also alters the coupling conductance between SAN and the surrounding non-pace making myocardial cells. These effects may be significant factors in decreasing the excitability of the RA in elevated potassium in response to a long stimulus or to a long delay from the pacemaking focus in the SAN, causing dissociation between SAN and the RA.
Study Limitations
We suppressed the RA excitability and therefore blocked the conduction from the SAN to the surrounding RA using high potassium Tyrode’s solutions. High potassium concentration is not a physiological state, and may affect SAN function. Kim et al.12 reported that high potassium solution decreases spontaneous sinus rhythm in isolated guinea-pig SAN. In our experiments, however, high potassium solution did not significantly change the heart rate (108±15 bpm vs. 103±3 bpm, p=0.78) when the RA was perfused with Tyrode’s solution containing 10 mmol/L potassium concentration. The discrepancy in the high potassium effects on heart rate may be caused by different tissue perfusion methods between these studies.
Conclusions
We conclude that a high extracellular potassium concentration suppresses RA excitability, allowing selective optical mapping of the intact SAN. Acceleration of Ca cycling in the superior SAN underlies the mechanism of sinus tachycardia during sympathetic stimulation.
Acknowledgements
This study was supported in part by National Institutes of Health (NIH) grants P01 HL78931, R01 HL78932, 71140, a Japan Medtronic fellowship (MM), Medtronic-Zipes Endowments (PSC), and an AHA Established Investigator Award (SFL).
Abbreviations
- Cai
intracellular calcium
- ISO
isoproterenol
- LDCAE
late diastolic calcium elevation
- RA
right atrium
- SAN
sinoatrial node
- SR
sarcoplasmic reticulum
- TTX
tetrodotoxin
- Vm
membrane potential
Footnotes
Conflict of Interest: None
Disclosure
None.
References
- 1.Efimov IR, Fedorov VV, Joung B, Lin SF. Mapping cardiac pacemaker circuits: Methodological puzzles of the sinoatrial node optical mapping. Circ Res. 2010;106:255–271. doi: 10.1161/CIRCRESAHA.109.209841. [DOI] [PMC free article] [PubMed] [Google Scholar]
- 2.Joung B, Tang L, Maruyama M, Han S, Chen Z, Stucky M, Jones LR, Fishbein MC, Weiss JN, Chen PS, Lin SF. Intracellular calcium dynamics and acceleration of sinus rhythm by beta-adrenergic stimulation. Circulation. 2009;119:788–796. doi: 10.1161/CIRCULATIONAHA.108.817379. [DOI] [PMC free article] [PubMed] [Google Scholar]
- 3.Lakatta EG, Vinogradova T, Lyashkov A, Sirenko S, Zhu W, Ruknudin A, Maltsev VA. The integration of spontaneous intracellular ca2+ cycling and surface membrane ion channel activation entrains normal automaticity in cells of the heart's pacemaker. Ann.N.Y.Acad.Sci. 2006;1080:178–206. doi: 10.1196/annals.1380.016. [DOI] [PubMed] [Google Scholar]
- 4.Maltsev VA, Lakatta EG. Dynamic interactions of an intracellular ca2+ clock and membrane ion channel clock underlie robust initiation and regulation of cardiac pacemaker function. Cardiovasc Res. 2008;77:274–284. doi: 10.1093/cvr/cvm058. [DOI] [PubMed] [Google Scholar]
- 5.Lakatta EG, Maltsev VA, Vinogradova TM. A coupled system of intracellular ca2+ clocks and surface membrane voltage clocks controls the timekeeping mechanism of the heart's pacemaker. Circ Res. 2010;106:659–673. doi: 10.1161/CIRCRESAHA.109.206078. [DOI] [PMC free article] [PubMed] [Google Scholar]
- 6.Chen PS, Joung B, Shinohara T, Das M, Chen Z, Lin SF. The initiation of the heart beat. Circ J. 2010;74:221–225. doi: 10.1253/circj.cj-09-0712. [DOI] [PubMed] [Google Scholar]
- 7.Zhang H, Joung B, Shinohara T, Mei X, Chen PS, Lin SF. Synergistic dual automaticity in sinoatrial node cell and tissue models. Circ J. 2010;74:2079–2088. doi: 10.1253/circj.cj-10-0265. [DOI] [PMC free article] [PubMed] [Google Scholar]
- 8.Joung B, Shinohara T, Zhang H, Kim D, Choi EK, On YK, Piccirillo G, Chen PS, Lin SF. Tachybradycardia in the isolated canine right atrium induced by chronic sympathetic stimulation and pacemaker current inhibition. Am J Physiol Heart Circ Physiol. 2010;299:H634–H642. doi: 10.1152/ajpheart.00347.2010. [DOI] [PMC free article] [PubMed] [Google Scholar]
- 9.Fedorov VV, Schuessler RB, Hemphill M, Ambrosi CM, Chang R, Voloshina AS, Brown K, Hucker WJ, Efimov IR. Structural and functional evidence for discrete exit pathways that connect the canine sinoatrial node and atria. Circ Res. 2009;104:915–923. doi: 10.1161/CIRCRESAHA.108.193193. [DOI] [PMC free article] [PubMed] [Google Scholar]
- 10.de Mello W, Hoffman BF. Potassium ions and electrical activity of specialized cardiac fibers. Am J Physiol. 1960;199:1125–1130. doi: 10.1152/ajplegacy.1960.199.6.1125. [DOI] [PubMed] [Google Scholar]
- 11.Racker DK. Sinoventricular transmission in 10 mm k+ by canine atrioventricular nodal inputs. Superior atrionodal bundle and proximal atrioventricular bundle. Circulation. 1991;83:1738–1753. doi: 10.1161/01.cir.83.5.1738. [DOI] [PubMed] [Google Scholar]
- 12.Kim EM, Choy Y, Vassalle M. Mechanisms of suppression and initiation of pacemaker activity in guinea-pig sino-atrial node superfused in high [k+]o. J Mol Cell Cardiol. 1997;29:1433–1445. doi: 10.1006/jmcc.1997.0382. [DOI] [PubMed] [Google Scholar]
- 13.Vassalle M, Catanzaro JN, Nett MP, Rota M. Essential role of diastolic oscillatory potentials in adrenergic control of guinea pig sino-atrial node discharge. J Biomed Sci. 2009;16:101. doi: 10.1186/1423-0127-16-101. [DOI] [PMC free article] [PubMed] [Google Scholar]
- 14.Woods WT, Urthaler F, James TN. Spontaneous action potentials of cells in the canine sinus node. Circ Res. 1976;39:76–82. doi: 10.1161/01.res.39.1.76. [DOI] [PubMed] [Google Scholar]
- 15.Baruscotti M, Bucchi A, Difrancesco D. Physiology and pharmacology of the cardiac pacemaker ("Funny") current. Pharmacol Ther. 2005;107:59–79. doi: 10.1016/j.pharmthera.2005.01.005. [DOI] [PubMed] [Google Scholar]
- 16.Bleeker WK, Mackaay AJ, Masson-Pevet M, Bouman LN, Becker AE. Functional and morphological organization of the rabbit sinus node. Circ Res. 1980;46:11–22. doi: 10.1161/01.res.46.1.11. [DOI] [PubMed] [Google Scholar]
- 17.Cao JM, Fishbein MC, Han JB, Lai WW, Lai AC, Wu TJ, Czer L, Wolf PL, Denton TA, Shintaku IP, Chen PS, Chen LS. Relationship between regional cardiac hyperinnervation and ventricular arrhythmia. Circulation. 2000;101:1960–1969. doi: 10.1161/01.cir.101.16.1960. [DOI] [PubMed] [Google Scholar]
- 18.DiFrancesco D. The role of the funny current in pacemaker activity. Circ Res. 2010;106:434–446. doi: 10.1161/CIRCRESAHA.109.208041. [DOI] [PubMed] [Google Scholar]
- 19.Nof E, Luria D, Brass D, Marek D, Lahat H, Reznik-Wolf H, Pras E, Dascal N, Eldar M, Glikson M. Point mutation in the hcn4 cardiac ion channel pore affecting synthesis, trafficking, and functional expression is associated with familial asymptomatic sinus bradycardia. Circulation. 2007;116:463–470. doi: 10.1161/CIRCULATIONAHA.107.706887. [DOI] [PubMed] [Google Scholar]
- 20.Himeno Y, Toyoda F, Satoh H, Amano A, Cha CY, Matsuura H, Noma A. Minor contribution of cytosolic ca2+ transients to the pacemaker rhythm in guinea pig sinoatrial node cells. American Journal of Physiology - Heart and Circulatory Physiology. 2011;300:H251–H261. doi: 10.1152/ajpheart.00764.2010. [DOI] [PubMed] [Google Scholar]
- 21.Maltsev VA, Vinogradova TM, Stern MD, Lakatta EG. Letter to the editor: "Validating the requirement for beat-to-beat coupling of the ca2+ clock and m clock in pacemaker cell normal automaticity". Am J Physiol Heart Circ Physiol. 2011;300:H2323–2324. doi: 10.1152/ajpheart.00110.2011. author reply H2325-2326. [DOI] [PMC free article] [PubMed] [Google Scholar]
- 22.Himeno Y, Toyoda F, Matsuura H, Noma A. Reply to “letter to the editor: ‘validating the requirement for beat-to-beat coupling of the ca2+ clock and m clock in pacemaker cell normal automaticity'”. American Journal of Physiology - Heart and Circulatory Physiology. 2011;300:H2325–H2326. doi: 10.1152/ajpheart.00110.2011. [DOI] [PMC free article] [PubMed] [Google Scholar]
- 23.Protas L, Oren RV, Clancy CE, Robinson RB. Age-dependent changes in na current magnitude and ttx-sensitivity in the canine sinoatrial node. J Mol Cell Cardiol. 2010;48:172–180. doi: 10.1016/j.yjmcc.2009.07.028. [DOI] [PMC free article] [PubMed] [Google Scholar]
- 24.Butters TD, Aslanidi OV, Inada S, Boyett MR, Hancox JC, Lei M, Zhang H. Mechanistic links between na+ channel (scn5a) mutations and impaired cardiac pacemaking in sick sinus syndrome. Circ Res. 2010;107:126–137. doi: 10.1161/CIRCRESAHA.110.219949. [DOI] [PMC free article] [PubMed] [Google Scholar]
- 25.Nygren A, Clark RB, Belke DD, Kondo C, Giles WR, Witkowski FX. Voltage-sensitive dye mapping of activation and conduction in adult mouse hearts. Ann Biomed Eng. 2000;28:958–967. doi: 10.1114/1.1308501. [DOI] [PubMed] [Google Scholar]
- 26.Wagner MB, Golod D, Wilders R, Verheijck EE, Joyner RW, Kumar R, Jongsma HJ, Van Ginneken AC, Goolsby WN. Modulation of propagation from an ectopic focus by electrical load and by extracellular potassium. Am J Physiol. 1997;272:H1759–H1769. doi: 10.1152/ajpheart.1997.272.4.H1759. [DOI] [PubMed] [Google Scholar]


