Significance
Over one-half of all vertebrate species are ray-finned fishes. Across this extraordinary diversity, the most common feeding mode is suction feeding: rapid expansion of the mouth to suck in water and food. Here, we find that the power required for suction expansion is generated primarily by the axial swimming muscles. Rather than being restricted to the low power capacity of the small cranial muscles, suction-feeding fishes have co-opted the massive swimming muscles for this powerful feeding behavior. Therefore, the evolution of axial muscles in ray-finned fishes should now be considered in the context of feeding as well as locomotion, changing our perspective on musculoskeletal form and function in over 30,000 species.
Keywords: epaxial, hypaxial, XROMM, muscle power, volume
Abstract
Most aquatic vertebrates use suction to capture food, relying on rapid expansion of the mouth cavity to accelerate water and food into the mouth. In ray-finned fishes, mouth expansion is both fast and forceful, and therefore requires considerable power. However, the cranial muscles of these fishes are relatively small and may not be able to produce enough power for suction expansion. The axial swimming muscles of these fishes also attach to the feeding apparatus and have the potential to generate mouth expansion. Because of their large size, these axial muscles could contribute substantial power to suction feeding. To determine whether suction feeding is powered primarily by axial muscles, we measured the power required for suction expansion in largemouth bass and compared it to the power capacities of the axial and cranial muscles. Using X-ray reconstruction of moving morphology (XROMM), we generated 3D animations of the mouth skeleton and created a dynamic digital endocast to measure the rate of mouth volume expansion. This time-resolved expansion rate was combined with intraoral pressure recordings to calculate the instantaneous power required for suction feeding. Peak expansion powers for all but the weakest strikes far exceeded the maximum power capacity of the cranial muscles. The axial muscles did not merely contribute but were the primary source of suction expansion power and generated up to 95% of peak expansion power. The recruitment of axial muscle power may have been crucial for the evolution of high-power suction feeding in ray-finned fishes.
Muscles produce the astonishing range of motions seen in living animals. Some of the most powerful movements occur during locomotor behaviors such as flying (1), leaping (2), and sprinting (3), and this power is usually generated by large axial and appendicular muscles of the body. Feeding movements such as biting (4) or chewing (5) are typically forceful rather than powerful and rely on the smaller cranial muscles of the head. However, powerful movements and muscles may be found in some feeding systems, such as the suction-feeding behavior of ray-finned fishes.
Suction feeding is a powerful prey capture behavior used by most of the over 30,000 species of ray-finned fishes. Fish generate suction by rapid expansion of the mouth cavity—increasing volume and lowering pressure—to accelerate water and prey into the mouth (6). Mouth expansion is facilitated by an exceptionally kinetic cranial skeleton, which is arranged in linkages that allow a single input motion to generate movement of multiple and sometimes distant bones (reviewed in ref. 7). Although the morphology of the cranial skeleton varies hugely across species, the power that moves these linkages, and thereby expands the mouth to suck in water and prey, must always be generated by muscles.
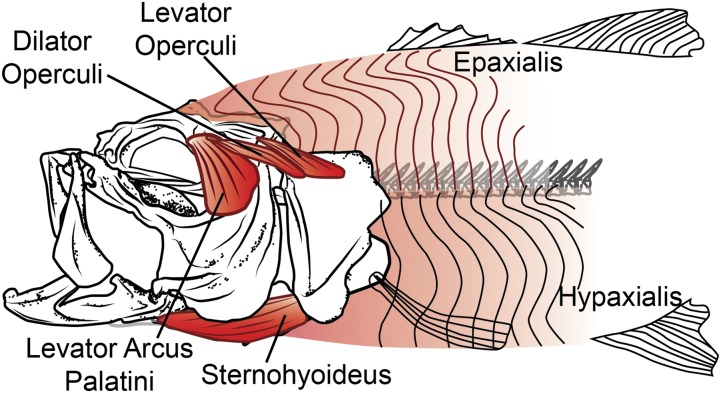
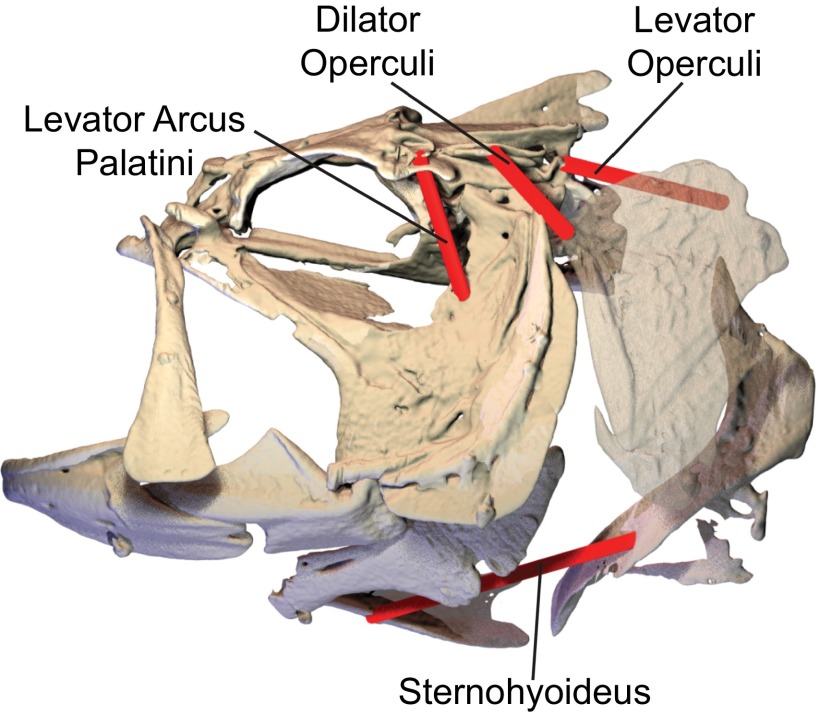
The power for suction expansion might be expected to come from cranial muscles, as it does in most vertebrate feeding systems, but it is thought that many fishes may also use axial muscles to power suction feeding (8, 9). The cranial muscles in fishes are indeed active during suction feeding (10) and attach to the cranial skeleton such that their shortening should contribute to mouth expansion (Fig. 1). However, their relatively small size has led to the intriguing hypothesis that cranial muscles are insufficient to produce all of the power for suction expansion (11, 12) and that some of the power required for suction feeding comes from the large axial muscles that typically power swimming (8, 13). In fish, the axial muscles have the potential to generate mouth expansion by elevating the neurocranium and retracting the pectoral girdle, motions that can be transmitted via linkages to the rest of the cranial skeleton (14, 15). How much of suction expansion power is generated by the axial muscles remains unknown because we have no measurements of the actual power required for this rapid, dynamic event.
Fig. 1.
Muscles of mouth expansion in largemouth bass. Cranial (sternohyoideus, levator arcus palatini, dilator operculi, levator operculi) and axial (epaxialis, hypaxialis) muscles may contribute power to suction expansion, based on their anatomy and published muscle activity patterns.
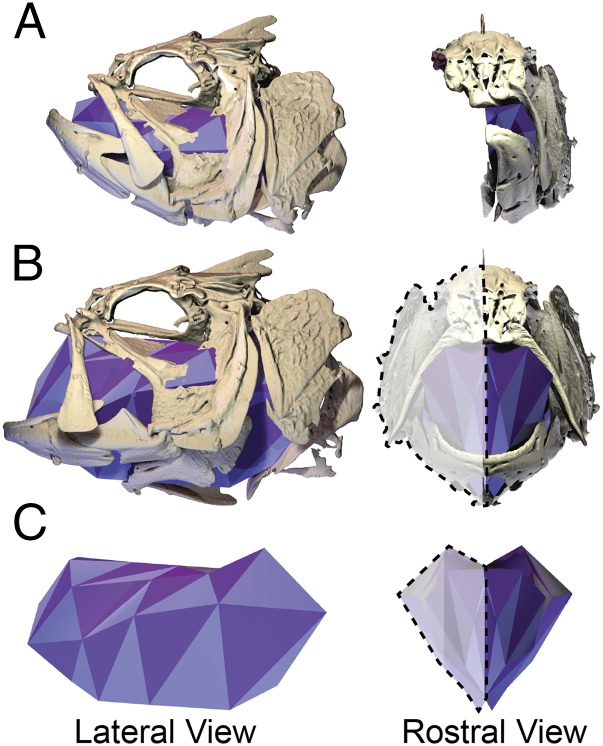
The power muscles must produce to expand the mouth can be calculated as the product of the rate of volume change and the pressure inside the mouth cavity at any given moment in time (16, 17). Although the pressure in the mouth cavity has been measured during suction expansion in many fish species, similar time-resolved recordings of mouth volume present a formidable challenge. The mouth cavity has a complex, 3D shape and motion, and this internal space is not visible with external light video. The only existing volume data are from estimates and models (18, 19), but it is now possible to measure mouth volume directly with X-ray reconstruction of moving morphology (XROMM) (20). In this study, we used XROMM to produce precise and accurate 3D animations of the bones surrounding the mouth cavity, and then measured the instantaneous volume of this cavity throughout the strike with a dynamic digital endocast (Fig. 2). The resulting volume measurements have high temporal resolution and can be combined with synchronous pressure measurements to measure how much power is required for suction expansion (16, 17).
Fig. 2.
Skeletal motions of suction expansion increase mouth cavity volume. Lateral (Left) and rostral (Right) views of an XROMM animation with the dynamic digital endocast at (A) the onset of a strike, (B) maximum mouth volume, and (C) the endocast alone at maximum mouth volume. Only the left-side bones were animated with XROMM and fit with the endocast; endocast volume was doubled to reflect the volume of the whole mouth cavity (shown by dashed outlines in B and C).
Our goal was to determine whether the suction feeding of largemouth bass capturing elusive prey is indeed powered by axial swimming muscles, or whether cranial muscle power alone is sufficient. We first measured how much power largemouth bass used to expand their mouth cavities during live suction-feeding strikes. We then compared that suction expansion power to the maximum power that the cranial muscles of these fish were capable of generating. Suction expansion powers exceeding the power capacity of the cranial muscles would indicate that the axial muscles are essential for this powerful feeding behavior.
Results
We measured the power required for suction expansion throughout the strike to test whether the cranial muscles alone could power this feeding behavior. Mouth expansion power was calculated from recordings of intraoral pressure and from the rate of volume change obtained from our dynamic digital endocast of the mouth cavity (Fig. 2). We estimated the maximum power (Popt) each muscle could contribute to mouth expansion based on muscle mass and assuming optimal activation and shortening velocity. Muscles must shorten to contribute any power, but there is an optimal velocity for power production. When muscles shorten slower or faster than this optimal velocity, they produce less power. Therefore, we also measured the in vivo shortening velocity of each muscle during mouth expansion and used this to estimate a velocity-corrected power capacity (Pvc). Although both muscle velocity and mouth expansion power varied substantially within and among individuals, we report data pooled across all three individuals except where stated that individuals differed significantly.
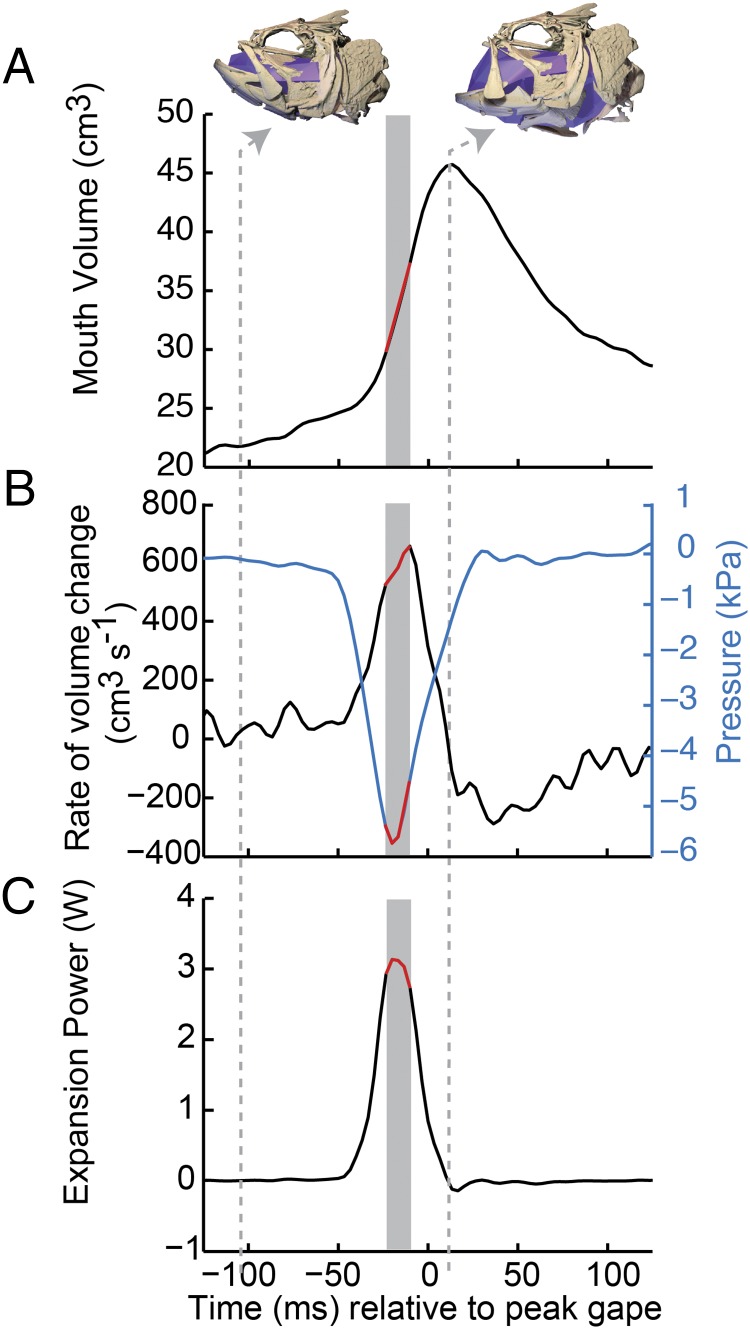
Largemouth bass expanded the mouth cavity powerfully during suction feeding, achieving subambient pressures and rapid increases in mouth volume. Mouth volume more than doubled (average increase of 247 ± 13.5%; n = 29 strikes) as the cranial skeleton expanded dorsally, ventrally, and laterally (Fig. 2 and Movie S1). The rate of volume change was not constant but began slowly, followed by a rapid increase in volume, which then slowed again as the mouth cavity approached its maximum volume (Fig. 3A). The peak rate of volume change (mean of 787.7 ± 75.8 cm3⋅s−1; n = 29 strikes) usually coincided with peak subambient pressure (Fig. 3B), both of which occurred well before maximum gape and mouth volume. Although the relative timing of these peaks was consistent, the magnitudes varied considerably across strikes. Peak suction expansion power ranged from as much as ∼15 W to as little as ∼2 W, and averaged 4.2 ± 1.1 W (n = 29 strikes). Despite this variation, largemouth bass were quite capable of high-powered suction-feeding strikes.
Fig. 3.
Volume, pressure, and expansion power of the mouth cavity during a sample strike. (A) Mouth volume, with skeletal and digital endocast positions at the onset of the strike and at peak mouth volume (indicated by dashed gray lines). (B) Rate of mouth volume change (left axis) and pressure inside the mouth cavity, relative to ambient (right axis). (C) Expansion power calculated as the product of pressure and rate of volume change at each time point.
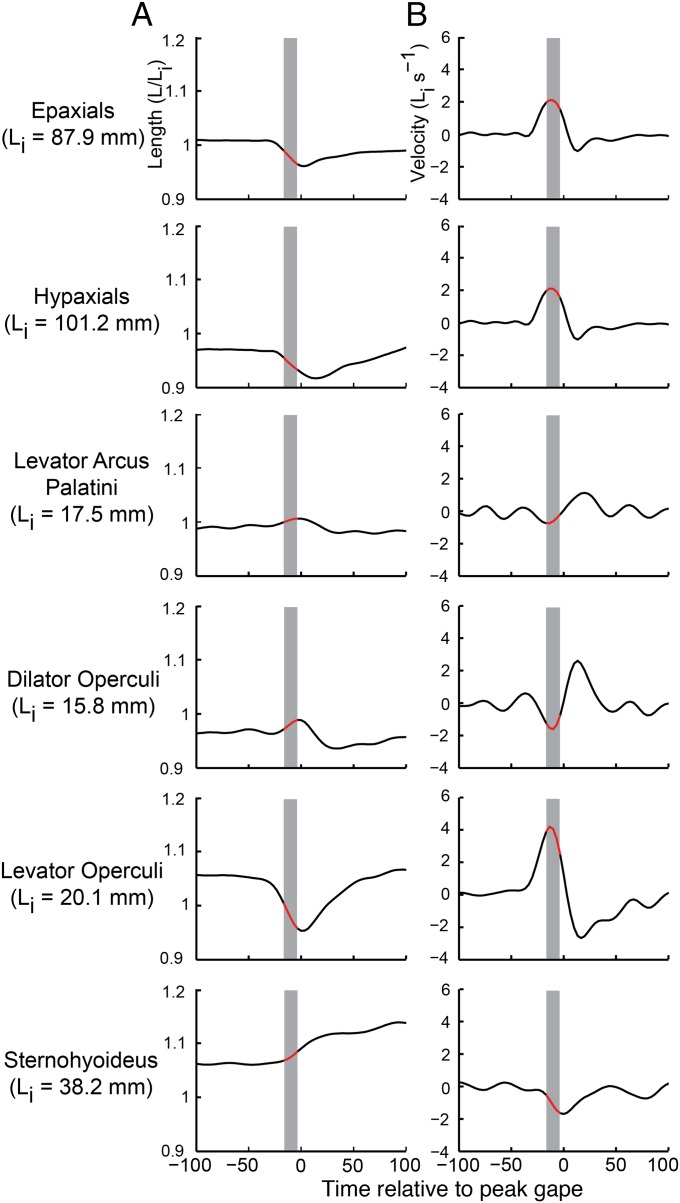
During suction-feeding strikes, most cranial and axial muscles shortened at velocities below the optimum for producing power. We measured muscle length from X-ray videos or XROMM animations, and then calculated the average muscle velocity during peak expansion power (i.e., when power was within 25% of its maximum; Fig. 4). Patterns of muscle length change varied considerably across strikes and included shortening (positive velocity and power), constant length (zero velocity and power), and lengthening (negative velocity and power). Shortening velocity varied significantly among individuals [ANOVA, F(2,26) = 3.8, P = 0.025] and across muscles [ANOVA, F(5,26) = 12.6, P < 0.0001], with the epaxial and levator operculi muscles having the highest velocities (Table S1). However, only the levator operculi muscle came close to the optimal shortening velocity of 3.6 muscle lengths per s reported for largemouth bass muscles at these temperatures (21).
Fig. 4.
Muscle length and velocity from a sample strike. Muscle length (A) is shown normalized to the mean initial muscle length (Li), which is listed for each muscle of this individual. Decreasing length values indicate muscle shortening. Muscle velocity (B), initial muscle lengths (Li) per second, with positive values indicating muscle shortening. The gray bars mark the time and red regions mark the length and velocity values during which expansion power magnitude was within 25% of its maximum.
Table S1.
Measurements of cranial and axial muscles, and volume and pressure of the mouth cavity during suction expansion
| Variable | Bass1 | Bass2 | Bass3 | Pooled |
| Muscle mass, unilateral, g | ||||
| Epaxial | 106.8 | 66.3 | 93.9 | 89.0 ± 12.0 |
| Hypaxial | 68.7 | 40.1 | 62.7 | 57.1 ± 8.7 |
| Levator arcus palatini | 1.9 | 1.4 | 2.0 | 1.8 ± 0.20 |
| Dilator operculi | 0.32 | 0.20 | 0.24 | 0.25 ± 0.04 |
| Levator operculi | 0.30 | 0.20 | 0.46 | 0.32 ± 0.08 |
| Sternohyoid | 5.7 | 3.4 | 5.8 | 4.9 ± 0.78 |
| Muscle initial length (Li), mm | ||||
| Epaxial | 87.9 ± 0.13 | 94.9 ± 2.8 (n = 6) | 108.5 ± 0.26 (n = 9) | 96.9 ± 1.9 |
| Hypaxial | 101.2 ± 0.78 | 53.8 ± 6.2 (n = 6) | 86.0 ± 0.67 (n = 9) | 83.2 ± 4.2 |
| Levator arcus palatini | 17.5 ± 0.04 | 17.3 ± 0.04 | 19.1 ± 0.05 | 18.0 ± 0.16 |
| Dilator operculi | 15.8 ± 0.40 | 12.8 ± 0.04 | 17.4 ± 0.08 | 15.4 ± 0.38 |
| Levator operculi | 20.1 ± 1.0 | 22.4 ± 0.05 | 22.0 ± 0.04 | 21.5 ± 0.39 |
| Sternohyoid | 38.2 ± 2.6 | 38.5 ± 0.21 | 46.2 ± 0.18 | 41.0 ± 1.1 |
| Peak muscle velocity, Li/s | ||||
| Epaxial | 1.2 ± 0.19 | 1.2 ± 0.20 (n = 6) | 0.67 ± 0.15 (n = 9) | 1.0 ± 0.11 |
| Hypaxial | 0.84 ± 0.31 | 1.6 ± 0.57 (n = 6) | 0.46 ± 0.19 (n = 9) | 0.89 ± 0.21 |
| Levator arcus palatini | 0.03 ± 0.18 | 0.36 ± 0.25 | 0.39 ± 0.11 | 0.26 ± 0.11 |
| Dilator operculi | 0.15 ± 0.26 | 0.88 ± 0.35 | 0.25 ± 0.13 | 0.41 ± 0.16 |
| Levator operculi | 1.81 ± 0.79 | 2.17 ± 0.19 | 1.47 ± 0.12 | 1.80 ± 0.28 |
| Sternohyoid | −0.13 ± 0.30 | 0.20 ± 0.41 | 0.27 ± 0.16 | 0.11 ± 0.17 |
| Peak rate of volume change, cm3/s | 655.3 ± 54 | 881.9 ± 87 | 841.1 ± 76 | 789.7 ± 76 |
| Peak magnitude of volume change, % | 222.7 ± 13 | 248.7 ± 9.1 | 279.7 ± 14 | 247.0 ± 13 |
| Peak pressure, kPa | −4.43 ± 0.98 | −9.67 ± 1.4 | −3.67 ± 0.28 | −5.80 ± 1.2 |
Means ± SE are listed. For all variables except mass, n = 10 strikes for Bass1 and Bass3, n = 9 strikes for Bass2, and n = 29 strikes for data pooled across individuals, unless noted otherwise. The mass of each muscle was measured in each individual, and the mean (n = 3 fish) was calculated from the pooled data.
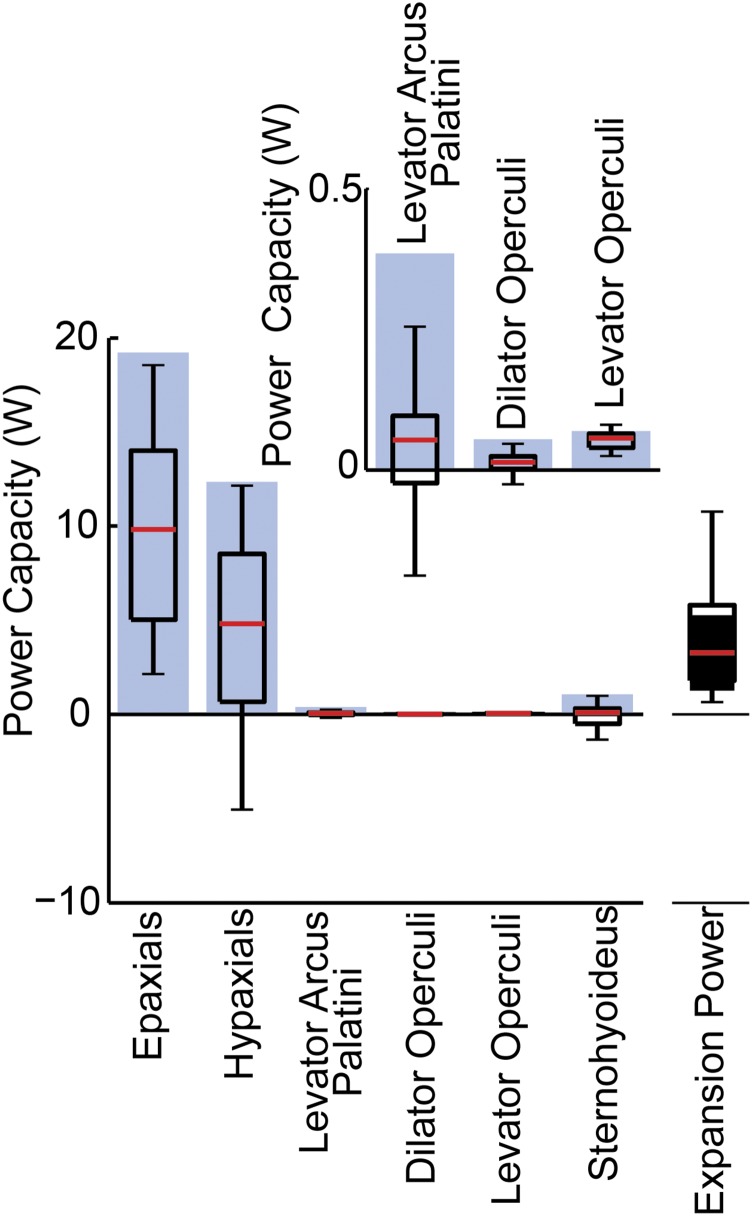
As a result of these relatively low shortening velocities, most muscles could not have generated their maximum power capacities (Popt). The Popt, assuming optimal activation and velocity, was calculated based on a power output of 216 W/kg (21) for all muscles, so the significant differences among muscles [ANOVA, F(5,26) = 51.6, P < 0.0001] solely reflect differences in muscle mass (Fig. 5). Our measurements of axial muscle masses included musculature extending nearly two-thirds of the way down the body (Materials and Methods), as a previous study demonstrated that the axial muscles in largemouth bass do indeed shorten over this entire region during suction feeding (15). Unsurprisingly, the large axial swimming muscles had significantly greater Popt than any of the cranial muscles [Tukey’s honest significant difference (HSD), P < 0.001]. However, muscles can only generate this maximum power if they shorten at the optimal velocity. When power capacities were corrected for in vivo shortening velocities to calculate Pvc (Fig. 5), almost all muscles had Pvc capacities significantly less than their Popt (single-sample t tests, P < 0.0001). Only the levator operculi muscle had a Pvc that did not differ significantly from its maximum power output (single-sample t test, t = −1.0, P = 1.6). Only the axial muscles had Pvc capacities that overlapped substantially with the power required for mouth expansion (Fig. 5).
Fig. 5.
Maximum (Popt) and velocity-corrected (Pvc) muscle power capacities. Blue bars show Popt, and boxplots show Pvc. For each muscle, mean (n = 3 fish) Popt was calculated from bilateral muscle mass, assuming a peak isotonic power output of 216 W/kg (20). The Pvc was calculated from the mean in vivo shortening velocities of each muscle during each strike, and the pooled data from all individuals (n = 29 strikes) are shown in boxplots (open). For comparison, the expansion powers required for these strikes are shown in a boxplot (filled) on the far right. All boxplots represent the 25th and 75th percentiles of the data as the bottom and top borders of the box, the median as a red line, and the whiskers extend 1.5 times the interquartile range. The Inset graph shows the same data, but with the y axis limited to 0.5 W to visualize the power capacities of the smallest three cranial muscles.
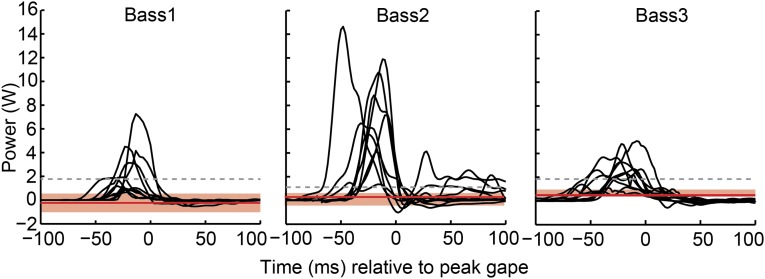
The peak suction expansion power greatly exceeded the power capacity of the cranial muscles (Fig. 6). Even if all cranial muscles operated with optimal activation and velocity to reach their Popt, together they could have only powered some of the weakest strikes (Fig. 6). However, if in vivo velocities are taken into account, none of the recorded strikes could have been powered solely by cranial muscles (Fig. 6). For Bass1 and Bass2, during the most powerful strike recorded from each fish, the summed Pvc of all of the cranial muscles was actually negative, effectively not contributing any expansion power. For Bass3, the Pvc of the cranial muscles provided only 7% of the power required during the most powerful recorded strike.
Fig. 6.
Comparison of suction expansion power and cranial muscle power capacity. Mouth expansion power of all strikes (black lines) are graphed as a function of time for each individual. The gray dashed line indicates the maximum power capacity (Popt) of all of the cranial muscles summed together, for each individual. The red line shows the median of the velocity-corrected power capacity (Pvc) of all of the cranial muscles summed together, with the red shaded region extending from the 25th to 75th percentiles.
Discussion
Based on the feeding systems of most other vertebrates, it is reasonable to expect fishes would power suction feeding primarily by muscles located in the head. Previous studies (e.g., refs. 9, 12, and 15) indicate that fish may supplement cranial muscle power with contributions from the axial swimming muscles. We found that the axial muscles not only contributed but were the primary source of power for suction feeding in largemouth bass. For most strikes, the axial muscles contributed at least 75% of the peak power required for mouth expansion, and 95% or more for the most powerful strikes (Fig. 6). The explosive, powerful feeding behaviors of these fish were generated not by muscles of the head, but by body muscles.
Cranial muscles were an insignificant source of power for suction feeding. Cranial muscle power was small, in part, simply because the cranial muscles are small. Muscle power is proportional to mass, assuming similar contractile properties, and cranial muscle mass was less than 2% of body mass in these fish. With such small masses, all four cranial muscles together could only have powered the weakest strikes (Fig. 6), even if they activated and shortened optimally to produce their maximum power capacity (Popt). Muscles must shorten to generate any power, and they can only reach their maximum power capacity when they shorten at an optimal velocity. However, most cranial muscles did not shorten optimally—and often did not shorten at all (Fig. 5). When in vivo shortening velocities were considered, the resulting velocity-corrected power capacity (Pvc) of the cranial muscles was insufficient to power any recorded strike (Fig. 6). Only the levator operculi muscle consistently shortened at near-optimal velocities (Fig. 5), although its small mass prevented it from generating substantial power. The role of the cranial muscles during suction feeding in this species may be primarily to fine-tune expansion kinematics, as they were clearly not the source of power for suction expansion.
Co-opting the massive swimming muscles to power suction feeding poses major challenges. The large size of the axial muscle regions that shorten during suction feeding (about 30% of body mass in this study) enables them to generate large powers (22, 23). However, to use axial muscle power for both swimming and feeding requires flexible neural control to accommodate both behaviors, and a mechanism for transmitting power from the body to the head. First, axial muscles must switch from unilateral activation and shortening, which bends the body for swimming, to bilateral activation and shortening, which moves the head for feeding. Because largemouth bass use unilateral axial muscle shortening to accelerate toward their prey, immediately followed by suction feeding using bilateral shortening (15), the single set of axial muscles must simultaneously meet both conflicting demands. Second, axial muscles must power expansion of the entire mouth cavity in all directions—despite these muscles only being able to directly move the two caudalmost bones of the head (the neurocranium and pectoral girdle). The transmission of axial muscle power throughout the feeding apparatus is achieved by the skeletal linkages and cranial muscles of the head. Like the unfurling of an umbrella from a single motion at the handle, the cranial linkages form pathways of motion to expand the whole mouth cavity using power originating in the motion of just two bones. In largemouth bass, the cranial muscles may act on these skeletal linkages to adjust and control mouth expansion. The cranial linkages have rightly been considered crucial to the evolution of suction feeding, primarily for the flexibility they impart to the fish skull (14, 24). However, our study reveals their role in transmitting power and motion may have been equally important, allowing fish to outsource power generation for feeding to the axial swimming muscles.
Using body muscles to power cranial motions for feeding is rare in other vertebrates but is likely common among suction-feeding fishes. We show that largemouth bass have escaped the typical vertebrate separation of behaviors into powerful locomotor movements and forceful feeding motions by using swimming muscles to produce high-powered feeding. Largemouth bass are not exceptional suction feeders (25, 26), and many species generate faster and more forceful mouth expansion during suction feeding (e.g., refs. 27 and 28). If axial muscles are necessary to power even the suction feeding of largemouth bass, we expect that many other fishes also rely on the axial muscles to power cranial expansion. However, the use of axial muscle power is likely not universal, especially as behavior and morphology vary enormously across ray-finned fishes. For example, in some species, axial muscle power may be unavailable for feeding because the neurocranium, pectoral girdle, or both are anatomically immobilized and cannot transmit axial power to the rest of the feeding apparatus. Alternatively, cranial muscles could contribute power to suction feeding in species where these muscles are much more massive. The complete reliance on axial muscle power in largemouth bass suggests that many fish may power suction feeding with axial swimming muscles, but further studies are needed to confirm this.
This perspective on the role of axial muscles—as powering feeding behaviors—may change our understanding both of the evolution of suction feeding and of the form–function relationships of axial muscles in ray-finned fishes. The morphology and contractile properties of axial muscles have been studied and interpreted primarily in the context of their function in locomotor behaviors. These white, fast-fibered muscles primarily power rapid swimming behaviors (such as fast escapes), during which the more rostral regions of the epaxials and hypaxials are thought to generate most of the power while more caudal regions transmit that power to the tail (22). However, we have shown here that these muscles also power feeding, and this role may have also shaped the evolution of axial body muscle structure. In turn, the evolution of the cranial muscles and skeletal linkages must now be considered in the context of their function transmitting axial muscle power to produce mouth expansion. The axial muscles are ancient—already present in the agnathan ancestors of gnathostomes (29)—and at least the epaxials have contributed to feeding motions by elevating the cranium from the earliest jawed vertebrates, the placoderms (30), to both cartilaginous (31) and ray-finned fishes and even suction-feeding tetrapods (6). Co-opting axial muscles for feeding may have been essential for the evolution of high-power suction expansion in ray-finned fishes and contributed to the success of this group, which contains over 30,000 extant species and accounts for more than one-half of all vertebrates (32).
Materials and Methods
Three largemouth bass, Micropterus salmoides, were obtained from Wiining Aquaculture, with standard lengths of 307.1, 286.7, and 316.4 mm for Bass1, Bass2, and Bass3, respectively. All husbandry and experimental procedures were approved by the Brown University Institutional Animal Care and Use Committee. Following methods described by Camp and Brainerd (15), fish were anesthetized and two to five spherical tantalum markers (0.5- to 1.0-mm diameter) were implanted in each of the following bones: neurocranium, urohyal, and the left suspensorium, operculum, cleithrum, interoperculum, fused ceratohyal and epihyal, lower jaw, and maxilla. Intramuscular (0.8-mm) markers were implanted in the epaxial, hypaxial, and sternohyoideus muscles. Following the methods of Norton and Brainerd (25), a cannula to house the pressure probe was implanted rostrally, through the ethmo-frontal region of the neurocranium so that the tip of the probe would just protrude into the mouth cavity. Fish recovered fully and resumed normal feeding behavior within 3 d, with no sign of difficulty or discomfort caused by the implanted markers and cannula.
Data Collection.
Biplanar X-ray videos and intraoral pressures were recorded synchronously from each fish during suction-feeding strikes. Dorsoventral- and lateral-view X-ray images were generated by two X-ray machines (Imaging Systems and Service) and captured by Phantom, version 10, high-speed cameras (Vision Research) recording at either 300 or 500 Hz. Pressure was measured by a SPR-407 Mikro-tip pressure probe (Millar Instruments) inserted through the cannula and recorded at 1,000 Hz via PowerLab and LabChart 7.2.2 (AD Instruments). A single start trigger initiated both X-ray and pressure recordings to synchronize the two data types. Suction-feeding strikes on live goldfish (Carassius auratus; ∼30-mm standard length) were recorded from each individual (n = 10 for Bass1 and Bass3; n = 9 for Bass2).
Computed tomography (CT) scans were taken of each fish at 480 × 480-pixel resolution and 0.173-mm slice thickness on a FIDEX CT Scanner (Animage). These scans were used to build 3D mesh models of the implanted bones and the markers, using OsiriX (version 5.6; 64-bit; Pixmeo Sarl) and Geomagic Studio (version 11; Geomagic).
X-Ray Video Analysis.
Bone and muscle marker positions were extracted from the X-ray videos to calculate 3D skeletal kinematics and muscle lengths (15, 20). All video analysis and XROMM animation were done using custom programs and scripts (available at xromm.org) running within MATLAB (R2014a; The MathWorks) and Autodesk Maya (2014; Autodesk). Bone marker coordinates from X-ray videos were filtered (Butterworth low-pass, 60-Hz cutoff) and combined with marker coordinates from 3D mesh bone models to calculate rigid-body transformations (20). For bones with fewer than three markers, Scientific Rotoscoping was used to align the bone model to match its position in both X-ray images (33). Mean marker tracking precision in this study was ±0.11 mm. Both rigid-body transformations and Scientific Rotoscoping were used to create a single XROMM animation of all of the implanted bones for each suction-feeding strike (Movie S2).
Because the XROMM animations accurately and precisely reconstructed the motion of cranial bones during mouth expansion, the volume enclosed by these bones accurately represented the volume of the mouth cavity during expansion. This suction expansion volume was measured with a dynamic digital endocast of the mouth cavity. The endocast was created in Maya by shaping a polygonal mesh model to fill the left side of the mouth cavity (Fig. 3). The endocast polygon was shaped by linking its vertices to skeletal landmarks and points defining a midsagittal plane. Thus, when the animated bone models moved during mouth expansion, the endocast changed shape and volume along with the mouth cavity. Endocast volume at each frame was calculated by a Maya script (www.vfxoverflow.com), implemented and customized by S. Gatesy (Brown University, Providence, RI). Because our XROMM animation depicted only the left side of the head, endocast volume values were doubled to reflect total mouth volume.
Muscle length was measured from the motion of intramuscular markers (fluoromicrometry) or from the XROMM animations. Axial muscle length was measured with fluoromicrometry, following the methods of Camp and Brainerd (15). Whole-muscle length for the epaxials was defined as the region extending from the craniovertebral joint to the caudalmost spiny fin ray, and for the hypaxials, was the region from 1 cm caudal to the pectoral girdle to the rostralmost anal fin ray. These axial muscle regions consistently shortened during suction feeding in largemouth bass (15). For muscles without implanted markers (i.e., the cranial muscles), lengths were calculated from the XROMM animations as the distance between bony attachment sites of a representative fiber (Fig. S1). This method has been used successfully for muscles that, like these cranial muscles, are nonpennate and lack external tendons (5). For the sternohyoideus, length was measured both with fluoromicrometry and from XROMM animations, confirming that both methods gave similar results. Lengths and velocities for all muscles were calculated relative to the initial muscle length, defined as the average length of the muscle at the first frame of recorded data. Muscle length was filtered (Butterworth low-pass, 30 Hz) before calculating velocity, and we used the convention of positive velocity values indicating muscle shortening (Fig. 4).
Fig. S1.
Measurement of cranial muscle lengths, using X-ray reconstruction of moving morphology (XROMM) animations. For each of the four cranial muscles shown above, the length of a representative fiber (red cylinder) was measured from XROMM animations by calculating the distance between the bony attachment sites of each fiber.
Power Calculations.
Mouth expansion power was calculated as the product of intraoral pressure and rate of change in mouth volume. This method has been used to measure the instantaneous power required to generate flow in other systems (16), and most frequently to measure the power output of heart contractions (e.g., ref. 17). Volume change at each time step was calculated from the volume of the digital endocast and therefore had the same frequency as the X-ray videos: 300 Hz (Bass1) or 500 Hz (Bass2 and Bass3). Intraoral pressure, relative to the initial ambient pressure, was first filtered (Butterworth low-pass, 60-Hz cutoff) and resampled from 1,000 Hz to the same frequency as the volume change data. At each time step, the current and subsequent pressure values were averaged and multiplied by −1 so that positive mouth expansion power represented subambient pressure and increasing mouth volume. The product of rate of change in mouth volume and intraoral pressure at each point in time provided a continuous measure of instantaneous suction power. There are two sources of inaccuracy associated with the pressure measurements in this study. First, intraoral pressure represents the force necessary to produce suction but does not account for additional muscular forces required to overcome inertia, drag, and added mass associated with the motion of the elements of the head (34). Although such forces are predicted to be small relative to the forces required to generate suction (11, 35, 36), ignoring them may result in a slight underestimate of total muscle power required. A second source of error results from the fact that pressure was measured from a single location. Intraoral pressure during suction expansion is expected to vary spatially with the greatest magnitude of subambient pressure occurring at the caudal end of the mouth cavity (35, 37). Our more rostral measurements of pressure likely underestimated the average subambient pressure of the mouth cavity, and therefore also underestimated the power required for mouth expansion.
We used measurements of muscle mass and published values of muscle mass-specific power to estimate the maximum power each muscle could have produced under optimal conditions. This maximum muscle power capacity (Popt) assumed that all of the muscles involved in suction feeding had a maximum power output of 216 W/kg, a value measured from largemouth bass epaxial muscles (21). To measure muscle mass, whole muscles were dissected and weighed unilaterally, and the values doubled to get the total bilateral mass of each muscle. For the axial muscles, muscle mass was measured over the same regions as muscle shortening: from the craniovertebral joint to the caudalmost spiny fin ray for the epaxials, and from just caudal to the pectoral girdle to the rostralmost anal fin ray for the hypaxials. These regions—covering nearly two-thirds of the body—are known to shorten during suction feeding in largemouth bass (15). Popt was calculated for each muscle as the product of the mass-specific power output and the bilateral muscle mass.
The maximum, mass-specific power output for skeletal muscle represents the power produced in a fully activated muscle shortening at optimal velocity. Power is reduced at velocities faster or slower than the optimal, or when the muscle is not fully active. To generate a more realistic estimate of potential muscle power, we used in vivo shortening velocities to calculate the velocity-corrected power capacity (Pvc) of each muscle during each strike. First, we estimated a general velocity–power relationship by fitting a Hill-type force–velocity curve (38) to maximum values of power output [216 W/kg (21)], force [159 kN/m2 (39)], and velocity [11 muscle lengths per s (21)] reported for fish axial muscle. We then measured muscle shortening velocity during each strike as the average velocity of each muscle during peak (>25% of maximum) mouth expansion power for each strike. Using these shortening velocities and the velocity–power relationship, we calculated the velocity-corrected power capacity of each muscle during each strike. This Pvc takes into account muscle shortening behavior but still assumes activation conditions are optimal for power production.
Data Analysis.
The average muscle velocity during peak power production was compared among muscles and individuals with a two-way ANOVA. If there was no significant effect of individual, data for each muscle were pooled across individuals, but otherwise data from each individual were analyzed separately. For these, and all following statistical tests, significant ANOVA results were followed with Tukey’s HSD post hoc tests, and all tests were performed in JMP (SAS Institute).
To determine whether shortening velocity significantly reduced muscle power capacity, we compared the Pvc of each muscle to their respective Popt. First, we used a two-way ANOVA to test whether Popt differed significantly among individuals or muscles. If not, all data were pooled and single-sample t tests were used to compare Pvc to the Popt of each muscle.
Supplementary Material
Acknowledgments
We are grateful to Erika Giblin and Natividad Chen for data collection assistance; Steven Gatesy, Robert Kambic, and Mark Langer for data analysis tools and feedback; and Wiining Aquaculture for providing study animals. Funding was provided by National Science Foundation Grants 0642428, 0840950, and 1262156.
Footnotes
The authors declare no conflict of interest.
This article is a PNAS Direct Submission.
Data deposition: All X-ray video data used for this study have been deposited in the X-Ray Motion Analysis Portal, xmaportal.org.
See Commentary on page 8525.
This article contains supporting information online at www.pnas.org/lookup/suppl/doi:10.1073/pnas.1508055112/-/DCSupplemental.
References
- 1.Askew GN, Marsh RL. The mechanical power output of the pectoralis muscle of blue-breasted quail (Coturnix chinensis): The in vivo length cycle and its implications for muscle performance. J Exp Biol. 2001;204(Pt 21):3587–3600. doi: 10.1242/jeb.204.21.3587. [DOI] [PubMed] [Google Scholar]
- 2.Aerts P. Vertical jumping in Galago senegalensis: The quest for an obligate mechanical power amplifier. Philos Trans R Soc Lond B Biol Sci. 1998;353(1375):1607–1620. [Google Scholar]
- 3.Swoap SJ, Johnson TP, Josephson RK, Bennett AF. Temperature, muscle power output and limitations on burst locomotor performance of Dipsosaurus dorsalis. J Exp Biol. 1993;174(1):185–197. [Google Scholar]
- 4.Herrel A, McBrayer LD, Larson PM. Functional basis for sexual differences in bite force in the lizard Anolis carolinensis. Biol J Linn Soc Lond. 2007;91(1):111–119. [Google Scholar]
- 5.Gidmark NJ, Konow N, Lopresti E, Brainerd EL. Bite force is limited by the force-length relationship of skeletal muscle in black carp, Mylopharyngodon piceus. Biol Lett. 2013;9(2):20121181. doi: 10.1098/rsbl.2012.1181. [DOI] [PMC free article] [PubMed] [Google Scholar]
- 6.Lauder GV. Aquatic feeding in lower vertebrates. In: Hildebrand M, Bramble DM, Liem KF, Wake DB, editors. Functional Vertebrate Morphology. Harvard Univ Press; Cambridge, MA: 1985. pp. 185–229. [Google Scholar]
- 7.Westneat MW. 2006. Skull biomechanics and suction feeding in fishes. Fish Biomechanics. Fish Physiology, eds Shadwick RE, Lauder G (Academic, San Diego), pp 29–75.
- 8.Tchernavin VV. The Feeding Mechanisms of a Deep Sea Fish Chauliodus sloani Schneider. British Museum; London: 1953. [Google Scholar]
- 9.Carroll AM, Wainwright PC. Muscle function and power output during suction feeding in largemouth bass, Micropterus salmoides. Comp Biochem Physiol A Mol Integr Physiol. 2006;143(3):389–399. doi: 10.1016/j.cbpa.2005.12.022. [DOI] [PubMed] [Google Scholar]
- 10.Grubich JR. Prey capture in Actinopterygian fishes: A review of suction feeding motor patterns with new evidence from an elopomorph fish, Megalops atlanticus. Am Zool. 2001;41(6):1258–1265. [Google Scholar]
- 11.Aerts P, Osse J, Verraes W. Model of jaw depression during feeding in Astatotilapia elegans (Teleostei: Cichlidae): Mechanisms for energy storage and triggering. J Morphol. 1987;194(1):85–109. doi: 10.1002/jmor.1051940108. [DOI] [PubMed] [Google Scholar]
- 12.Van Wassenbergh S, Herrel A, Adriaens D, Aerts P. Interspecific variation in sternohyoideus muscle morphology in clariid catfishes: Functional implications for suction feeding. J Morphol. 2007;268(3):232–242. doi: 10.1002/jmor.10510. [DOI] [PubMed] [Google Scholar]
- 13.Lauder GV. Evolution of the feeding mechanism in primitive Actinopterygian fishes: A functional anatomical analysis of Polypterus, Lepisosteus, and Amia. J Morphol. 1980;163(3):283–317. doi: 10.1002/jmor.1051630305. [DOI] [PubMed] [Google Scholar]
- 14.Lauder G. Patterns of evolution in the feeding mechanism of Actinopterygian fishes. Am Zool. 1982;22(2):275–285. [Google Scholar]
- 15.Camp AL, Brainerd EL. Role of axial muscles in powering mouth expansion during suction feeding in largemouth bass (Micropterus salmoides) J Exp Biol. 2014;217(Pt 8):1333–1345. doi: 10.1242/jeb.095810. [DOI] [PubMed] [Google Scholar]
- 16.Marsh RL, Olson JM, Guzik SK. Mechanical performance of scallop adductor muscle during swimming. Nature. 1992;357(6377):411–413. doi: 10.1038/357411a0. [DOI] [PubMed] [Google Scholar]
- 17.Stein PDS, Sabbah HN. Ventricular performance measured during ejection: Studies in patients of the rate of change of ventricular power. Am Heart J. 1976;91(5):599–606. doi: 10.1016/s0002-8703(76)80145-7. [DOI] [PubMed] [Google Scholar]
- 18.Van Wassenbergh S, Aerts P, Herrel A. Hydrodynamic modelling of aquatic suction performance and intra-oral pressures: Limitations for comparative studies. J R Soc Interface. 2006;3(9):507–514. doi: 10.1098/rsif.2005.0110. [DOI] [PMC free article] [PubMed] [Google Scholar]
- 19.Carroll AM, Wainwright PC. Energetic limitations on suction feeding performance in centrarchid fishes. J Exp Biol. 2009;212(Pt 20):3241–3251. doi: 10.1242/jeb.033092. [DOI] [PubMed] [Google Scholar]
- 20.Brainerd EL, et al. X-ray reconstruction of moving morphology (XROMM): Precision, accuracy and applications in comparative biomechanics research. J Exp Zool A Ecol Genet Physiol. 2010;313(5):262–279. doi: 10.1002/jez.589. [DOI] [PubMed] [Google Scholar]
- 21.Coughlin DJ, Carroll AM. In vitro estimates of power output by epaxial muscle during feeding in largemouth bass. Comp Biochem Physiol A Mol Integr Physiol. 2006;145(4):533–539. doi: 10.1016/j.cbpa.2006.08.026. [DOI] [PubMed] [Google Scholar]
- 22.Johnston I, Leeuwen J, Davies M, Beddow T. How fish power predation fast-starts. J Exp Biol. 1995;198(Pt 9):1851–1861. doi: 10.1242/jeb.198.9.1851. [DOI] [PubMed] [Google Scholar]
- 23.Wakeling JM, Johnston IA. Muscle power output limits fast-start performance in fish. J Exp Biol. 1998;201(Pt 10):1505–1526. doi: 10.1242/jeb.201.10.1505. [DOI] [PubMed] [Google Scholar]
- 24.Schaeffer B, Rosen D. Major adaptive levels in the evolution of the actinopterygian feeding mechanism. Am Zool. 1961;1(2):187–204. [Google Scholar]
- 25.Norton SF, Brainerd EL. Convergence in the feeding mechanics of ecomorphologically similar species in the Centrarchidae and Cichlidae. J Exp Biol. 1993;176(1):11–29. [Google Scholar]
- 26.Holzman R, Day SW, Mehta RS, Wainwright PC. Integrating the determinants of suction feeding performance in centrarchid fishes. J Exp Biol. 2008;211(Pt 20):3296–3305. doi: 10.1242/jeb.020909. [DOI] [PubMed] [Google Scholar]
- 27.Van Wassenbergh S, Strother JA, Flammang BE, Ferry-Graham LA, Aerts P. Extremely fast prey capture in pipefish is powered by elastic recoil. J R Soc Interface. 2008;5(20):285–296. doi: 10.1098/rsif.2007.1124. [DOI] [PMC free article] [PubMed] [Google Scholar]
- 28.Grobecker DB, Pietsch TW. High-speed cinematographic evidence for ultrafast feeding in antennariid anglerfishes. Science. 1979;205(4411):1161–1162. doi: 10.1126/science.205.4411.1161. [DOI] [PubMed] [Google Scholar]
- 29.Gemballa S, Vogel F. Spatial arrangement of white muscle fibers and myoseptal tendons in fishes. Comp Biochem Physiol A Mol Integr Physiol. 2002;133(4):1013–1037. doi: 10.1016/s1095-6433(02)00186-1. [DOI] [PubMed] [Google Scholar]
- 30.Anderson PSL. Using linkage models to explore skull kinematic diversity and functional convergence in arthrodire placoderms. J Morphol. 2010;271(8):990–1005. doi: 10.1002/jmor.10850. [DOI] [PubMed] [Google Scholar]
- 31.Wilga C. Advances in the study of feeding behaviors, mechanisms, and mechanics of sharks. Environ Biol Fishes. 2001;60(1):131–156. [Google Scholar]
- 32.Near TJ, et al. Resolution of ray-finned fish phylogeny and timing of diversification. Proc Natl Acad Sci USA. 2012;109(34):13698–13703. doi: 10.1073/pnas.1206625109. [DOI] [PMC free article] [PubMed] [Google Scholar]
- 33.Gatesy SM, Baier DB, Jenkins FA, Dial KP. Scientific rotoscoping: A morphology-based method of 3-D motion analysis and visualization. J Exp Zool A Ecol Genet Physiol. 2010;313(5):244–261. doi: 10.1002/jez.588. [DOI] [PubMed] [Google Scholar]
- 34.Van Wassenbergh S, Aerts P, Adriaens D, Herrel A. A dynamic model of mouth closing movements in clariid catfishes: The role of enlarged jaw adductors. J Theor Biol. 2005;234(1):49–65. doi: 10.1016/j.jtbi.2004.11.007. [DOI] [PubMed] [Google Scholar]
- 35.Muller M, Osse J, Verhagen J. A quantitative hydrodynamical model of suction feeding in fish. J Theor Biol. 1982;95(1):49–79. [Google Scholar]
- 36.Van Wassenbergh S, Day SW, Hernández LP, Higham TE, Skorczewski T. Suction power output and the inertial cost of rotating the neurocranium to generate suction in fish. J Theor Biol. 2015;372:159–167. doi: 10.1016/j.jtbi.2015.03.001. [DOI] [PubMed] [Google Scholar]
- 37.Van Wassenbergh S, Aerts P, Herrel A. Scaling of suction-feeding kinematics and dynamics in the African catfish, Clarias gariepinus. J Exp Biol. 2005;208(Pt 11):2103–2114. doi: 10.1242/jeb.01603. [DOI] [PubMed] [Google Scholar]
- 38.McMahon TA. Muscles, Reflexes, and Locomotion. Princeton Univ Press; Princeton: 1984. [Google Scholar]
- 39.James R, i Scaling of muscle performance during escape responses in the fish Myoxocephalus scorpius L. J Exp Biol. 1998;201(Pt 7):913–923. doi: 10.1242/jeb.201.7.913. [DOI] [PubMed] [Google Scholar]
Associated Data
This section collects any data citations, data availability statements, or supplementary materials included in this article.


