

Significance
Nonsmall cell lung cancer (NSCLC) is one of the deadliest cancers in the world. Although a very small subset of NSCLC patients respond to TNF-related apoptosis-inducing ligand (TRAIL), resistance remains a major hindrance to successful treatment. miRNAs are small noncoding RNAs of ∼24 nt that negatively regulate gene expression. Here, we show that miR-148a is significantly down-regulated in cells with acquired TRAIL resistance. Furthermore, we have determined that miR-148a can sensitize cells to TRAIL and inhibit tumorigenesis by targeting matrix metalloproteinase 15 and Rho-associated kinase 1 protein expression. Thus, miR-148a could be a promising prognostic and therapeutic tool in NSCLC treatment.
Keywords: microRNA, chemoresistance, lung cancer
Abstract
Nonsmall cell lung cancer (NSCLC) is one of the leading causes of death worldwide. TNF-related apoptosis-inducing ligand (TRAIL) has been shown to induce apoptosis in malignant cells without inducing significant toxicity in normal cells. However, several carcinomas, including lung cancer, remain resistant to TRAIL. MicroRNAs (miRNAs) are small noncoding RNAs of ∼24 nt that block mRNA translation and/or negatively regulate its stability. They are often aberrantly expressed in cancer and have been implicated in increasing susceptibility or resistance to TRAIL-induced apoptosis by inhibiting key functional proteins. Here we show that miR-148a is down-regulated in cells with acquired TRAIL-resistance compared with TRAIL-sensitive cells. Enforced expression of miR-148a sensitized cells to TRAIL and reduced lung tumorigenesis in vitro and in vivo through the down-modulation of matrix metalloproteinase 15 (MMP15) and Rho-associated kinase 1 (ROCK1). These findings suggest that miR-148a acts as a tumor suppressor and might have therapeutic application in the treatment of NSCLC.
Currently, the largest cause of cancer-related deaths in the world is lung cancer. Nonsmall cell lung cancer (NSCLC) is the most frequent type of lung cancer, constituting more than 85% of all cases (1). It is often diagnosed at an advanced stage and has poor prognosis. The development of targeted therapies, such as promoting apoptosis, has been one of the methodologies for treatment of NSCLC (2). Tumor necrosis factor (TNF)-related apoptosis inducing ligand (TRAIL) is a cytokine, and a member of the TNF family that is being tested in clinical trials. Although TRAIL has shown clinical efficacy in a subset of NSCLC patients, either alone or combined with chemotherapy, many lung tumors are resistant to TRAIL and the mechanism of this resistance is not fully understood. MicroRNAs (miRNAs), small noncoding RNAs of 19–25 nt, inhibit mRNA translation and/or negatively regulate its stability by binding to the 3′ untranslated region (3′ UTR) of target mRNAs (3). Recent evidence suggests that miRNAs are involved in a number of biological processes such as development, proliferation, differentiation, and apoptosis (4, 5). They are often aberrantly expressed in cancer, and their function is linked to the regulation of oncogenes and/or tumor suppressor genes involved in cell signaling pathways (6). Several miRNAs have been implicated in increasing susceptibility or resistance to TRAIL-induced apoptosis by inhibiting key functional proteins (7–10).
The matrix metalloproteinases (MMPs) are a family of zinc proteases that play an important role in the breakdown of the extracellular matrix in normal physiological processes, such as embryonic development, tissue and bone remodeling, wound healing, and angiogenesis (11, 12). They are well characterized for their contribution to the development of cancer (13). MMP15 is a membrane-type metalloproteinase that has also been identified as an antiapoptotic marker in cancer cells, and its inhibition increases sensitivity to TRAIL-induced apoptosis (14). Rho-associated coiled coil protein (Ser/Thr) kinase-1 (ROCK1) is an essential effector kinase downstream of Rho GTPases that has a central role in many motile responses that involve the actin cytoskeleton and/or microtubule network, from neurite extension to phagocytosis and cancer-cell invasion (15). ROCK1 has been implicated in anchorage-independent growth and metastasis in several cancers (16–19). In this study, we found that miR-148a is down-regulated in NSCLC cells with both primary and acquired TRAIL resistance compared with TRAIL-sensitive cells. MMP15 and ROCK1 have been identified as miR-148a direct targets. In TRAIL-resistant cells, miR-148a induced apoptosis after TRAIL treatment by regulating MMP15 expression. miR-148a inhibited cell migration and invasion through the silencing of both MMP15 and ROCK1. Furthermore, the inverse relation between miR-148a and the two target genes was validated in lung tumor tissue samples.
Results
MiR-148a Targets ROCK1 and MMP15.
To investigate mechanisms involved in TRAIL response, we generated TRAIL-resistant cells (H460R and H292R) by exposing the parental TRAIL sensitive H460 and H292 cells (H460S and H292S), respectively, to stepwise increases in TRAIL concentrations (1–500 ng/mL) over a period of 6 mo (20). Upon comparison of the miRNA expression profile of H460R versus H460S and by quantitative real-time PCR (qRT-PCR), we found miR-148a to be markedly down-regulated in the resistant cell lines compared with their sensitive counterparts (Fig. S1A). The expression of miR-148a was also found to be down-regulated in NSCLC cell lines with primary TRAIL resistance (A549, Calu-1, and H1299) compared with the more sensitive H460 and H292 cell line (Fig. 1A). To further understand the effect of TRAIL on miR-148a expression, H460-sensitive cells were treated with TRAIL (50 ng/mL) over a 24-h period. The plates were washed with PBS, and surviving cells were collected. We observed a significant decrease in the expression of miR-148a by qRT-PCR in a time-dependent manner in the surviving cells (Fig. 1B). To confirm that TRAIL can affect miR-148a expression, we used siRNA against TRAIL receptors DR4 and DR5 to neutralize the effect of TRAIL treatment. H292 cells were transfected with both siRNAs together followed by 24-h TRAIL treatment (50 ng/mL). Knockdown of TRAIL receptors blocked TRAIL-induced apoptosis, and we did not see a change in miR-148a expression (Fig. S1 B and C). Next, to identify miR-148a targets, we performed a bioinformatics search (TargetScan and Pictar). Among the candidates, MMP15 (nucleotides 4289–4295 and 4410–4416; NM_002428) and ROCK1 (nucleotides 5873–5879 and 6420–6426; NM_005406) mRNA contained regions in their 3′ UTRs that matched the seed sequence of human miR-148a (Fig. 1C). To verify whether ROCK1 and MMP15 were direct targets of miR-148a, their 3′ UTRs were cloned into the pGL3 control vector downstream of the luciferase ORF. Enforced expression of these constructs in combination with miR-148a in A549 cells, which express low levels of miR-148a, significantly decreased luciferase expression measured as relative luciferase activity (Fig. 1D). Conversely, when we used pGL3 control vectors containing ROCK1 and MMP15 3′ UTRs where miR-148a binding sites were deleted by site-directed mutagenesis, a consistent abrogation of the miR-148a inhibitory effect was observed (Fig. 1 C and D). Next, we overexpressed miR-148a in A549 and Calu-1 cells, as confirmed by qRT-PCR (Fig. S1D) and checked the endogenous levels of ROCK1 and MMP15 protein and mRNA levels. Both MMP15 and ROCK1 protein and mRNA levels were reduced in cells transfected with miR-148a compared with control cells (Fig. 1 E and F), suggesting that miR-148a directly regulated MMP15 and ROCK1 at the transcriptional level.
Fig. S1.

miR-148a is down-regulated in TRAIL-resistant cell lines. (A) qRT-PCR showing reduced expression of miR-148a in TRAIL-resistant H460R and H292R cells compared with TRAIL-sensitive H460 and H292 cells. (B) Western blot showing knockdown of TRAIL receptors DR4 and DR5 after transfection of H292 cells with DR4 and DR5 siRNAs. (C) Treatment with TRAIL induced a decrease in miR-148a expression in the surviving cells. Silencing of DR4 and DR5 neutralized this effect. (D) qRT-PCR in A549 and Calu-1 cells after enforced expression of miR-148a. *P < 0.05 and **P < 0.01 by Student’s t test.
Fig. 1.

MMP15 and ROCK1 are targets of miR-148a. (A) qRT-PCR showing endogenous expression of miR-148a in NSCLC cell lines with primary TRAIL resistance (A549, Calu-1, and H1299) and TRAIL-sensitive cell lines (H460 and H292). (B) qRT-PCR showing decrease in expression of miR-148a in surviving H460 cells after TRAIL treatment. (C) MMP15 and ROCK1 3′ UTRs both contain two predicted miR-148a binding sites. The alignment of the seed regions of miR-148a with the two sites is shown. The site of target mutagenesis is indicated in red. (D) pGL3-MMP15 and pGL3-ROCK1 luciferase constructs, containing a wild-type or mutated MMP15 and ROCK1 3′ UTRs, were transfected into A549 cells. The binding sites on the MMP15 3′ UTR are close together and were cloned into the same construct, whereas for ROCK1 3′UTR each site was cloned separately. Relative repression of firefly luciferase expression was standardized to a transfection control. The normalized activity of the control transfectants in each experiment was set as relative luciferase activity 1. Therefore, no error bar is shown for control transfectants. (E) MiR-148a overexpression leads to the down-regulation of endogenous levels of ROCK1 and MMP15 proteins in A549 and Calu-1 cell lines. (F) qRT-PCR in A549 cells showing a decrease in ROCK1 and MMP15 mRNAs after miR-148a enforced expression. Data are presented as ± SD; *P < 0.05 and **P < 0.01 by Student’s t test.
MiR-148a Overexpression Increases TRAIL Sensitivity in NSCLC.
We next examined the effects of miR-148a on cell survival and TRAIL resistance in NSCLC. To test whether miR-148a overexpression in TRAIL-resistant A549 could increase the response to the drug, proliferation and apoptosis assays were performed. A549 were transfected with either a scrambled miRNA or miR-148a. After 48 h, transfected cells were exposed to TRAIL and cell viability and apoptosis were assessed by MTS, caspase-8, and caspase-3/7 activity assays, respectively. Overexpression of miR-148a in A549 cells led to reduced cell viability upon TRAIL exposure, and these cells were more sensitive to TRAIL-induced cell death as indicated by a time-dependent increase in caspase-8 and caspase-3/7 activation (Fig. 2 A and B). This effect was further confirmed in Calu-1 cells by MTS and caspase-3/7 activity assay (Fig. S2 A and B). To further investigate the role of miR-148a in TRAIL-induced apoptosis, the cleavage of poly (ADP ribose) polymerase-1 (PARP-1) was tested in A549 cells after TRAIL treatment. As expected, overexpression of miR-148a in A549 cells led to increased PARP-1 cleavage (Fig. 2C). Furthermore, Annexin-FITC assay revealed an increase in TRAIL sensitivity after miR-148a overexpression in TRAIL-resistant Calu-1 cells (Fig. 2D). A previous study reported that MMP15 down-regulation increased the response to TRAIL-induced apoptosis (14). To determine whether MMP15 overexpression is directly related to TRAIL resistance, we transfected H460 cells with either an expression vector containing MMP15 cDNA (Thermo Scientific) or an empty vector. After 48 h, cells were treated with TRAIL for 6 h and proliferation and caspase-3/7 activity assays were performed. H460 cells overexpressing MMP15 showed increased cell viability and resistance to TRAIL-induced apoptosis (Fig. 2 E and F). Furthermore, Western blot showed a reduction in TRAIL-induced caspase-8 activation (Fig. 2G). This effect was further confirmed by using caspase-8 activity assay in H292 cells transfected with MMP15 and treated with TRAIL (25 and 50 ng/mL) (Fig. S2C). However, ROCK1 overexpression did not have any effect on TRAIL sensitivity in H460 cells (Fig. S2 D and E). These results supported our hypothesis that miR-148a–mediated MMP15 down-regulation plays a crucial role in TRAIL sensitivity in NSCLC.
Fig. 2.

miR-148a induces TRAIL sensitivity in NSCLC by targeting MMP15. (A) Proliferation assay in A549 cells transfected with control miR or miR-148a for 48 h followed by 24-h TRAIL treatment (200 ng/mL). Cells overexpressing miR-148a were more sensitive to TRAIL-induced apoptosis. (B) Caspase-8 and caspase-3/7 activity assay in A549 cells transfected with control miR or miR-148a after TRAIL treatment (100 ng/mL) over a 4-h time period. (C) Western blot showing PARP-1 activation after 6 h TRAIL treatment (100 and 200 ng/mL) in A549 cells transfected with control miR or miR-148a. (D) Annexin-V staining showing increased sensitivity of Calu-1 cells to TRAIL-induced apoptosis 48 h after being transfected with miR-148a. Cells were treated with 1 μg/mL TRAIL. M2 is percentage of apoptotic cells. (E) Proliferation assay in H460 cells transfected with control or MMP15 cDNA after TRAIL treatment (25 and 50 ng/mL). (F) Caspase-3/7 activity assay in H460 cells after MMP15 overexpression and TRAIL treatment. Cells overexpressing MMP15 showed resistance to TRAIL-induced apoptosis. (G) Western blot showing caspase-8 activation after 3-h TRAIL treatment (25 and 50 ng/mL) in H460 cells transfected with control or MMP15 cDNA. Data are presented as ± SD; *P < 0.05 and **P < 0.01 by Student’s t test.
Fig. S2.

miR-148a induces TRAIL sensitivity by targeting MMP15. (A) Proliferation assay in Calu-1 cells transfected with a scrambled miR or miR-148a for 48 h followed by 24 h of TRAIL treatment (400 ng/mL). Cells expressing higher levels of miR-148a showed reduced cell viability after TRAIL treatment. (B) Caspase-3/7 activity assay in Calu-1 cells transfected with control miR or miR-148a after TRAIL treatment (400 ng/mL). (C) Caspase-8 activity assay in H292 TRAIL-sensitive cells transfected with empty vector or MMP15 plasmid followed by TRAIL treatment (25 or 50 ng/mL) for 3 h. Cells expressing MMP15 showed reduced caspase-8 activation after TRAIL treatment. Proliferation assay (D) and caspase-3/7 (E) activity assay in H460 cells transfected either with an empty vector or ROCK1 plasmid. ROCK1 overexpression was not able to protect H460 cells from TRAIL-induced apoptosis. Data are presented as ± SD; *P < 0.05 and **P < 0.01 by Student’s t test. ns, not significant.
Demethylation of miR-148a Enhances TRAIL Sensitivity.
miR-148a is located in close proximity to two CpG islands and has been observed to be hypermethylated in gastric cancer and other metastatic cancer cells (21, 22). To identify whether miR-148a was aberrantly inhibited by DNA hypermethylation, we treated A549 cells with the demethylating agent, 5-aza-dC, and then analyzed miR-148a expression by qRT-PCR. The expression of miR-148a was significantly increased in A549 after treatment with 5-aza-dC (P < 0.05) compared with controls (Fig. 3A), suggesting that DNA methylation may be involved in the silencing of miR-148a in NSCLC. Next, we performed an apoptosis assay on 5-aza-dC–treated A549 and H1299 cells after TRAIL treatment. The cells showed an increased sensitivity to TRAIL after treatment with 5-aza-dC, as assessed by caspase-3/7 assay (Fig. 3B and Fig. S3A). Also 5-aza-dC treatment followed by TRAIL led to PARP-1 cleavage and caspase-8 activation (Fig. 3C and Fig. S3B). Therefore, the use of a demethylating agent improved the response to TRAIL-induced apoptosis, at least in part by up-regulating miR-148a.
Fig. 3.
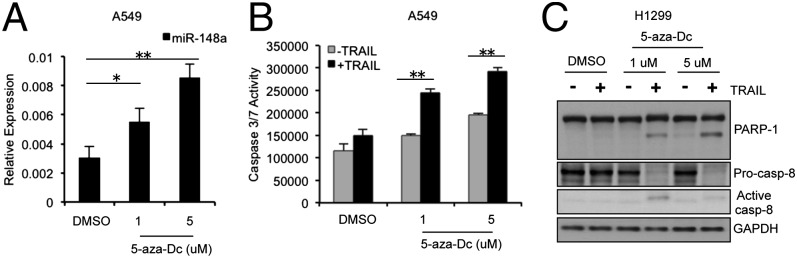
Hypermethylation of miR-148a is involved in resistance to TRAIL-induced apoptosis. (A) qRT-PCR showing miR-148a expression in A549 cells after treatment with 5-aza-dC (1 μM and 5 μM) for 72 h. (B) Caspase-3/7 assay after treatment of A549 cells with 5-aza-dC followed by TRAIL (100 ng/mL). (C) Western blot showing PARP-1 and caspase-8 activation after 3-h TRAIL treatment (100 ng/mL) in H1299 cells treated with 5-aza-dC for 72 h. After treatment with 5-aza-dC, NSCLC cells showed increased sensitivity to TRAIL-induced cell death as indicated by increased caspase-3/7 activity and PARP-1 and caspase-8 cleavage. Data are presented as ± SD; *P < 0.05 and **P < 0.01 by Student’s t test.
Fig. S3.

Demethylation can sensitize cells to TRAIL-induced cell death. (A) Caspase-3/7 assay after 72-h treatment of H1299 cells with 5-aza-dC followed by TRAIL (100 ng/mL). (B) Western blot showing PARP-1 cleavage after 6-h TRAIL treatment (100 ng/mL) in A549 cells treated with 5-aza-dC for 72 h. After treatment with 5-aza-dC, cells showed increased sensitivity to TRAIL-induced cell death as indicated by increased-3/7 activity and PARP-1 cleavage. Data are presented as ± SD; *P < 0.05 and **P < 0.01 by Student’s t test.
MiR-148a Inhibits Migration and Invasion in NSCLC.
Next, we performed cell migration and invasion assays to analyze the effects of miR-148a overexpression or MMP15 and ROCK1 silencing on lung tumorigenesis. A549 and H1299 cells were seeded into the migration chambers 48 h after transient transfection with miR-148a and migration/invasion were measured after 24 h. Interestingly, we observed a significant decrease in the migratory and invasive capabilities of miR-148a–overexpressing cells (Fig. 4A and Fig. S4A). To study the effect of TRAIL on miR-148a regulated migration and invasion, we treated A549 cells expressing miR-148a with TRAIL with or without combined knockdown of TRAIL receptors (DR4 and DR5) and performed migration and invasion assays. We observed that the control cells showed increased migration and invasion on exposure to TRAIL (Fig. 4B), and this effect was suppressed when the TRAIL receptors were down-regulated. However, A549 cells with miR-148a overexpression showed an inhibitory effect on cell migration and invasion regardless of the presence or absence of TRAIL. MMP15 and ROCK1 silencing also suppressed migration and invasion in A549 cells (Fig. S4 B and C). Of note, when Calu-1 and A549 cells were transfected with both miR-148a and MMP15 or ROCK1 cDNA expression vectors, the decrease in cell migration and invasion was drastically reversed (Fig. 4 C and D and Fig. S4 D and E), suggesting that miR-148a plays a major role in inhibiting cancer cell motility and invasion via targeting MMP15 and ROCK1.
Fig. 4.

miR-148a inhibits A549 cell migration and invasion through MMP15 and ROCK1 down-regulation. (A) Transwell migration and invasion assays. A549 cells transfected with control miR or miR-148a were seeded onto transwell chambers 48 h after transfection and migration, and invasion were analyzed 24 h and 48 h later. miR-148a overexpression inhibited A549 cell migration and invasion. (B) Migration and invasion assays were conducted by using A549 cells expressing a control miR or miR-148a with or without the silencing of DR4 and DR5 and/or TRAIL (100 ng/mL) treatment. The cells were seeded onto transwell chambers, and cell migration and invasion were analyzed. (C) Migration assay carried out on Calu-1 cells cotransfected with miR-148a and control or MMP15 or ROCK1 cDNAs. MMP15 and ROCK1 significantly rescued inhibition of cell migration induced by miR-148a in A549 cells. (D) Calu-1 cells were cotransfected with miR-148a and control or MMP15 or ROCK1 cDNA. MMP15 and ROCK1 significantly rescued inhibition of cell invasion induced by miR-148a in Calu-1 cells. All values were measured in RFU (485/520 nm) and normalized by using values from corresponding controls. Data are presented as ± SD; **P < 0.01 by Student’s t test.
Fig. S4.

MMP15 and ROCK1 overexpression rescues miR-148a-mediated inhibition of migration and invasion. (A) H1299 cells transfected with a control miR or miR-148a were seeded onto transwell chambers 48 h after transfection, and migration and invasion were measured 24 h and 48 h later. miR-148a overexpression inhibited A549 cell migration and invasion. (B) A549 cells were seeded onto the migration chambers 48 h after transfection with a control or MMP15 siRNAs, and migration and invasion were analyzed 24 and 48 h later. MMP15 down-regulation significantly inhibited A549 migration and invasion. (C) A549 cells were seeded onto the migration chambers 48 h after transfection with a control or ROCK1 siRNAs, and migration and invasion were analyzed 24 and 48 h later. The assay showed reduced cell migration and invasion in ROCK1 knockdown compared with control cells. (D) Migration assay was carried out in A549 cells cotransfected with miR-148a or MMP15/ROCK1 cDNAs. MMP15 and ROCK1 rescued the inhibition of cell migration by miR-148a in A549 cells. (E) Invasion assay was carried out in A549 cells cotransfected with miR-148a or MMP15/ROCK1 cDNAs. MMP15 and ROCK1 rescued the inhibition of cell invasion by miR-148a in A549 cells. All values are measured in RFU (485/520 nm) and normalized in some cases by using values from corresponding controls. Data are presented as ± SD; *P < 0.05 and **<0.01 by Student’s t test.
Effect of miR-148a in Lung Tumorigenicity in Vitro and in Vivo.
To analyze the tumor suppressor effect of miR-148a in NSCLC, we stably infected A549 and Calu-1 cells with a GFP lentivirus construct that was either empty or contained full-length precursor isoform of miR-148a. Up-regulation of miR-148a was confirmed by qRT-PCR (Fig. S5 A and B). miR-148a was able to suppress colony formation in A549 and Calu-1 cells (Fig. 5 A and B) but did not affect the cell cycle or proliferation rate (Fig. S5 C and D). The effect of miR-148a on metastatic potential was analyzed by performing an anchorage-independent soft agar colony assay. A549 cells transfected with miR-148a alone or along with MMP15 or ROCK1 were plated on soft agar. After 6 d, the number of colonies in soft agar were quantified using 3-(4,5-dimethylthiazol-2-yl)-2,5-diphenyltetrazolium bromide (MTT) assay. miR-148a inhibited anchorage-independent growth, and this effect was reversed by MMP15 or ROCK1 overexpression (Fig. 5C). We also performed a soft agar colony assay for A549 cells expressing empty vector and miR-148a with or without knockdown of DR4 and DR5 after TRAIL treatment. In the control cells, TRAIL treatment resulted in increased anchorage-independent growth, and this effect was inhibited by knockdown of the death receptors. Interestingly, miR-148a–overexpressing cells repressed growth in the presence of both TRAIL and TRAIL neutralizing conditions (Fig. 5D). To investigate the role of miR-148a in vivo, A549-miR-148a and A549-control cells were injected s.c. into the flank of nine nude mice per group and tumor growth was measured for up to 50 d after injection. The overexpression of miR-148a resulted in a significant decrease in tumor growth (Fig. 5E) and increased tumor-free survival (Fig. 5F).
Fig. S5.

miR-148a overexpression does not affect the cell cycle. (A and B) qRT-PCR showing miR-148a expression in A549 and Calu-1 cells stably infected with an empty vector or miR-148a lentiviruses. (C) Cell cycle analysis was performed by using PI staining in A549 cells stably expressing a miRNA control, miR-148a alone, and miR-148a plus MMP15 or ROCK1 cDNA. (D) MTS assay showing rate of proliferation of A549 cells transfected with a scrambled miRNA or miR-148a. Data are presented as ± SD; **P < 0.01 by Student’s t test. ns, not significant.
Fig. 5.

Effect of miR-148a in lung tumorigenesis in vivo. (A) Clonogenic assay on A549 infected with empty vector or miR-148a lentiviruses. The assay was performed three times. Representative plates are shown. (B) Clonogenic assay on A549 and Calu-1 cells infected with control or miR-148a lentiviruses. Columns indicate number of colonies derived from 2,000 cells plated after 2 wk in culture. Data are presented as ± SD. (C) Anchorage-independent (soft agar) colony formation in A549 cells transfected with miR-148a alone or with MMP15 or ROCK1. miR-148a inhibited colony formation on soft agar by targeting MMP15 and ROCK1, and overexpression of MMP15 or ROCK1 reversed this effect. Data are presented as ± SD. (D) Anchorage-independent (soft agar) colony formation in A549 cells transfected with miR-148a alone or after knockdown of DR4 and DR5 and/or TRAIL treatment. TRAIL increased colony formation, but this effect was inhibited by miR-148a overexpression. Data are presented as ± SD. (E) Growth curve of engrafted tumors in nude mice injected with A549 cells stably infected with empty vector or miR-148a lentiviruses. Data are presented as ± SEM. (F) Tumor-free survival probability curve of nude mice injected with A549 cells stably infected with empty vector or miR-148a lentiviruses. *P < 0.05 and **P < 0.01 by Student’s t test.
We then analyzed the expression of miR-148a in 14 sets of lung tumor samples and normal lung tissues. As seen in Fig. 6A, miR-148a expression is negligible in lung tumor samples but highly expressed in normal lung tissues. The expression of MMP15 and ROCK1 in these tumor sets was then checked by using Western blot (Fig. 6B). Interestingly, most tumor samples showed high expression of MMP15 (12 of 14) and ROCK1 (10 of 14) and low expression of miR-148a (13 of 14) (Fig. S6) compared with the corresponding normal tissue samples. Upon examination of data available on ONCOMINE (23), we found several datasets (24–26) that indicate that both MMP15 and ROCK1 are significantly up-regulated in lung cancer compared with corresponding normal tissues (Fig. 6 C and D). These in vivo data substantiated our in vitro studies on the importance of miR-148a as a regulatory factor in lung cancer progression and chemoresistance.
Fig. 6.

miR-148a expression is inversely correlated to MMP15 and ROCK1 protein expression in NSCLC tumor sets. (A) qRT-PCR showing reduced expression of miR-148a in 14 pairs of tumors compared with the normal counterparts. (B) Western blot showing MMP15 and ROCK1 expression in paired sets of tumors. The band intensities were quantified by using ImageJ software, and the relative values were obtained and normalized by using values from Vinculin and their corresponding controls. (C and D) Box plots of data mined from the Oncomine datasets showing MMP15 and ROCK1 expression levels respectively in normal tissues and lung cancer samples plotted on a log scale. **P < 0.01 by Student’s t test.
Fig. S6.

Analysis of miR-148a, MMP15, and ROCK1 expression in paired lung tumor and normal tissues. Tables reporting the percentage of tumors with high or low expression of miR-148a and/or its targets (MMP15 or ROCK1) relative to the corresponding normal tissue expression.
Discussion
TRAIL targets cancer cells while leaving normal cells unharmed, but many human cancer cell lines show either innate or acquired resistance to TRAIL-induced apoptosis and the mechanism of such resistance is not clear. To investigate mechanisms involved in TRAIL resistance, we compared the miRNA expression profile in NSCLC cell line with acquired TRAIL resistance (H460R), previously generated in our laboratory, versus the parental TRAIL-sensitive (H460S) cells. Among the different miRNAs that were down-regulated in H460R cells, we focused on miR-148a because it exhibited the highest fold change (20). We found that miR-148a is drastically down-regulated not only in cells with acquired TRAIL resistance but is also weakly expressed in cells with primary TRAIL resistance. To further analyze the functional role of miR-148a in lung cancer, we investigated its potential gene targets. We identified and confirmed MMP15 and ROCK1 as targets of miR-148a. MMP15 is an antiapoptotic protein whose down-regulation has been previously shown to increase the response to TRAIL-induced apoptosis (13). Both MMP15 and ROCK1 have important roles in tumor cell migration and invasion. MMP15 is involved in promoting tumor invasiveness in gliomas (27). ROCK1 is required for anchorage-independent growth and invasion in NSCLC (28). Overexpression of miR-148a or MMP15 silencing increased the sensitivity to TRAIL-induced apoptosis. These results further corroborated our previous work showing that TIMP3, an inhibitor of MMPs activity, improves the response of NSCLC cells to TRAIL (7). It has previously been reported that MMP15-induced TRAIL resistance through the activation of MMP2 and several studies have already shown that inhibition of MMP2 can activate apoptosis-related pathways in various cancer cells lines, including A549 (29–32). As expected, knockdown of MMP15 in A549 cells reduced MMP2 activity (Fig. S7A). Furthermore, silencing of MMP2 in A549 cells increased caspase-3/7 activation in response to TRAIL (Fig. S7B). We also demonstrated that the effect of miR-148a on TRAIL response is only MMP15- and not ROCK1-dependent.
Fig. S7.
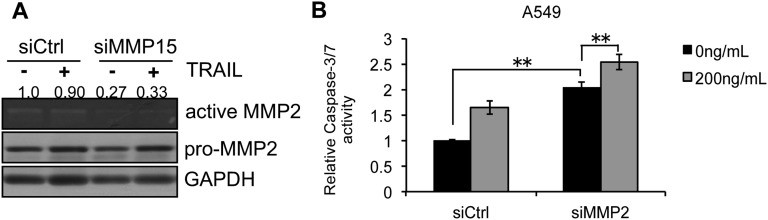
MMP15 is involved in MMP2 activation. (A Top) Zymogram showing level of active secreted MMP2. (Middle) Western blot showing level of endogenous MMP2. (Bottom) Western blot of housekeeping gene GAPDH. Knockdown of MMP15 reduced the level of active MMP2 as seen from the zymogram. The band intensities were quantified by using ImageJ software, and the relative values were obtained by using values from the control. (B) Caspase-3/7 activity assay in A549 cells transfected with control siRNA or MMP2 siRNA after TRAIL treatment (200 ng/mL). Data are presented as ± SD; **P < 0.01 by Student’s t test.
Several studies have confirmed that miR-148a acts as tumor suppressor in different tumors. miR-148a silencing resulted in stimulation of tumor cell motility through activation of targets like Wnt10B in cancer-associated fibroblasts (33). miR-148a is also known to be a potential prognostic biomarker functioning as a tumor suppressor in gastric cancer (21, 34, 35). It regulates cell survival in human pancreatic ductal adenocarcinomas by targeting CDC25B (36), and its expression promotes apoptosis in colorectal cancer by targeting BCL2 (37). Moreover, miR-148a attenuates drug resistance in hormone-refractory drug-resistant prostate cancer cells and esophageal adenocarcinoma cells (38, 39). TRAIL signaling induces protumorigenic effects such as an increase in cell proliferation, migration, and invasion in some resistant cell lines (40, 41). We found that TRAIL induced an increase in migration and invasion in resistant A549 cells, and this effect depended on the death receptors DR4 and DR5. Interestingly, miR-148a enforced expression decreased migration and invasion of NSCLC cells regardless of the TRAIL receptors status through the down-regulation of both ROCK1 and MMP15.
DNA methylation-associated silencing of miR-148a expression has been identified in human cancer cell lines established from lymph node metastasis of colon, melanoma, and head and neck cancer, suggesting a role in the development of metastasis (22). In this study, we reported that treatment of A549 and H1299 cells with the demethylating agent 5-aza-dC led to increased expression of miR-148a and, accordingly, to increased apoptosis and PARP-1 and caspase-8 cleavage, indicating that miR-148a methylation could increase the resistance of lung cells to TRAIL. Importantly, we found an inverse correlation between miR-148a and its targets in vitro and in vivo in a cohort of lung tumors. Finally, we further confirmed a tumor suppressor role for miR-148a in vivo by injecting A549 stably infected with miR-148a into nude mice. A decrease in tumor burden in miR-148a overexpressing tumors was observed. Interestingly, seven of nine mice injected with A549 cells stably overexpressing miR-148a were tumor free for the period of the experiment. miR-148a overexpression not only decreased tumor growth but also increased the probability of tumor-free survival. In summary, we demonstrated an important role of miR-148a in the response of NSCLC to TRAIL-induced apoptosis and in tumorigenesis of NSCLC. Our results suggest that miR-148a could be used as prognostic and therapeutic tool in lung cancer.
Materials and Methods
Cell culture, chemicals, luciferase assay, and other standard methods are described in SI Materials and Methods and primers used for luciferase constructs are described in Table S1.
Table S1.
Primers for luciferase reporter constructs and mutants for MMP15 and ROCK1 3′ UTRs
| Primer name | Sequence |
| ROCK1 FW1 | 5′ TCTAGATTCAGCAAGTTTGGGGAATGGGAG 3′ |
| ROCK1 REV1 | 5′ TCTAGAGGCACTAAAAGGACAATGCAACCC 3′ |
| ROCK1 FW2 | 5′ TCTAGACCTCCTCAGTAATTTATAATGGCTTTGCAG 3′ |
| ROCK1 REV2 | 5′ TCTAGAACACATTGCAGTAAAAATTAAAGATACCCA 3′ |
| ROCK1 M1 FW | 5′GACATTAAGTTAACAAACATATAAGAAATGTATTTGAAATGTAAATTATTCTTAGAACACTTC 3′ |
| ROCK1 M1 REV | 5′GAAAGTGTTCTAAGAATAATTTACATTTCAAATACATTTCTTATATGTTTGTTAACTTAATGTC 3′ |
| ROCK1 M2 FW | 5′ CATGTTTCAAGTGGTATTGAAAGCCGGATATGTAATAATAAACATATCTG 3′ |
| ROCK1 M2 REV | 5′ CAGATATGTTTATTATTACATATCCGGCTTTCAATACCACTTGAAACATG 3′ |
| MMP15 FW | 5′ TCTAGAAAGGAGCCCATTGTGGCCTAAGAGG 3′ |
| MMP15 REV | 5′ TCTAGATGCCGGCTGTACAATTTATT 3′ |
| MMP15 M1 FW | 5′CCCATACATTTATTTCTGTAAATAATGAATAAATTGTACAGCCGGCATCTA 3′ |
| MMP15 M1 REV | 5′TAGATGCCGGCTGTACAATTTATTCATTATTTACAGAAATAAATGTATGGG 3′ |
| MMP15 M2 FW | 5′-CGAGTGGTTTCTTGGCACCAAGTGCGGG-3′ |
| MMP15 M2 REV | 5′-CCCGCACTTGGTGCCAAGAAACCACTCG-3′ |
Target Analysis.
The programs TargetScan (www.targetscan.org) and Pictar (pictar.mdc-berlin.de/) were used to perform Bioinformatics analysis.
Cell Death and Cell Proliferation Assay.
Cells were seeded in 96-well plates in triplicate and incubated at 37 °C in a 5% CO2 incubator (ATCC). Recombinant TRAIL was used as described in figure legends. Viability of cells was examined with MTT-Cell Titer 96 AQueous One Solution Cell Proliferation Assay (Promega), according to the manufacturer’s protocol. Metabolically active cells were detected by adding 20 μL of the reagent to each well. After 1 h of incubation, the plates were analyzed in a Multilabel Counter (Bio-Rad Laboratories). Apoptosis was assessed by using Annexin V-FITC apoptosis detection kits followed by flow cytometric analysis and using caspase-3/7 activity assay. For Annexin-FITC assay, Calu-1 cells were seeded at 1 × 10⁵ cells per 60-mm dish, grown overnight, and then transfected with precursor miR-148a or scrambled oligonucleotides for 48 h. The cells were then treated for 24 h with 1 μg/mL TRAIL. Following incubation, cells were washed with cold PBS and removed from the plates by trypsinization. The resuspended cells (105) were washed with cold PBS and stained with FITC-conjugated Annexin V antibody according to the manufacturer’s instructions (Trevigen). The samples were then analyzed by using FACScan (FACScalibur; BD Biosciences) with the CellQuest software (BD Biosciences). At least 10,000 events were analyzed and compared with control. The fraction of Calu-1 cells treated with TRAIL was taken as the apoptotic cell population. The percentage of apoptosis indicated was corrected for background levels found in the corresponding untreated controls. For detection of caspase-8 and caspase-3/7 activity, cells were cultured in 96-well plates and treated with TRAIL and analyzed by using Caspase-Glo Assay kits (Promega) according to the manufacturer’s instructions.
5-aza-2′-Deoxycytidine Treatment.
A stock solution of 10mM 5-aza-2′-deoxycytidine (5-aza-dC) was prepared in DMSO. A549 and H1299 cells were treated for 72 h with 1 and 5 μM 5-aza-dC, and total RNA was extracted for qRT-PCR. Cells treated with 5-aza-dC were plated in 96-well plates and then treated with TRAIL (100 ng/mL) for 3–6 h for caspase-3/7 activity assay and Western blot.
Migration and Invasion Assays.
Assays were performed following manufacturer’s protocol (EMD Millipore). InnoCyte cell migration and invasion assays were used. Briefly, cells were seeded in the upper chambers in serum-free media and serum-containing media was added to the lower chambers as chemoattractant. Cells that migrated/invaded to the lower chambers were dislodged and stained with a fluorescent dye. Fluorescence was measured with an excitation wavelength of ∼485 nm and an emission wavelength of ∼520 nm.
Generation of Stable Clones.
A549 and Calu-1 cells were stably infected with Human premiRNA Expression Construct Lenti-miR expression plasmid containing the full-length miR-148a and the GFP gene under the control of two different promoters (System Biosciences). An empty vector was used as control. PremiR-148a and control constructs were packaged with pPACKH1 Lentivector Packaging Plasmid mix (System Biosciences) in a HEK293TN packaging cell line. Viruses were concentrated by using PEGit Virus Precipitation Solution (SBI). Infected cells were selected by FACS analysis (FACSCalibur; BD Biosciences). Infection efficiency >90% was verified by fluorescent microscopy and confirmed by real-time PCR for miR expression.
Clonogenic Assay.
A total of 2,000 cells each (A549-empty, A549-miR-148a, Calu-1-empty, Calu-1-miR-148a) were seeded into 100-mm plates in triplicates. Two weeks later, the cells were fixed with 4% (wt/vol) paraformaldehyde and stained with crystal violet for 30 min. The colonies with diameters of more than 1.5 mm were counted.
Anchorage-Independent Growth Assay.
A549 cells were seeded into 60-mm plates and transfected with premiR-148a alone or with MMP15 overexpression or ROCK1 overexpression plasmid for 48 h. The cells were then trypsinized and plated onto a 96-well plate with soft agar by using Cytoselect 96-Well In Vitro Tumor Sensitivity Assay (Soft Agar Colony Formation) (Cell Biolabs). The assay was carried out according to the manufacturer’s protocol and the colony formation was detected by using MTT solution.
In Vivo Experiments.
Animal studies were performed according to institutional guidelines. We used A549-empty and A549-miR-148a stably infected cells. Four- to six-week-old male athymic nu/nu mice (Harlan) were used in this study. Mice were anesthetized, and 7.5 × 10⁶ cells were s.c. injected into the right flanks of the mice. Tumor size was measured every 3–5 d by a digital caliper. Tumor volumes were determined by measuring length (l) and width (w) and then calculating the volume (V = lw2/2). Thirty days after tumor initiation, the mice were euthanized. Animal experiments were conducted after approval of the Institutional Animal Care and Use Committee, Ohio State University.
Statistical Analysis.
Continuous variables are expressed as mean values ± SD. Student’s t test was used to determine significance. P < 0.05 was considered significant.
SI Materials and Methods
Cell Culture, Transfection, and Chemicals.
A549, H460, H1299, and HEK293TN cells were seeded and grown in Roswell Park Memorial Institute (RPMI) 1640 Medium with 10% (vol/vol) FBS and Calu-1 cells in Dulbecco’s modified Eagle medium with 10% (vol/vol) FBS, l-glutamine and antibiotics (Invitrogen). All transfections were performed by using Lipofectamine 2000 (Invitrogen) as suggested by the manufacturer. All cell lines used were cultured to 50–60% confluence in 60-mm plates with a serum-free medium without antibiotics and then transfected with 100 nmol premiR-148a oligonucleotides or negative control for 48–72 h (Ambion). pGL3 control MMP15 3′-UTR, pGL3 control MMP15 3′-UTR-mutated, pGL3 control ROCK1 3′ UTR, and pGL3 control ROCK1 3′-UTR-mutated were transfected as described later in the luciferase assay section. Recombinant TRAIL was used as described in the figure legends. We used siRNA MMP15, siRNA ROCK1, and siRNA negative control (Dharmacon) to transfect A549 cell line. The cells were transfected by using the same method described above for premiR-148a. We used MMP15 cDNA expression vector and ROCK1 cDNA expression vector (both Fisher Scientific) and pCDNA control vector to transfect A549 cell lines. Tissue samples were provided by the Cooperative Human Tissue Network–Midwestern Division, which is funded by the National Cancer Institute. Other investigators may have received specimens from the same subjects.
Luciferase Assay.
The 3′ UTRs of MMP15 and ROCK1 have two binding sites each for miR-148a. To generate luciferase reporter constructs, the 3′-UTR of the respective target was amplified by PCR and cloned downstream of the luciferase-coding sequence in the pGL3-control vector at the XbaI restriction site (Promega). The MMP15 sites are 114 bp apart and were cloned into one vector. However, the ROCK1 sites were 539 bp apart and were cloned into two separate vectors. Mutations were introduced into the miRNA-binding sites by using the QuikChange Mutagenesis Kit (Stratagene). The MMP15 mutant was generated by first deleting one site in the construct and then using a second set of primers to delete the second site. Two separate ROCK1 mutants were generated, each with a deletion of only one binding site. The primers used for generating the reporter constructs and mutants are available in Table S1. A549 cells were transfected with Lipofectamine 2000 (Invitrogen), 1 μg of pGL3-control containing wild type 3′-UTR or mutated 3′-UTR, 200 ng of Renilla luciferase expression construct (Promega) and 100 nM premiR-148a oligonucleotides or scrambled negative control. After 24 h, cells were lysed and assayed with Dual Luciferase Assay (Promega) according to the manufacturer’s instructions.
RNA Extraction.
Total RNA was extracted with TRIzol solution (Invitrogen), and the integrity of RNA was assessed with an Agilent BioAnalyzer 2100 (Agilent).
Real-Time PCR.
Real-time PCR was performed by using a standard TaqMan PCR Kit protocol on an Applied Biosystem 7900HT Sequence Detection System (Applied Biosystems). The 10-μL PCR included 0.67 μL of RT product, 1 μL of TaqMan Universal PCR Master Mix (Applied Biosystems), 0.2 mM TaqMan probe, 1.5 mM forward primer, and 0.7 mM reverse primer. The reactions were incubated in a 96-well plate at 95 °C for 10 min, followed by 40 cycles of 95 °C for 15 s and 60 °C for 1 min. All reactions were run in triplicate. The threshold cycle (Ct) is defined as the fractional cycle number at which the fluorescence passes the fixed threshold. The comparative Ct method for relative quantization of gene expression (Applied Biosystems) was used to determine miRNA expression levels. The y axis represents the 2(ΔΔCt), or the relative expression of different miRs. miRs expression was calculated relative to U44 and U48 rRNA. For each data point, experiments were carried out in triplicate and data were analyzed by using software (Bio-Rad).
Western Blot Analysis.
A549 cells were seeded and grown in RPMI with 10% (vol/vol) FBS in 60-mm dishes. The cells were harvested 72 h after transfection and subjected to lysis in radioimmunoprecipitation assay buffer (150 mM NaCl, 50 mM Tris⋅HCl, pH 7.5, 1% Triton, 0.1% SDS, 0.5% sodium deoxycholate, and Protease Inhibitors). Equal amounts of protein lysates (50 μg each) and molecular weight marker (Bio-Rad Laboratories) were separated by using 4–20% (wt/vol) SDS/PAGE gels and then electro-transferred to nitrocellulose membranes. The membranes were blocked with a buffer containing 5% (wt/vol) nonfat dry milk in Tris-buffered saline with 0.1% Tween-20 (TBS-T) for 2 h and incubated overnight with antibodies at 4 °C. After a second wash with TBS-T, the membranes were incubated with peroxidase-conjugated secondary antibodies (GE Healthcare, Amersham) and then developed with an enhanced chemiluminescence detection kit (Pierce). HRP-conjugated GAPDH (loading control), Caspase-8, and PARP-1 antibodies were from Cell Signaling Technologies. ROCK1 and MMP15 antibodies were from Novus Biologicals.
Gelatin Zymography.
Gelatin zymography was used to detect MMP2 activity. A549 cells transfected with negative control or MMP15 siRNA were grown in serum-free media. The supernatants were collected after 24 h, concentrated by using centrifugal filter units (EMD Millipore Corporation) and run on Novex zymogram gel. The gel renatured, developed, and finally stained to visualize the bands as per the manufacturer’s protocol (Life Technologies).
Acknowledgments
We thank H. Alder, P. Fadda, and A. Bottoni for qRT-PCR guidance and assistance and J. Ravi for assistance with zymography.
Footnotes
The authors declare no conflict of interest.
This article is a PNAS Direct Submission.
This article contains supporting information online at www.pnas.org/lookup/suppl/doi:10.1073/pnas.1500886112/-/DCSupplemental.
References
- 1.Chen Z, Fillmore CM, Hammerman PS, Kim CF, Wong KK. Non-small-cell lung cancers: A heterogeneous set of diseases. Nat Rev Cancer. 2014;14(8):535–546. doi: 10.1038/nrc3775. [DOI] [PMC free article] [PubMed] [Google Scholar]
- 2.Fesik SW. Promoting apoptosis as a strategy for cancer drug discovery. Nat Rev Cancer. 2005;5(11):876–885. doi: 10.1038/nrc1736. [DOI] [PubMed] [Google Scholar]
- 3.Ambros V. The functions of animal microRNAs. Nature. 2004;431(7006):350–355. doi: 10.1038/nature02871. [DOI] [PubMed] [Google Scholar]
- 4.Bartel DP. MicroRNAs: Genomics, biogenesis, mechanism, and function. Cell. 2004;116(2):281–297. doi: 10.1016/s0092-8674(04)00045-5. [DOI] [PubMed] [Google Scholar]
- 5.Krichevsky AM, King KS, Donahue CP, Khrapko K, Kosik KS. A microRNA array reveals extensive regulation of microRNAs during brain development. RNA. 2003;9(10):1274–1281. doi: 10.1261/rna.5980303. [DOI] [PMC free article] [PubMed] [Google Scholar]
- 6.Calin GA, Croce CM. MicroRNA signatures in human cancers. Nat Rev Cancer. 2006;6(11):857–866. doi: 10.1038/nrc1997. [DOI] [PubMed] [Google Scholar]
- 7.Garofalo M, et al. miR-221&222 regulate TRAIL resistance and enhance tumorigenicity through PTEN and TIMP3 downregulation. Cancer Cell. 2009;16(6):498–509. doi: 10.1016/j.ccr.2009.10.014. [DOI] [PMC free article] [PubMed] [Google Scholar] [Retracted]
- 8.Razumilava N, et al. miR-25 targets TNF-related apoptosis inducing ligand (TRAIL) death receptor-4 and promotes apoptosis resistance in cholangiocarcinoma. Hepatology. 2012;55(2):465–475. doi: 10.1002/hep.24698. [DOI] [PMC free article] [PubMed] [Google Scholar]
- 9.Incoronato M, et al. miR-212 increases tumor necrosis factor-related apoptosis-inducing ligand sensitivity in non-small cell lung cancer by targeting the antiapoptotic protein PED. Cancer Res. 2010;70(9):3638–3646. doi: 10.1158/0008-5472.CAN-09-3341. [DOI] [PubMed] [Google Scholar]
- 10.Acunzo M, et al. miR-130a targets MET and induces TRAIL-sensitivity in NSCLC by downregulating miR-221 and 222. Oncogene. 2012;31(5):634–642. doi: 10.1038/onc.2011.260. [DOI] [PMC free article] [PubMed] [Google Scholar]
- 11.Nagase H, Visse R, Murphy G. Structure and function of matrix metalloproteinases and TIMPs. Cardiovasc Res. 2006;69(3):562–573. doi: 10.1016/j.cardiores.2005.12.002. [DOI] [PubMed] [Google Scholar]
- 12.Chakraborti S, Mandal M, Das S, Mandal A, Chakraborti T. Regulation of matrix metalloproteinases: An overview. Mol Cell Biochem. 2003;253(1-2):269–285. doi: 10.1023/a:1026028303196. [DOI] [PubMed] [Google Scholar]
- 13.Egeblad M, Werb Z. New functions for the matrix metalloproteinases in cancer progression. Nat Rev Cancer. 2002;2(3):161–174. doi: 10.1038/nrc745. [DOI] [PubMed] [Google Scholar]
- 14.Abraham R, et al. Identification of MMP-15 as an anti-apoptotic factor in cancer cells. J Biol Chem. 2005;280(40):34123–34132. doi: 10.1074/jbc.M508155200. [DOI] [PubMed] [Google Scholar]
- 15.Riento K, Ridley AJ. Rocks: Multifunctional kinases in cell behaviour. Nat Rev Mol Cell Biol. 2003;4(6):446–456. doi: 10.1038/nrm1128. [DOI] [PubMed] [Google Scholar]
- 16.Sahai E, Ishizaki T, Narumiya S, Treisman R. Transformation mediated by RhoA requires activity of ROCK kinases. Curr Biol. 1999;9(3):136–145. doi: 10.1016/s0960-9822(99)80067-0. [DOI] [PubMed] [Google Scholar]
- 17.Zohrabian VM, Forzani B, Chau Z, Murali R, Jhanwar-Uniyal M. Rho/ROCK and MAPK signaling pathways are involved in glioblastoma cell migration and proliferation. Anticancer Res. 2009;29(1):119–123. [PubMed] [Google Scholar]
- 18.Somlyo AV, et al. Rho-kinase inhibitor retards migration and in vivo dissemination of human prostate cancer cells. Biochem Biophys Res Commun. 2000;269(3):652–659. doi: 10.1006/bbrc.2000.2343. [DOI] [PubMed] [Google Scholar]
- 19.Kamai T, et al. Significant association of Rho/ROCK pathway with invasion and metastasis of bladder cancer. Clin Cancer Res. 2003;9(7):2632–2641. [PubMed] [Google Scholar]
- 20.Jeon Y-J, et al. A set of NF-κB–regulated microRNAs induces acquired TRAIL resistance in Lung cancer. Proc Natl Acad Sci USA. 2015;112(26):E3355–E3364. doi: 10.1073/pnas.1504630112. [DOI] [PMC free article] [PubMed] [Google Scholar]
- 21.Zhu A, et al. MicroRNA-148a is silenced by hypermethylation and interacts with DNA methyltransferase 1 in gastric cancer. Med Oncol. 2012;29(4):2701–2709. doi: 10.1007/s12032-011-0134-3. [DOI] [PubMed] [Google Scholar]
- 22.Lujambio A, et al. A microRNA DNA methylation signature for human cancer metastasis. Proc Natl Acad Sci USA. 2008;105(36):13556–13561. doi: 10.1073/pnas.0803055105. [DOI] [PMC free article] [PubMed] [Google Scholar]
- 23.Rhodes DR, et al. ONCOMINE: A cancer microarray database and integrated data-mining platform. Neoplasia. 2004;6(1):1–6. doi: 10.1016/s1476-5586(04)80047-2. [DOI] [PMC free article] [PubMed] [Google Scholar]
- 24.Hou J, et al. Gene expression-based classification of non-small cell lung carcinomas and survival prediction. PLoS ONE. 2010;5(4):e10312. doi: 10.1371/journal.pone.0010312. [DOI] [PMC free article] [PubMed] [Google Scholar]
- 25.Okayama H, et al. Identification of genes upregulated in ALK-positive and EGFR/KRAS/ALK-negative lung adenocarcinomas. Cancer Res. 2012;72(1):100–111. doi: 10.1158/0008-5472.CAN-11-1403. [DOI] [PubMed] [Google Scholar]
- 26.Selamat SA, et al. Genome-scale analysis of DNA methylation in lung adenocarcinoma and integration with mRNA expression. Genome Res. 2012;22(7):1197–1211. doi: 10.1101/gr.132662.111. [DOI] [PMC free article] [PubMed] [Google Scholar]
- 27.Zhang J, Sarkar S, Yong VW. The chemokine stromal cell derived factor-1 (CXCL12) promotes glioma invasiveness through MT2-matrix metalloproteinase. Carcinogenesis. 2005;26(12):2069–2077. doi: 10.1093/carcin/bgi183. [DOI] [PubMed] [Google Scholar]
- 28.Vigil D, et al. ROCK1 and ROCK2 are required for non-small cell lung cancer anchorage-independent growth and invasion. Cancer Res. 2012;72(20):5338–5347. doi: 10.1158/0008-5472.CAN-11-2373. [DOI] [PMC free article] [PubMed] [Google Scholar]
- 29.Morrison CJ, et al. Cellular activation of MMP-2 (gelatinase A) by MT2-MMP occurs via a TIMP-2-independent pathway. J Biol Chem. 2001;276(50):47402–47410. doi: 10.1074/jbc.M108643200. [DOI] [PubMed] [Google Scholar]
- 30.Chetty C, Bhoopathi P, Lakka SS, Rao JS. MMP-2 siRNA induced Fas/CD95-mediated extrinsic II apoptotic pathway in the A549 lung adenocarcinoma cell line. Oncogene. 2007;26(55):7675–7683. doi: 10.1038/sj.onc.1210584. [DOI] [PMC free article] [PubMed] [Google Scholar]
- 31.Kesanakurti D, et al. Suppression of MMP-2 attenuates TNF-α induced NF-κB activation and leads to JNK mediated cell death in glioma. PLoS ONE. 2011;6(5):e19341. doi: 10.1371/journal.pone.0019341. [DOI] [PMC free article] [PubMed] [Google Scholar] [Retracted]
- 32.Nyormoi O, Mills L, Bar-Eli M. An MMP-2/MMP-9 inhibitor, 5a, enhances apoptosis induced by ligands of the TNF receptor superfamily in cancer cells. Cell Death Differ. 2003;10(5):558–569. doi: 10.1038/sj.cdd.4401209. [DOI] [PubMed] [Google Scholar]
- 33.Aprelikova O, et al. Silencing of miR-148a in cancer-associated fibroblasts results in WNT10B-mediated stimulation of tumor cell motility. Oncogene. 2013;32(27):3246–3253. doi: 10.1038/onc.2012.351. [DOI] [PMC free article] [PubMed] [Google Scholar]
- 34.Chen Y, et al. Altered expression of MiR-148a and MiR-152 in gastrointestinal cancers and its clinical significance. J Gastrointest Surg. 2010;14(7):1170–1179. doi: 10.1007/s11605-010-1202-2. [DOI] [PubMed] [Google Scholar]
- 35.Guo SL, et al. miR-148a promoted cell proliferation by targeting p27 in gastric cancer cells. Int J Biol Sci. 2011;7(5):567–574. doi: 10.7150/ijbs.7.567. [DOI] [PMC free article] [PubMed] [Google Scholar]
- 36.Liffers ST, et al. MicroRNA-148a is down-regulated in human pancreatic ductal adenocarcinomas and regulates cell survival by targeting CDC25B. Lab Invest. 2011;91(10):1472–1479. doi: 10.1038/labinvest.2011.99. [DOI] [PubMed] [Google Scholar]
- 37.Zhang H, et al. MiR-148a promotes apoptosis by targeting Bcl-2 in colorectal cancer. Cell Death Differ. 2011;18(11):1702–1710. doi: 10.1038/cdd.2011.28. [DOI] [PMC free article] [PubMed] [Google Scholar]
- 38.Fujita Y, et al. MiR-148a attenuates paclitaxel resistance of hormone-refractory, drug-resistant prostate cancer PC3 cells by regulating MSK1 expression. J Biol Chem. 2010;285(25):19076–19084. doi: 10.1074/jbc.M109.079525. [DOI] [PMC free article] [PubMed] [Google Scholar]
- 39.Hummel R, et al. Mir-148a improves response to chemotherapy in sensitive and resistant oesophageal adenocarcinoma and squamous cell carcinoma cells. J Gastrointest Surg. 2011;15(3):429–438. doi: 10.1007/s11605-011-1418-9. [DOI] [PubMed] [Google Scholar]
- 40.Ishimura N, Isomoto H, Bronk SF, Gores GJ. Trail induces cell migration and invasion in apoptosis-resistant cholangiocarcinoma cells. Am J Physiol Gastrointest Liver Physiol. 2006;290(1):G129–G136. doi: 10.1152/ajpgi.00242.2005. [DOI] [PubMed] [Google Scholar]
- 41.Trauzold A, et al. TRAIL promotes metastasis of human pancreatic ductal adenocarcinoma. Oncogene. 2006;25(56):7434–7439. doi: 10.1038/sj.onc.1209719. [DOI] [PubMed] [Google Scholar]