

Significance
The study of laboratory-generated circadian locomotor activity patterns of Drosophila played a critical role in determining how fruitfly (and mammalian) clocks function. However, recent observations of fly activity in the wild challenged many assumptions about how the clock might work. A new prominent summer locomotor component emerged called “A” (afternoon), which replaced the laboratory “siesta.” The A component has been criticized by others to be an artifact, but our study here shows that it is genuine and is observed under a variety of simulated natural conditions. The A component is temperature- and clock-dependent and is generated by expression of the internal transient receptor potential A1 thermosensor (TrpA1), revealing a pathway for environmental input to the clock.
Keywords: circadian, Drosophila, behavior, locomotor, afternoon
Abstract
Under standard laboratory conditions of rectangular light/dark cycles and constant warm temperature, Drosophila melanogaster show bursts of morning (M) and evening (E) locomotor activity and a “siesta” in the middle of the day. These M and E components have been critical for developing the neuronal dual oscillator model in which clock gene expression in key cells generates the circadian phenotype. However, under natural European summer conditions of cycling temperature and light intensity, an additional prominent afternoon (A) component that replaces the siesta is observed. This component has been described as an “artifact” of the TriKinetics locomotor monitoring system that is used by many circadian laboratories world wide. Using video recordings, we show that the A component is not an artifact, neither in the glass tubes used in TriKinetics monitors nor in open-field arenas. By studying various mutants in the visual and peripheral and internal thermo-sensitive pathways, we reveal that the M component is predominantly dependent on visual input, whereas the A component requires the internal thermo-sensitive channel transient receptor potential A1 (TrpA1). Knockdown of TrpA1 in different neuronal groups reveals that the reported expression of TrpA1 in clock neurons is unlikely to be involved in generating the summer locomotor profile, suggesting that other TrpA1 neurons are responsible for the A component. Studies of circadian rhythms under seminatural conditions therefore provide additional insights into the molecular basis of circadian entrainment that would otherwise be lost under the usual standard laboratory protocols.
The circadian clock infiltrates almost every aspect of behavior and physiology of higher organisms and even some bacteria. Most studies of 24-h rhythms are carried out under strictly controlled laboratory conditions, an approach leading to a remarkably informative dissection of the clock, whose main molecular cogs are conserved among vertebrates and insects. Laboratory experiments are often extrapolated to the wild with the assumption that they reflect the natural situation. However, recent seminatural studies in mice, hamsters, and Drosophila have revealed some unexpected findings. For example, the widely held belief from laboratory studies that mice and golden hamsters are nocturnal needs to be revised because in the wild they are predominantly or exclusively diurnal (1, 2). Similarly in Drosophila melanogaster, locomotor rhythms studied in seminatural conditions reveal that deeply held, laboratory-derived assumptions may require significant revision. These include the crepuscular nature of fly activity, the role of the clock in “morning anticipation” and midday “siesta,” the requirement for clock gene expression in the central clock neurons for entrainment, and the role of light/dark (LD) cycles as the most important environmental Zeitgeber (“time giver”) in entraining the clock (3).
Vanin et al. (3) observed that in the wild the phase of various features of circadian locomotor behavior such as the morning (M) and evening (E) components was best predicted by temperature, rather than “anticipation” of dawn and dusk over the seasonal LD cycle. In addition, at the warmer temperatures of European summers, flies did not generate an afternoon (A) siesta as in the laboratory. Instead, they dramatically increased their activity so that the major component of their locomotor profile was now the newly described A peak. The phase of the A component was modulated by mutation at the period (per) locus, suggesting that A represented a clock-mediated escape response from heat-induced stress (3, 4). Most surprisingly, null mutants of the negative regulators of the circadian clock period (per01) and timeless (tim01) exhibited naturally entrained behavioral profiles largely indistinguishable from those of wild-type strains. In sharp contrast, under laboratory conditions of constant 25 °C temperature and rectangular LD cycles, per01 and tim01 flies show no anticipation of dawn/dusk, and these mutants simply react to light-on or light-off signals with startle effects (5). The anticipatory nature of the M and E components in the laboratory led directly to the development of the dual oscillator model in the fly in which the Pigment Dispersing Factor (PDF) expressing s-LNv and l-LNvs (small and large lateral ventral neurons) generate the M locomotor component, whereas the dorsal lateral neurons, LNds, and dorsal neurons, DNs, produce the E component (6, 7).
Although Vanin et al. focused predominantly on the phases of the major locomotor components under natural lighting and thermal conditions (3), in a similar natural study, Menegazzi et al. suggested that although per null mutants look similar in their behavioral phasing to wild type, the A peak tends to be larger in per01 mutants (4). These authors suggested that PER normally serves to reduce the amount of “inappropriate” activity that occurs during the warmest part of the day (4). Although their results were based on a very small sample of flies on a few days of recording, they were nevertheless welcomed in that they revealed that possessing a wild-type clock appeared to be behaviorally adaptive compared with having a severely disturbed clock.
Another study performed under seminatural conditions at tropical latitudes has questioned the validity of the A component (8). These authors suggest instead that A represents a behavioral artifact as a result of flies avoiding the midday sun by sheltering in the shaded part of the glass activity tube where the TriKinetics infrared detectors are located, leading to inappropriate triggering of the sensor and high activity counts. In apparent support of this model, they observed that flies in open-field Petri dish arenas did not show an A component under summer conditions, although this interpretation has been criticized (9), in part because Petri dishes are well known to be problematic for Drosophila open-field behavioral recordings (10).
Given the interest generated by Vanin et al. (3), we have revisited these natural studies and extended them with more sophisticated simulations of natural temperature and light cycles in the laboratory. By using video recordings of fly circadian activity in glass tubes and open-field arenas, we investigate whether the A component is an artifact. Furthermore, in both the Vanin et al. (3) and the Menegazzi et al. (4) studies, the classic per mutants were congenic with each other but were compared with three different wild-type strains so genetic background was not controlled. Using congenic controls we reexamine whether we can observe a phenotype for arrhythmic mutants in simulated seminatural conditions. Finally we study the A peak in a range of photoreceptor and thermoreceptor mutants to investigate the underlying genetic and neuroanatomical basis for this newly identified summer element of circadian behavior.
Results
The A Component Is Not an Artifact.
Fig. 1A shows the locomotor profile of Houten (HU) wild-type flies using TriKinetics monitors recorded in the wild on an Italian summer’s day with naturally varying temperature and light cycles (max., 840 lx; mean temperature, 29.7 °C). Fig. 1B illustrates the results from HU flies in the standard laboratory paradigm at a constant temperature of 30 °C in rectangular 700 lx LD cycles (LD16:8). The main difference between the two figures is the presence of the A component. By simulating a warm Italian midsummer day using smooth changes in temperature (25–35 °C; Fig. S1A) and light intensity (max., 500 lx; Fig. S1B), we were able to induce an activity profile with clear M, A, and E components (Fig. 1C) very similar to that observed in the wild (Fig. S1 C and D). As in the wild, the A peak is not prominently expressed with a 20–30 °C thermal cycle (Fig. S1 E and F).
Fig. 1.

Natural simulations in the laboratory support the existence of an A component. (A) Flies recorded in the wild (n = 9 male HU recorded July 28, 2007; day mean temperature, 29.7 °C; max light, 842 lx) clearly reveal the additional and major afternoon (A, black) peak of activity (mean activity ± SEM). (B) Standard laboratory conditions at constant 30 °C, LD16:8 (32 male HU, LD 700 lx) reveal no A peak. (C–E) Step-free seminatural simulation reveals M, A, and E peaks of activity, whether measured in tubes using TriKinetics monitors (C, n = 32) or with virtual beam crossing analysis (D; n = 9, plotted as mean ± SEM of three replicates) or measured in open-field arenas (E; total distance traveled by four male and four female flies, averaged across three replicates).
Fig. S1.

Comparisons of natural and simulated light, temperature, and resulting ALA activity profiles. (A) Temperature profile in the wild (average of 3 consecutive days normalized to maximum value) plotted against datalogger recording from our incubators running the simulated wild temperature profile, R2 = 0.998. (B) Light profile in the wild (average of 3 consecutive days normalized to maximum value) plotted against datalogger recording from our incubators running the simulated wild temperature profile, R2 = 0.977. (C) ALA flies’ activity profiles in the wild on days with approximate temperature ranges of 25–35 °C (n = 15) and 20–30 °C (E, n = 17) compared with our simulated 25–35 °C (D, n = 18) and 20–30 °C (F, n = 27). Data for C and E were taken from the database of Vanin et al. (3).
De et al. (2013) (8) suggested that the A component is an artifact because on warm sunny days the flies seek the shaded area between the emitter and detector in the TriKinetics DAM2 recording system, thereby overactivating the infrared beam that generates the activity counts. Although Vanin et al. (3) recorded their data in completely shaded conditions, we addressed this issue by mounting the glass activity tubes from TriKinetics onto an unshaded white background and recorded infrared video of their activity under seminatural conditions (depicted in Fig. S2). Using ActualTrack software, we simulated a “virtual” light beam across the center of each tube and counted the number of times flies crossed this beam. Our results show that monitoring the flies in this manner results in activity records with clear M, A, and E components (Fig. 1D), contradicting the suggestion that the A component is an artifact of shade within the TriKinetics DAM2 system.
Fig. S2.

Video analysis arenas. Activity arenas used for video analysis recordings: The Left panel shows nine glass activity tubes identical to the ones used in TriKinetics activity monitors mounted over a source of infrared (IR) light. A dashed line indicates the midway point of each tube, which we took as the position of the virtual beam for our ActualTrack analysis. The Right panel shows a circular activity arena as used in this study, with a central core of food.
De et al. (8) further claimed that observations of flies’ open-field behavior in Petri dishes showed an absence of the A component, implying that the A component might only be observed under the restricted spatial environment of the glass tubes (and shade) inherent in the TriKinetics system. We recorded the activity of groups of four male and four female flies in open-field chambers developed by the Dickinson laboratory (11) and used ActualTrack software to determine the total movement of flies recorded under infrared light for 5 of every 30 min under unshaded seminatural conditions. Again the results clearly show the A component as the major part of the locomotor activity profile under simulated warm summer conditions, with M and E components providing smaller contributions (Fig. 1E). Consequently, the A component is observed in TriKinetics monitors, in isolated glass tubes, and in open-field chambers (Fig. 1 A and C–E); indeed, De et al.’s incorrect conclusion was based on a misinterpretation of their own data (Discussion).
Do Arrhythmic Mutants Show Any Locomotor Phenotypes in Seminatural Conditions?
Menegazzi et al. suggested that the amplitude of the A component could be modulated by clock mutations (4). We reinterrogated the extensive Vanin et al. (3) database by dividing the day into those segments that represented M activity (02:30–08:00), A activity (08:00–16:30), and E (16:30–22:00) with night (N) activity falling between 22:00 and 02:30. Data were expressed as a % total daily activity falling within these segments, and all data were taken from Italian summer recordings between June 19 and September 3. We selected days in which the maximum temperature exceeded 31 °C, expecting to observe a strong A response, and correlated each locomotor component with maximum daily temperature (Fig. 2).
Fig. 2.

Relationship between temperature and M, A, and E locomotor components under seminatural conditions. (A) Mean (±SEM) daily % of M activity against the maximum temperature of the previous day; R2 values are not significant (per01, n = 26, R2 = 0.143, P = 0.057; tim01, n = 17, R2 = 0.094, P = 0.231; ALA, n = 34, R2 = 0 .053, P = 0.19; CS, n = 16, R2 = 0.151, P = 0.137), except for HU (n = 16, R2 = 0.473, P = 0.003). (B) Mean daily % A activity against the corresponding day’s maximum temperature. All R2 values are significant (per01, n = 36, R2 = 0.397, P < 0.001; tim01, n = 22, R2 = 0.624, P < 0.001; ALA, n = 49, R2 = 0.508, P < 0.001; CS, n = 20, R2 = 0.728, P < 0.001; HU, n = 20, R2 = 0.54, P < 0.001). (C) Same as B but for mean daily % E activity. All R2 values are significant (per01, n = 36, R2 = 0.623, P < 0.001; tim01, n = 22, R2 = 0.582, P < 0.001; ALA, n = 49, R2 = 0.495, P < 0.001; CS, n = 20, R2 = 0.741, P < 0.001; HU, n = 20, R2 = 0.566, P < 0.001). (D) Locomotor activity under laboratory simulations of a warm summer day (25–35 °C cycles; max light, 500 lx). tim01 shows significantly higher A and lower E than congenic HU. Canton-S shows significantly different M, A, and E than the ALA and HU wild types (see Do Arrhythmic Mutants Show Any Locomotor Phenotypes in Seminatural Conditions? text for full description of results).
Fig. 2A shows the relationship of % M activity with the maximum temperature of the previous day. From the R2 values, a very weak and nonsignificant relationship for both per01 and tim01 mutants and two of the three wild types is observed. Only the HU wild type (from Holland) shows a significant correlation with temperature, but linear regression of the dataset shows no significant difference between genotypes either in slope (P = 0.105) or intercept (P = 0.334). The A component shows a much stronger positive relationship with the corresponding day’s maximum temperature for all genotypes (see R2 values), and there are significant differences between genotypes in the slope (P = 0.007), with per01 having a slightly more A component than the other genotypes over the complete temperature range and tim01 and Canton-S having the highest levels of A at the very highest temperatures (Fig. 2B). The amplitude of the E component has a strong negative relationship with temperature (Fig. 2C) but with no significant difference in slope among lines (P = 0.239). Thus, the extensive results from seminatural conditions provide some support for Menegazzi et al.’s (4) suggestion that per01 mutants show elevated levels of A activity.
When we simulated a warm summer’s day in the laboratory using the two arrhythmic mutants that are now congenic with HU and all three wild-type strains, we observe a number of differences (interaction Genotype × MAE, F8,264 = 18.44, P < 0.0001; Fig. 2D). The two recently isolated wild lines (HU and ALA) show very similar patterns of behavior (P > 0.9 for M, A, and E) but are significantly different from the laboratory Canton-S (CS) strain [HU vs. CS; P (M) = 0.034, P (A) < 0.0001, and P (E) = 0.0035], revealing a large effect of genetic background. When comparing clock mutants outcrossed into the HU background, tim01 but not per01 shows greater A activity than its corresponding wild type (Tukey post hoc P = 0.0021) but less E (P = 0.0046).
Molecular Underpinnings of the A Peak.
The seminatural locomotor recordings made by Vanin et al. (3) revealed that temperature played a crucial role in the expression not only for the A component but also for M and E. However, although the M component appeared to be a temperature-dependent response to twilight with little or no clock gene influence, the E component was temperature- and clock–gene-dependent (3). We further investigated the effects of light and temperature in our seminatural incubator paradigm by examining the behavior of backcrossed mutant strains (to HU) with restricted abilities to sense their environment.
Under simulated warm summer conditions, mutants with a compromised phototransduction pathway (Left panels of Fig. 3), either as a result of the morphological loss of photoreceptor cells as in glass60j or the double mutant glass60j cryb (Fig. 3 A and C), a deficient Phospholipase C-β as in norpAP41 (Fig. 3D) or in the cation-specific calcium channel trp1 (Fig. 3E) exhibited a relative reduction in the amplitude of the M and E components compared with HU, with a corresponding increase in A (Fig. S3, which also includes the statistical analysis). The cryb circadian blue-light photoreceptor mutants in contrast displayed robust M, A, and E peaks under these conditions and were not significantly different from HU (Fig. 3B and Fig. S3A). We also examined the effect of mutations in genes known to contribute to temperature sensing in the 25–40 °C range (Right panels of Fig. 3), including the Trp channels TrpA1 (12), painless (13), and pyrexia (14); the temperature entrainment mutant nocte (15); and the gustatory receptor paralogue Gr28b required for rapid negative thermotaxis (16). The most dramatic differences observed involved pyrexia, in which the M and E components were significantly suppressed compared with A and TrpA1 mutants in which the A component was largely eliminated (Fig. 3 F–I and Fig. S3).
Fig. 3.

The effects of mutations in photo- and thermoreceptor pathways on laboratory seminatural locomotor profiles. Shown is the mean locomotor activity (±SEM). The color key is as in Fig. 1. (A) glass60J, n = 28; (B) cryb, n = 17; (C) glass60J, cryb, n = 27; (D) norpAP41, n = 31; (E) trp1, n = 20; (F) nocteP, n = 29; (G) pyx3, n = 22; (H) painEP2451, n = 24; (I) Grb28bMI, n = 23; (J) TrpA11, n = 30.
Fig. S3.

Relative levels on M, A, and E in photo- and thermoreceptor mutants. (A) Mean M, (B) A, or (C) E components are shown (±SEM). Two-way ANOVA revealed significant genotype (F10,774 = 2.61, P = 0.004), MAE (F2,774 = 954, P <<< 0.0001), and Genotype × MAE interaction (F20,774 = 55.8, P <<< 0.0001). Dunnets multiple comparison post hoc test results are shown above each bar compared with HU. *P < 0.05, **P < 0.01, ***P < 0.001. cryb gl60j, n = 27; cryb, n = 17; gl60j, n = 27; Gr28bM1, n = 23; nocteP, n = 29; norpAP41, n = 31; painEP2451, n = 21; pyx3, n = 22; trp1, n = 20; TrpA1, n = 30; HU, n = 22.
Reported Expression of TrpA1 in Clock Neurons Is Not Required for the A Peak.
It has been reported that as well as being expressed in a number of brain regions, TrpA1 is also expressed within some of the cells that make up each subcluster within the LNv and DN clock neurons (17). Consequently we knocked down TrpA1 expression using RNAi using different Gal4 drivers. Knockdown of TrpA1 using either a TrpA1Gal4 (Fig. 4A) or the pan-neuronal enhancer trap elavGal4 (Fig. 4B) was sufficient to mimic the behavior of TrpA11 mutants with a complete lack of an A component. However, TrpA1 knockdown in clock neurons using timGal4 did not recapitulate the lack of an A peak, even when coexpressing UAS-Dicer2 to enhance the potency of the RNAi (Fig. 4C). Thus, it would appear that limiting TrpA1 knockdown to the clock cells does not reduce the A component.
Fig. 4.
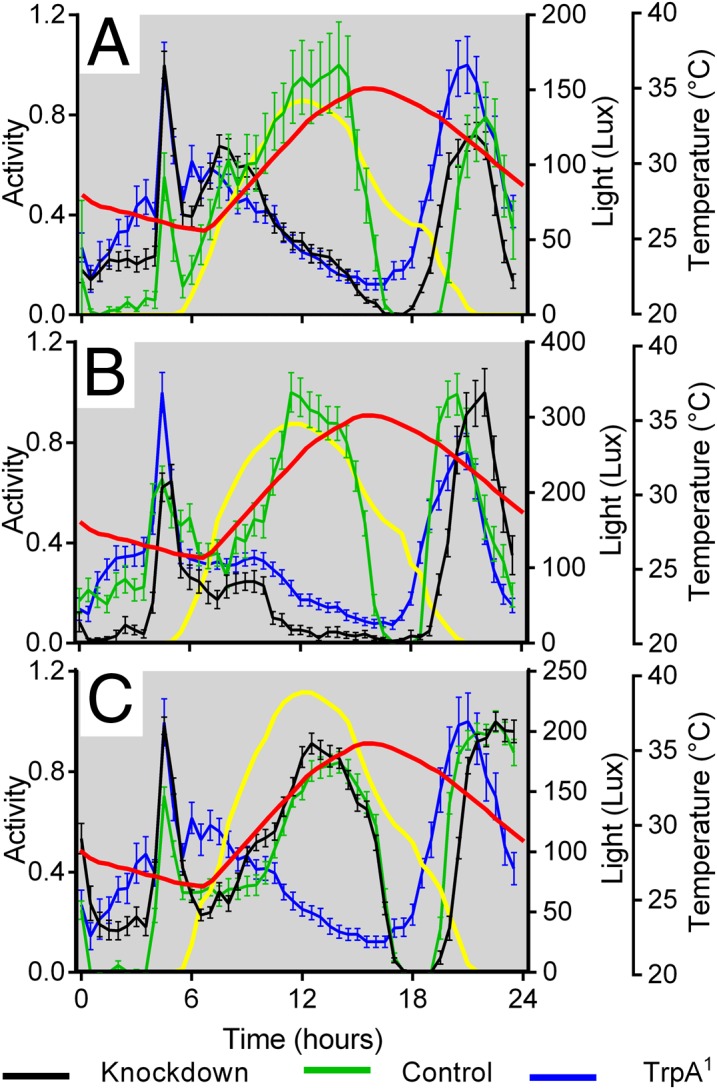
The effects of knockdown or overexpression of TrpA1 on the A peak of locomotor behavior. (A) Knockdown of TrpA1 using TrpA1Gal4 is sufficient to recapitulate lack of E peak. Knockdown, TrpA1Gal4/TrpA1-IRJF02461 (n = 30); Control, TrpA1Gal4 (n = 20); mutant, TrpA11 (n = 30). (B) TrpA1 is required in neurons to give the A peak. Knockdown, elavGal4; UAS > Dcr2; TrpA1-IRJF02461 (n = 36); Control, +/TrpA1-IRJF02461 (n = 30); mutant, elavGal4; +; TrpA11 (n = 26). (C) timGal4 knockdown of UAS-TrpA1 has no effect on the A component. Knockdown, UASDicer2, timGal4; UASTrpA1-IRJF02461 (n = 32); Control, UASDicer2, timGal4; mCherry (n = 29); mutant, TrpA11 (n = 30). Data are scaled to maximum daily peak, mean ± SEM.
Discussion
Among several unexpected results of the seminatural studies of locomotor activity of Vanin et al., the most attention has been generated by the finding that flies are highly active under warm natural conditions during the afternoon, giving rise to the A component (3). This observation was at odds with conventional laboratory studies at constant warm temperatures of 25 °C or above that reveal that flies take a siesta in the afternoon, a phenotype that has been associated with per alternative splicing in a number of studies (18–20). De et al. (8) proposed that the A component is an artifact of the flies seeking the shaded part of the TriKinetics monitors in which the infrared detector is situated. According to them, flies “fidgeting” while they are stationary within the light beam generates spurious activity counts. We have shown conclusively using analysis of video recordings in both unshaded glass tubes and in open-field arenas that the A component forms a major part of the circadian activity profile under summer conditions, fully consistent with the TriKinetics seminatural recording of Vanin et al. (3). Our use of the open-field arena developed by Simon and Dickinson (11) gave very different results to De et al.’s use of Petri dishes. The use of the latter for these kinds of observations is problematic because flies exhibit exploratory responses at the circumference of such chambers, rather than open-field behavior, and in doing so frequently occlude each other, confounding visual observations and automated tracking procedures (10). These concerns were addressed by Simon and Dickinson by redesigning an open-field arena, which in our simulation studies clearly reveals a prominent A component. We conclude that De et al.’s assertion that the A component is an artifact is incorrect.
Indeed, even a superficial reexamination of the results presented by De et al. (2013) (8) reveal that they misinterpreted their own observations. We reproduce part of their figure 2 in our Fig. 5, placing their TriKinetics results below their corresponding visual monitoring of the same flies for easier comparison. Although the two phenotypes displayed on the y axes are different, they should roughly correspond. From Fig. 5, the visual observations suggest a peak of activity at around 09:00, 4 h after the M peak in TriKinetics monitors. In addition, the visually monitored M and TriKinetics A components clearly overlap, so it seems astonishing that De et al. misinterpreted this obvious result. De et al.’s own observations thus confirm that the A component is not an artifact.
Fig. 5.
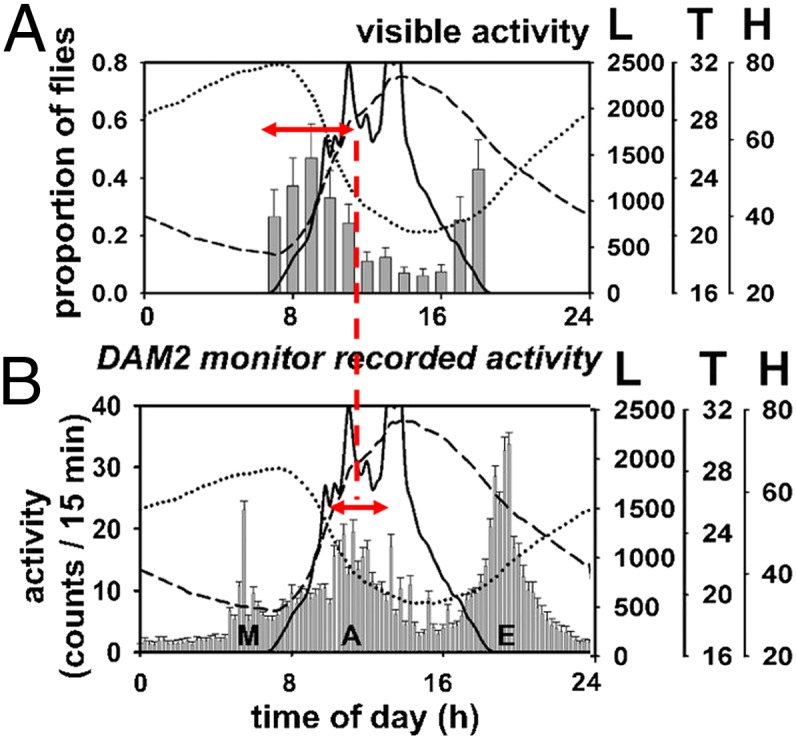
The A component is not an artifact even in De et al.’s results. (A) Visual tracking and (B) corresponding TriKinetics results reported by De et al. (8) from their figure 2. By placing one panel over the other, it is clear that the DAM2 TriKinetics M component labeled by De et al. peaks at ∼0500, several hours before the visually monitored peak that they incorrectly refer to as M, which peaks at 0900. The visually monitored M overlaps substantially with the A component observed in TriKinetics (red dotted line).
We also further investigated the suggestion that the clock suppresses inappropriately high levels of activity under warm conditions, thereby generating higher amplitude A components in per01 mutants than the wild type (4). We partially confirmed this observation in the extensive seminatural dataset of Vanin et al. (3) for both per01 and tim01 when we regressed the amount of activity against temperature. We also observed much higher levels of the A component in Canton-S in warm temperature laboratory simulations than the wild isolate, HU, reflecting a similar observation in the natural dataset. Both A and E components show highly significant positive and negative correlations, respectively, with temperature in all strains. However, when we strictly isogenized each mutant background with one of our natural strains, HU, we did not observe a significant enhancement of A activity for per01, but we did for tim01. The tim gene encodes the light-sensitive negative regulator of the fly clock (21–23), but if this effect on summer activity is simply due to the flies lacking a clock, it is curious that per01 does not do the same. Consequently, it appears that the observation by Menegazzi et al. that arrhythmic mutants may be unable to suppress the A component to the same extent as wild type (4) may be generally correct, but this effect is significantly modulated by interactions with the genetic background and perhaps by the behavioral paradigm in which it is studied.
In addition, we studied the relative levels of M, A, and E in flies carrying mutations in photo- and thermoreception pathways. The levels of M, A, and E are somewhat interdependent because each was taken as a proportion of total activity (including night time); so as one component is elevated, another may be suppressed. Nevertheless, natural summer simulations revealed that glass, trp, and norpA and the double mutant glass60j cryb blunted the expression of M and E peaks and led to significant elevation of A (Fig. S3). These observations resonate with Vanin et al.’s (3) results in seminatural conditions in which the onset of the M component appeared to be a highly temperature-dependent response to the twilights with little clock input. As the absolute levels of A were significantly higher in mutants of trp, norpA, and glass60j, cryb compared with the HU congenic controls, this suggests that their primary effect may be on A, so that under summer conditions, visual photoreceptor input suppresses the A component. Of the mutants that are known to be implicated in thermal sensing, pyx suppressed both M and E components but left A intact, whereas the most dramatic response was observed in TrpA11 mutants in which the A component was effectively eliminated. TrpA1 is a transient receptor potential channel previously implicated as an important nociceptor for both heat (24) and light (25). Lee and Montell described TrpA1 expression within each subset of the canonical clock neurons (17), so we determined whether expression of TrpA1 in clock cells was required to mediate the A peak. Down-regulation of TrpA1 using the timgal4 driver, enhanced by UAS-Dicer2, had no effect on the amplitude of the A peak, so it would appear that any expression of TrpA1 in clock neurons is unlikely to contribute to the A component.
TrpA1 expression was initially found to be limited to a few brain cells, the subesophageal ganglion, and eight cells in the thoracic ganglion (26, 27). Two pairs of AC neurons expressing TrpA1 appear to be the main internal thermosensors, but they also integrate temperature information from peripheral sensors (28). The AC sensors are activated by TrpA1 at ∼25 °C, but a second response is observed at 27 °C, which is generated by pyrexia-expressing neurons located in the second antennal segment and which synapse onto the AC neurons (28). Interestingly, when we used the pyx mutant in our behavioral assay, we found no effect on the A component, mirroring the observation that pyx is also not required in a temperature preference assay (28), but we did observe a significant suppression of M and E. Painless is also expressed in the antennae, but again we did not observe any effect on the A component in pain mutants. The rapid warmth response peripheral receptor Gr28b(d), which is located in the aristae (16), was also not required for the A component but, like pyx, suppressed M and E. We conclude that the peripheral sensors encoded by pyx and Gr28b(d) may be involved in setting levels of M and E in circadian locomotor summer responses but are not relevant to the A component. The circadian temperature entrainment mutant nocte is also largely irrelevant to the summer locomotor profile, but the effects of norpA, which has similar temperature entrainment phenotypes to nocte, are almost certainly due to its role in photoreception (15).
Modulation of the phase of the A component in per mutants has been observed by Vanin et al. (3) and under some summer conditions by Menegazzi et al. (4). One possible explanation is that in pers (and per01) mutants, the earlier A phase may simply represent a phase advance in the mutants for sensing the daily increase in temperature (4). As well as the four TrpA1-positive AC neurons that appear to act as internal thermosensors (26, 27), other TrpA1-positive cells also lie in dorsal regions in the vicinity of the DN clock cells (27). It remains to be seen whether any of the non–clock-expressing TrpA1 neurons such as the AC or DNs have direct connections to the clock cells and, if so, what the polarity of these interactions might be. It could be imagined that if clock cells send signals to the thermal sensors (or vice versa), then that might generate the phase changes that are observed in the A component in per mutants under natural conditions (3, 4).
In conclusion, the study of seminatural circadian behavior in D. melanogaster initiated by Vanin et al. (3) raised some interesting challenges to the canonical model of the clock developed under strictly artificial laboratory conditions. De et al.’s (8) suggestion that the A component is an artifact has been shown to be manifestly incorrect, both by our experiments and by scrutiny of these authors’ own results, which they appear to have misinterpreted. Instead, we suggest that the molecular and physical basis of the A component appears to reside within other TrpA1-expressing neurons rather than those canonical clock neurons that may express TrpA1 or the peripheral antennal temperature sensors. However, all three locomotor components can be modulated by mutation in the photoreceptor and peripheral thermoreceptor pathways, and the challenge will be to dissect the neuroanatomical pathways by which these sensors interact with clock cells (6, 7). In conclusion, the study of circadian behavior in seminatural conditions in mammals (1, 2) and in flies (3, 4), as well as the modeling of natural circadian data (29), can inform and refine the current models of how clocks work at the behavioral, ecological, anatomical, and molecular levels.
Materials and Methods
Fly Strains.
Flies were raised at 25 °C in LD12:12 cycles. Congenic male pers, perL, and per01 mutants were backcrossed for six generations to a w1118 that had itself been previously backcrossed for 10 generations to the wild HU strain, isolated from the Netherlands in 2005, and maintained as isofemale lines (30). As per maps very closely to w, we followed the per allele in each backcross generation by eye color and confirmed the final strains behaviorally in circadian locomotor assays. After six generations of backcrossing into HU, the residual genetic variation is 1/64 or less than 2%. All Gal4 lines had also been previously backcrossed to HU for 6–10 generations. Other mutant lines first had appropriate chromosomes replaced with those of HU using balancers and then backcrossed to HU for two further generations before behavioral observations were made.
Outcrossed glass60J (31), cryb, norpAP41 (32), and cryb, glass60J double mutants from existing laboratory stocks trp1 (stock 5692) (33), painlessEP2451 (stock 27895), Gr28BMI (stock 24190), and TrpA11 (stock 26504) were obtained from the Bloomington Drosophila Stock Center. nocteP and pyx3 were gifts from Ralf Stanewsky, University College London, London. Outcrossed lines TrpA1-IRJF02461 (UAS-RNAi) and TrpA1Gal4 (48951) from Janelia Farm were also used.
Behavioral Observations.
Flies were anesthetized with CO2 and loaded into the experimental arenas. For TriKinetics and the virtual beam breaking experiment, male flies were loaded in 10-cm-long glass tubes and sealed with maize food and rubber bungs on one end and cotton wool at the other. Open-field experiments used groups of four male and four female flies in 12-cm-diameter circular arenas (11) with a central core of maize food (Fig. S2). Activity arenas were placed into incubators, and flies were allowed to recover and entrain to seminatural conditions for at least 1.5 d before observations were made.
Natural Light and Temperature Simulations.
We used a Memmert IPP500 peltier programmable incubator to smoothly cycle temperature and mimic a midsummer’s day in northern Italy. We generated a reference temperature profile by taking the normalized average of three typical summer days in Treviso, Italy from Vanin et al. (3) that could be baseline shifted to produce natural-like cycles of 20–30 °C and 25–35 °C (the correlation between the simulated and real data were >0.97; Fig. S1). These profiles were converted to temperature cycles by the incubator’s Celsius software. A light intensity regime to match that recorded in Treviso during midsummer (approximately LD16:8) was generated using a custom-built programmable simulator (made by Stefano Bastianello, Euritmi, Venetian Institute of Molecular Medicine, Padova, Italy), with a peak intensity at 500 lx, to resonate with light levels regularly recorded for summer observations in TriKinetics monitors placed in the shade (3). We used the Trikinetics environment sensor to record the light intensity, but this would give slightly different maximum readings depending on exactly where the sensor was placed within the incubator, even though Trikinetics activity monitors were exposed to 500 lx. The spectral composition of the light matched that of the natural midsummer light by combining outputs of six groups of LEDs with different emission spectra. Temperature was cycled to peak 2.5 h later than the light cycle peak, thereby mimicking natural midsummer recordings (3). Relative daily levels of the M, A, and E locomotor components were calculated as in Menegazzi et al. (4) to generate a measure of amplitude for each component by dividing up the day and taking the proportion of total daily activity (including N activity) that fell into the corresponding daily segments.
Acquisition and Analysis of Video Data.
Activity videos (1280 × 720 resolution at either 15 or 30 fps) were recorded under infrared light using a Logitech c930e webcam modified to be sensitive only to light >850 nm. To assess virtual beam crossings in unshaded conditions, eight 10-cm glass tubes (same tubes as Trikinetics) were placed horizontally on a white background inside the incubator. The ActualTrack software divided the tube into two equidistant zones, and the number of fly movements from one zone into the other was tracked, providing a measure of virtual beam crossings. We recorded 5-min-long videos every 30 min across a 2.5 day period. Data for all flies on both days were combined to calculate a daily group mean and SEM for each time point. For open-field arena experiments, four male and four females were placed into the chamber (11) within the incubator, and 5-min-long video time points were recorded every hour across a 24-h period. Videos were analyzed with ActualTrack to record the total distance moved by each fly in that period. The mean fly activity at each time point was used to calculate a daily profile, and an overall mean based on three replications was generated for each genotype. The ActualTrack settings used to track flies are described in more detail in SI Materials and Methods.
For TriKinetics experiments under simulated natural conditions, entrained flies were recorded over 5 d in DAM2 monitors. For each fly, a median daily activity profile was generated using 30-min bins, and the genotype mean and SEM were calculated. When we reinterrogated our natural data from the Vanin et al. study (3), as each day is different in terms of the environmental variation, we calculated the daily mean and SEM activity (in 30-min bins) for each group of males. Statistical analysis was performed using Prism 6.05 (GraphPad Software Inc.).
SI Materials and Methods
All videos were analyzed using ActualTrack (Actual Analytics Ltd.) set to adult Drosophila tracking mode and calibrated to reflect the real-world size of each arena to ensure accurate tracking and calculation of locomotor parameters. Each experiment was analyzed using the same settings through the use of a configuration template, and the output of ActualTrack was manually examined to correct for any tracking errors.
Default tracking settings within the software are optimized for the experimental paradigm, in this case locomotor multisubject Drosophila tracking, and do not require further configuration. These settings were used for the purposes of the current dataset, including the image processing options available within the application. All configuration settings including the default parameters used are described in detail in the ActualTrack Manual. The number of times a subject visited each zone was automatically quantified by the software, enabling the number of zone crossings to be calculated.
Multisubject Drosophila tracking was performed for both the “seminatural” experiment within the glass tubes and also within the open-field arena under natural conditions. Three-point multisubject tracking was available for selection for the analysis of locomotor behavior, whereby the nose point, body center, and tail base locations of each subject within the video were automatically recognized and tracked providing xy coordinates of each track point for every frame analyzed. The software sampled the video at a resolution of 25 frames per second, generating tracking data for every subject at each sample point. The track point coordinates were extracted by the software, and the locomotion of each subject could subsequently be automatically assessed.
Although most of the default tracking settings were used for multisubject tracking, a number of the subject detection and subject attribute settings were reconfigured to assist with automatic subject detection and tracking. Subject detection settings were set to the exact number of subjects under analysis within the arena and were configured to include the subject size and speed range. The minimum subject detection size was set to 0 to ensure no interruption to subject detection as a result of change of subject orientation within the arena. The maximum speed at which a subject can move in 1 s was set to 4 cm. For every video, a background image of the arena before introduction of the flies was subtracted from every frame of the video under analysis. Analysis settings were kept constant across experiments.
Following completion of automated tracking and analysis, the tracking data generated by the software were overlaid upon each video within the application, and this was manually reviewed by an experimental researcher to ensure accurate tracking data generation. A report was then generated by the software, which included the total distance traveled (cm) by the population throughout the video as well as zone entry measures. The resultant data file was imported into Prism for further statistical analysis.
Acknowledgments
E.W.G., C.N.H., and C.P.K. were supported by a Biotechnology and Biological Sciences Research Council grant, and E.K.O., C.P.K., R.C., and J.D.A. were supported by a Marie Curie Initial Training Network “INsecTime” award. S. Bhutani, S.V., C.P.K., and R.C. were supported by European Community Grant EUCLOCK.
Footnotes
The authors declare no conflict of interest.
This article is a PNAS Direct Submission.
This article contains supporting information online at www.pnas.org/lookup/suppl/doi:10.1073/pnas.1506093112/-/DCSupplemental.
References
- 1.Daan S, et al. Lab mice in the field: Unorthodox daily activity and effects of a dysfunctional circadian clock allele. J Biol Rhythms. 2011;26(2):118–129. doi: 10.1177/0748730410397645. [DOI] [PubMed] [Google Scholar]
- 2.Gattermann R, et al. Golden hamsters are nocturnal in captivity but diurnal in nature. Biol Lett. 2008;4(3):253–255. doi: 10.1098/rsbl.2008.0066. [DOI] [PMC free article] [PubMed] [Google Scholar]
- 3.Vanin S, et al. Unexpected features of Drosophila circadian behavioural rhythms under natural conditions. Nature. 2012;484(7394):371–375. doi: 10.1038/nature10991. [DOI] [PubMed] [Google Scholar]
- 4.Menegazzi P, Yoshii T, Helfrich-Förster C. Laboratory versus nature: The two sides of the Drosophila circadian clock. J Biol Rhythms. 2012;27(6):433–442. doi: 10.1177/0748730412463181. [DOI] [PubMed] [Google Scholar]
- 5.Collins BH, Dissel S, Gaten E, Rosato E, Kyriacou CP. Disruption of Cryptochrome partially restores circadian rhythmicity to the arrhythmic period mutant of Drosophila. Proc Natl Acad Sci USA. 2005;102(52):19021–19026. doi: 10.1073/pnas.0505392102. [DOI] [PMC free article] [PubMed] [Google Scholar]
- 6.Grima B, Chélot E, Xia R, Rouyer F. Morning and evening peaks of activity rely on different clock neurons of the Drosophila brain. Nature. 2004;431(7010):869–873. doi: 10.1038/nature02935. [DOI] [PubMed] [Google Scholar]
- 7.Stoleru D, Peng Y, Nawathean P, Rosbash M. A resetting signal between Drosophila pacemakers synchronizes morning and evening activity. Nature. 2005;438(7065):238–242. doi: 10.1038/nature04192. [DOI] [PubMed] [Google Scholar]
- 8.De J, Varma V, Saha S, Sheeba V, Sharma VK. Significance of activity peaks in fruit flies, Drosophila melanogaster, under seminatural conditions. Proc Natl Acad Sci USA. 2013;110(22):8984–8989. doi: 10.1073/pnas.1220960110. [DOI] [PMC free article] [PubMed] [Google Scholar]
- 9.Green EW, et al. Genetic analysis of Drosophila circadian behavior in seminatural conditions. Methods Enzymol. 2015;551:121–133. doi: 10.1016/bs.mie.2014.10.001. [DOI] [PubMed] [Google Scholar]
- 10.Soibam B, et al. Open-field arena boundary is a primary object of exploration for Drosophila. Brain Behav. 2012;2(2):97–108. doi: 10.1002/brb3.36. [DOI] [PMC free article] [PubMed] [Google Scholar]
- 11.Simon JC, Dickinson MH. A new chamber for studying the behavior of Drosophila. PLoS ONE. 2010;5(1):e8793. doi: 10.1371/journal.pone.0008793. [DOI] [PMC free article] [PubMed] [Google Scholar]
- 12.Viswanath V, et al. Opposite thermosensor in fruitfly and mouse. Nature. 2003;423(6942):822–823. doi: 10.1038/423822a. [DOI] [PubMed] [Google Scholar]
- 13.Sokabe T, Tsujiuchi S, Kadowaki T, Tominaga M. Drosophila painless is a Ca2+-requiring channel activated by noxious heat. J Neurosci. 2008;28(40):9929–9938. doi: 10.1523/JNEUROSCI.2757-08.2008. [DOI] [PMC free article] [PubMed] [Google Scholar]
- 14.Lee Y, et al. Pyrexia is a new thermal transient receptor potential channel endowing tolerance to high temperatures in Drosophila melanogaster. Nat Genet. 2005;37(3):305–310. doi: 10.1038/ng1513. [DOI] [PubMed] [Google Scholar]
- 15.Glaser FT, Stanewsky R. Temperature synchronization of the Drosophila circadian clock. Curr Biol. 2005;15(15):1352–1363. doi: 10.1016/j.cub.2005.06.056. [DOI] [PubMed] [Google Scholar]
- 16.Ni L, et al. A gustatory receptor paralogue controls rapid warmth avoidance in Drosophila. Nature. 2013;500(7464):580–584. doi: 10.1038/nature12390. [DOI] [PMC free article] [PubMed] [Google Scholar]
- 17.Lee Y, Montell C. Drosophila TRPA1 functions in temperature control of circadian rhythm in pacemaker neurons. J Neurosci. 2013;33(16):6716–6725. doi: 10.1523/JNEUROSCI.4237-12.2013. [DOI] [PMC free article] [PubMed] [Google Scholar]
- 18.Majercak J, Sidote D, Hardin PE, Edery I. How a circadian clock adapts to seasonal decreases in temperature and day length. Neuron. 1999;24(1):219–230. doi: 10.1016/s0896-6273(00)80834-x. [DOI] [PubMed] [Google Scholar]
- 19.Collins BH, Rosato E, Kyriacou CP. Seasonal behavior in Drosophila melanogaster requires the photoreceptors, the circadian clock, and phospholipase C. Proc Natl Acad Sci USA. 2004;101(7):1945–1950. doi: 10.1073/pnas.0308240100. [DOI] [PMC free article] [PubMed] [Google Scholar]
- 20.Low KH, Lim C, Ko HW, Edery I. Natural variation in the splice site strength of a clock gene and species-specific thermal adaptation. Neuron. 2008;60(6):1054–1067. doi: 10.1016/j.neuron.2008.10.048. [DOI] [PMC free article] [PubMed] [Google Scholar]
- 21.Hunter-Ensor M, Ousley A, Sehgal A. Regulation of the Drosophila protein timeless suggests a mechanism for resetting the circadian clock by light. Cell. 1996;84(5):677–685. doi: 10.1016/s0092-8674(00)81046-6. [DOI] [PubMed] [Google Scholar]
- 22.Myers MP, Wager-Smith K, Rothenfluh-Hilfiker A, Young MW. Light-induced degradation of TIMELESS and entrainment of the Drosophila circadian clock. Science. 1996;271(5256):1736–1740. doi: 10.1126/science.271.5256.1736. [DOI] [PubMed] [Google Scholar]
- 23.Zeng H, Qian Z, Myers MP, Rosbash M. A light-entrainment mechanism for the Drosophila circadian clock. Nature. 1996;380(6570):129–135. doi: 10.1038/380129a0. [DOI] [PubMed] [Google Scholar]
- 24.Rosenzweig M, et al. The Drosophila ortholog of vertebrate TRPA1 regulates thermotaxis. Genes Dev. 2005;19(4):419–424. doi: 10.1101/gad.1278205. [DOI] [PMC free article] [PubMed] [Google Scholar]
- 25.Xiang Y, et al. Light-avoidance-mediating photoreceptors tile the Drosophila larval body wall. Nature. 2010;468(7326):921–926. doi: 10.1038/nature09576. [DOI] [PMC free article] [PubMed] [Google Scholar]
- 26.Hamada FN, et al. An internal thermal sensor controlling temperature preference in Drosophila. Nature. 2008;454(7201):217–220. doi: 10.1038/nature07001. [DOI] [PMC free article] [PubMed] [Google Scholar]
- 27.Shih HW, Chiang AS. Anatomical characterization of thermosensory AC neurons in the adult Drosophila brain. J Neurogenet. 2011;25(1-2):1–6. doi: 10.3109/01677063.2011.571323. [DOI] [PubMed] [Google Scholar]
- 28.Tang X, Platt MD, Lagnese CM, Leslie JR, Hamada FN. Temperature integration at the AC thermosensory neurons in Drosophila. J Neurosci. 2013;33(3):894–901. doi: 10.1523/JNEUROSCI.1894-12.2013. [DOI] [PMC free article] [PubMed] [Google Scholar]
- 29.van der Vinne V, et al. Cold and hunger induce diurnality in a nocturnal mammal. Proc Natl Acad Sci USA. 2014;111(42):15256–15260. doi: 10.1073/pnas.1413135111. [DOI] [PMC free article] [PubMed] [Google Scholar]
- 30.Tauber E, et al. Natural selection favors a newly derived timeless allele in Drosophila melanogaster. Science. 2007;316(5833):1895–1898. doi: 10.1126/science.1138412. [DOI] [PubMed] [Google Scholar]
- 31.Moses K, Ellis MC, Rubin GM. The glass gene encodes a zinc-finger protein required by Drosophila photoreceptor cells. Nature. 1989;340(6234):531–536. doi: 10.1038/340531a0. [DOI] [PubMed] [Google Scholar]
- 32.Szular J, et al. Rhodopsin 5- and Rhodopsin 6-mediated clock synchronization in Drosophila melanogaster is independent of retinal phospholipase C-β signaling. J Biol Rhythms. 2012;27(1):25–36. doi: 10.1177/0748730411431673. [DOI] [PMC free article] [PubMed] [Google Scholar]
- 33.Hardie RC, Minke B. The trp gene is essential for a light-activated Ca2+ channel in Drosophila photoreceptors. Neuron. 1992;8(4):643–651. doi: 10.1016/0896-6273(92)90086-s. [DOI] [PubMed] [Google Scholar]