Significance
We demonstrate a signaling axis that controls reactive astrogliosis after brain injury based on the Notch1 receptor, signal transducer and activator of transcription 3 (STAT3), and endothelin receptor type B (ETBR). Knowledge of the Notch1–STAT3–ETBR signaling axis provides fundamental insight into the signaling network that regulates reactive astrocyte proliferation after brain injury. In addition, we identify the first set of markers for prospective isolation of proliferative reactive astrocytes directly from injured CNS tissue (GLAST+/Jagged1Hi) and describe a unique method to generate large quantities of primary adult reactive astrocytes based on redifferentiation from reactive astrocyte-derived neural stem cells. These tools provide a powerful platform to map the signaling network that controls reactive astrogliosis.
Keywords: reactive astrocyte, Notch1, STAT3, ETBR, proliferation
Abstract
Defining the signaling network that controls reactive astrogliosis may provide novel treatment targets for patients with diverse CNS injuries and pathologies. We report that the radial glial cell antigen RC2 identifies the majority of proliferating glial fibrillary acidic protein-positive (GFAP+) reactive astrocytes after stroke. These cells highly expressed endothelin receptor type B (ETBR) and Jagged1, a Notch1 receptor ligand. To study signaling in adult reactive astrocytes, we developed a model based on reactive astrocyte-derived neural stem cells isolated from GFAP-CreER-Notch1 conditional knockout (cKO) mice. By loss- and gain-of-function studies and promoter activity assays, we found that Jagged1/Notch1 signaling increased ETBR expression indirectly by raising the level of phosphorylated signal transducer and activator of transcription 3 (STAT3), a previously unidentified EDNRB transcriptional activator. Similar to inducible transgenic GFAP-CreER-Notch1-cKO mice, GFAP-CreER-ETBR-cKO mice exhibited a defect in reactive astrocyte proliferation after cerebral ischemia. Our results indicate that the Notch1–STAT3–ETBR axis connects a signaling network that promotes reactive astrocyte proliferation after brain injury.
Reactive astrogliosis occurs after most forms of CNS injury, including cerebral ischemia and trauma (1). Based on the size and duration of CNS injury, astrocytes undergo dramatic changes in gene expression, morphology (hypertrophy), and proliferation (2). Proliferating reactive astrocytes perform key activities that impact tissue preservation, repair/remodeling, and functional outcome. Specific deletion of proliferating reactive astrocytes after brain injury was shown to prevent repair of the blood–brain barrier and increase immune cell infiltration and neuronal degeneration (3, 4). Similarly, specific astroglial deletion after spinal cord injury increased immune cell infiltration, demyelination, neuronal death, and motor deficit (5). Defining signaling mechanisms that control reactive astrogliosis may lead to new treatments that maintain or repair the blood–brain barrier, control immune cell infiltration, provide neuroprotection, and/or reduce or modify glial scarring (6–9). However, the signaling network that regulates reactive astrocyte proliferation and function(s) is complex and remains poorly understood.
Studies with Cre-loxP–based conditional-knockout (cKO) mouse models that target reactive astrocytes have shown that signal transducer and activator of transcription 3 (STAT3) is an important signaling component in reactive astrogliosis (10, 11). STAT3 is activated during CNS injury, and phosphorylated STAT3 (p-STAT3) transduces signals for multiple molecules secreted or released from damaged cells such as EGF and factors that bind gp130 receptor [e.g., IL-6, leukemia inhibitory factor (LIF), and cilliary neurotrophic factor]. Using inducible glial fibrillary acidic protein (GFAP)-CreER-Notch1 cKO, we reported that Notch1 signaling regulates reactive astrocyte proliferation after stroke (8).
Relative to their distance from cell/tissue damage, subpopulations of reactive astrocytes exhibit increased expression of intermediate filament proteins such as GFAP, Nestin, and a Nestin variant with posttranslational modifications detected by the RC2 monoclonal antibody (12–15). During cortical development, the RC2 antigen is expressed by proliferating radial glial cells that are regulated by Notch1 signaling (16–18). Although rarely expressed in healthy adult cortical tissue, the RC2 antigen is re-expressed by a subpopulation of proliferative reactive astrocytes early after brain injury (19).
Here we demonstrate that the majority of proliferating reactive astrocytes express RC2 antigen after stroke (hereafter called “RC2+ reactive astrocytes”) and report a sorting scheme for prospective isolation of RC2+ reactive astrocytes directly from injured cortex based on cell-surface expression of Jagged1, a Notch1 ligand. In addition to Jagged1 and Notch1, RC2+ reactive astrocytes highly expressed endothelin receptor type B (ETBR). Investigating whether Notch1 signaling interacted with ETBR, we found that Jagged1 increased ETBR levels in an indirect manner, through STAT3. Experiments with inducible GFAP-CreER-ETBR-cKO mice demonstrated that ETBR is necessary for reactive astrocyte proliferation. Our results identify ETBR as a transcriptional target of STAT3 and demonstrate a Notch1–STAT3–ETBR signaling axis that promotes reactive astrogliosis after brain injury.
Results
RC2+/ETBR+ Cells Represent the Majority of Proliferating Reactive Astrocytes Early After Stroke.
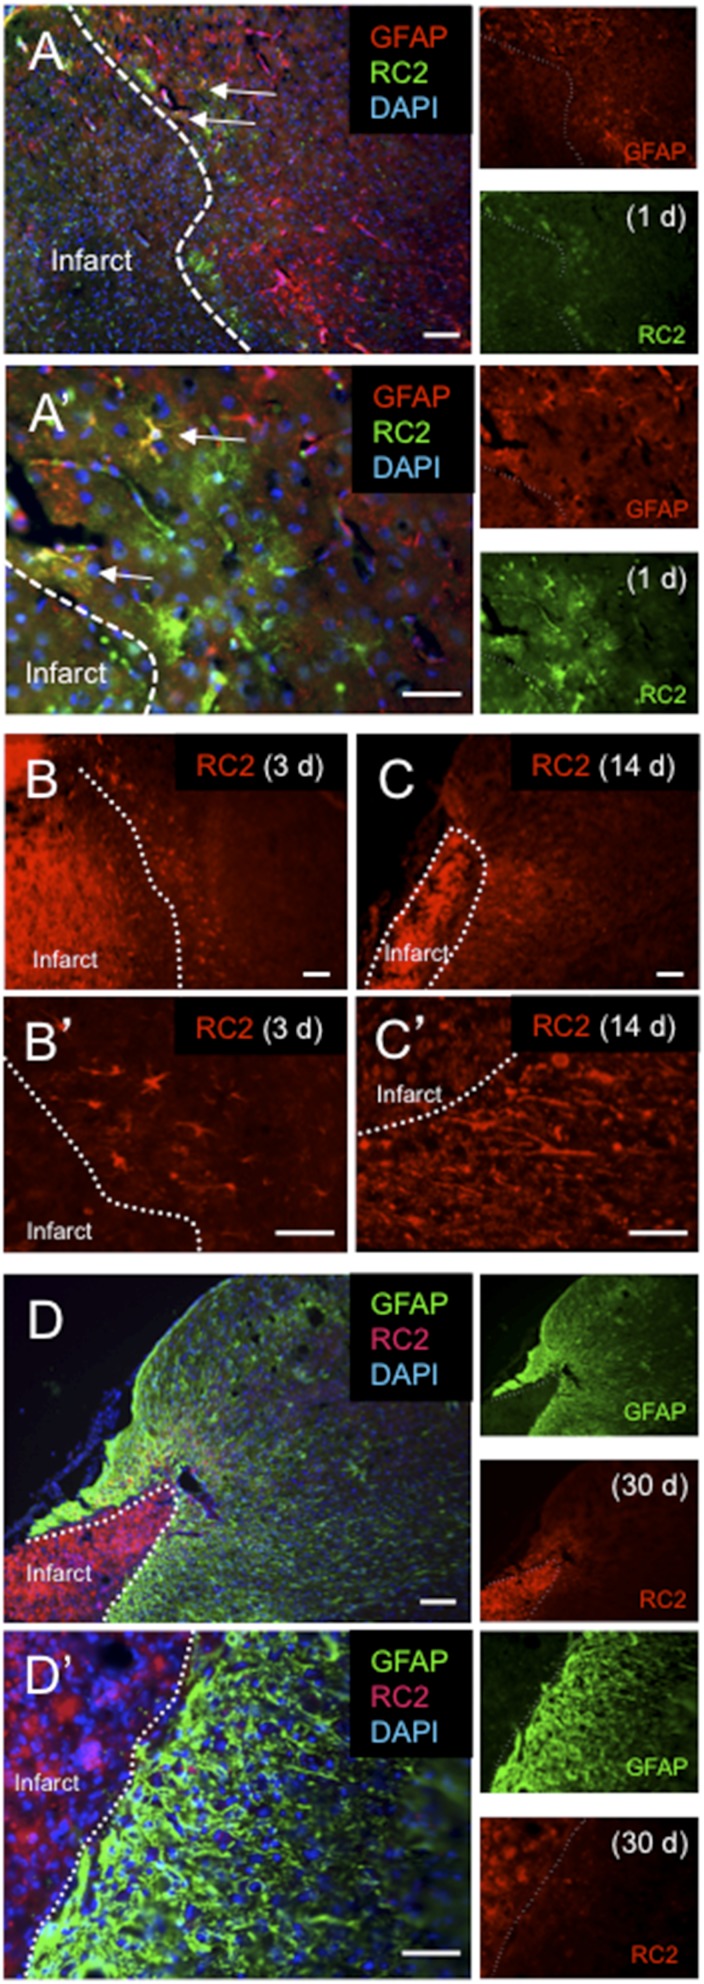
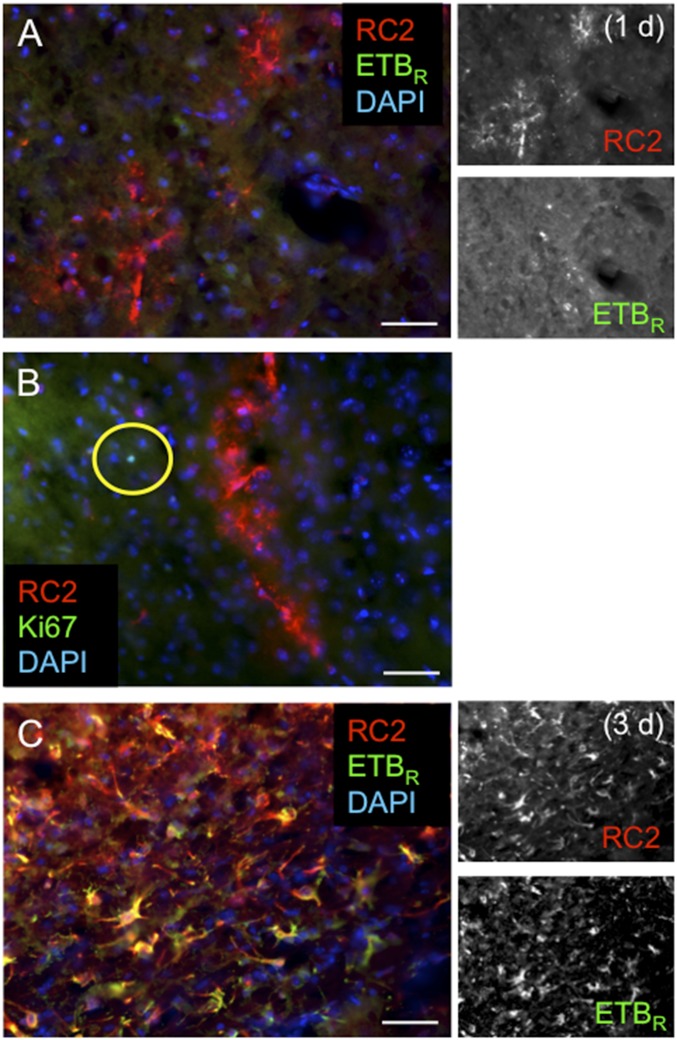
To understand better the astroglial signaling and receptors that control reactive astrogliosis, we focused on the subpopulation of RC2+ reactive astrocytes that form immediately adjacent to the infarct core early after cerebral ischemia (19). Studying the timing of reactive astrogliosis, we observed GFAP+/RC2+ reactive astrocytes in the peri-infarct area at 1, 3, and 14 d after distal middle artery occlusion (dMCAO) but did not detect RC2 antigen by immunohistochemistry at 30 d after stroke (i.e., within the glial scar when proliferation has subsided) (Fig. S1). At 1 d after stroke, RC2+ reactive astrocytes were negative for ETBR and Ki67, a marker of cell proliferation (Fig. S2). These data indicated that RC2+ cells expressed the RC2 antigen before entering the cell cycle in vivo.
Fig. S1.
RC2+ reactive astrocytes appear within 1 d after focal ischemic cortical injury but are undetectable 30 d later. (A and A′) RC2+ reactive astrocytes (green) at 1 d after dMCAO. Arrows indicate RC2+ reactive astrocytes that coexpress GFAP (red). Note the “bushy” astrocyte morphology. (B and B′) RC2+ reactive astrocytes have acquired a hypertrophic, stellate morphology by 3 d after dMCAO. (C and C′) At 14 d following injury, GFAP+ reactive astrocytes that express RC2 have largely lost the stellate morphology and extend processes in the direction of the infarct core (dotted line). (D and D′) At 30 d after injury, RC2 expression is undetectable in the GFAP+ reactive astrocytes that compose the glial scar. (Scale bars, 100 µm in A, B, C, and D; 50 µm in A′, B′, C′, and D′.)
Fig. S2.
RC2+ reactive astrocytes induce expression of ETBR and Ki67 1–3 d after focal ischemic cortical injury. (A) RC2+ reactive astrocytes (red) are negative for ETBR 1 d after dMCAO. Note the bushy astrocyte morphology. (B) RC2+ reactive astrocytes (red) do not express the proliferation marker Ki67 (green) 1 d after dMCAO. The yellow circle indicates a rare RC2−/Ki67+ cell in the peri-infarct area. (C) At 3 d following stroke, the majority of RC2+ reactive astrocytes in the peri-infarct area have undergone hypertrophy and express ETBR. (Scale bars, 100 µm.)
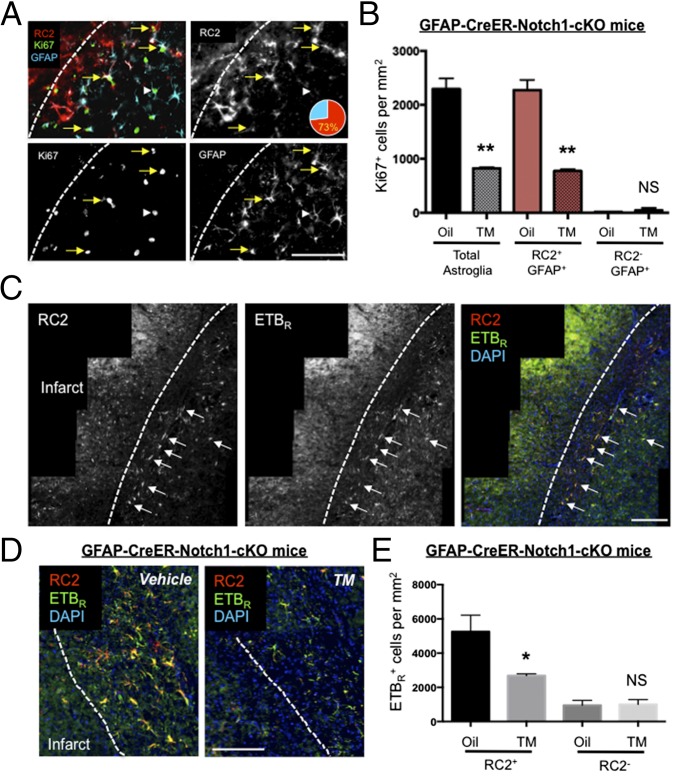
At 3 d after stroke, nearly all RC2+ reactive astrocytes in the cortical peri-infarct area expressed ETBR [99 ± 1% (mean ± SEM); n = 3] (Fig. S2), and the majority (73%) of proliferating GFAP+/Ki67+ reactive astrocytes coexpressed RC2 (RC2+/GFAP+/Ki67+: 1,857 ± 321.0 cells/mm2; RC2−/GFAP+/Ki67+: 698.6 ± 195.0 cells/mm2; n = 3) (Fig. 1A). Staining showed that the level of ETBR expression was markedly higher in RC2+ reactive astrocytes than in distal parenchymal GFAP+ cells and other cortical cell types (Fig. 1).
Fig. 1.
RC2 marks Notch1-dependent reactive astrocytes that proliferate after injury and express high levels of ETBR. (A) At 3 d after dMCAO, the majority of GFAP+/Ki67+ reactive astrocytes surrounding the infarct core expressed RC2 antigen (73%), whereas a minority of astrocytes coexpressed Ki67 and GFAP but not RC2 (white arrowhead). (B) cKO of Notch1 during stroke significantly reduced the number of proliferating GFAP+ cells (Total astroglia) and RC2+/GFAP+ reactive astrocytes but not RC2−/GFAP+ astrocytes 3 d after stroke. **P < 0.01; n = 3. NS, not significant. (C) RC2+ astrocytes expressed high levels of ETBR (white arrows) relative to distal astrocytes and other cell types. (D and E) Conditional deletion of astroglial Notch1 in GFAP-CreER-Notch1-cKO mice significantly decreased RC2+/ETBR+ astrocytes but not RC2−/ETBR+ cells in the peri-infarct area 3 d after dMCAO. *P < 0.05, n = 3. (Scale bars, 50 µm.) The three panels in (C) were montaged by software from multiple images in order to show a larger cortical field.
Notch1 Signaling Regulates the Number of RC2+/ETBR+ Reactive Astrocytes.
Tamoxifen (TM)-inducible GFAP-CreER mice express CreER under control of the 2.2-kb human GFAP promoter. At 3 d after dMCAO, TM-treated GFAP-CreER-Notch1-cKO mice exhibited a significant decrease in the number of Ki67+ reactive astrocytes [GFAP+ (total astroglia): corn oil (vehicle)-treated, 2,293 ± 196 cells/mm2; TM-treated, 822 ± 19.6 cells/mm2; RC2+/GFAP+: oil-treated, 2,273 ± 190 cells/mm2; TM-treated, 775 ± 33.1 cells/mm2; RC2−/GFAP+: oil-treated, 20 ± 10 cells/mm2; TM-treated, 47.5 ± 47.5 cells/mm2; n = 3] (Fig. 1B). To examine whether Notch1 signaling affected proliferation specifically in RC2+/ETBR+ reactive astrocytes, we performed dMCAO surgery on GFAP-CreER-Notch1-cKO mice and performed double immunohistochemistry for RC2 and ETBR. At 30 d after TM administration and 3 d after dMCAO, there was a significant reduction in the number of RC2+/ETBR+ cells in TM-treated mice compared with corn oil-treated mice (vehicle-treated, 5,254 ± 557.5 cells/mm2; TM-treated, 2,685 ± 60.75 cells/mm2; n = 3 mice per group; P < 0.05) (Fig. 1C).
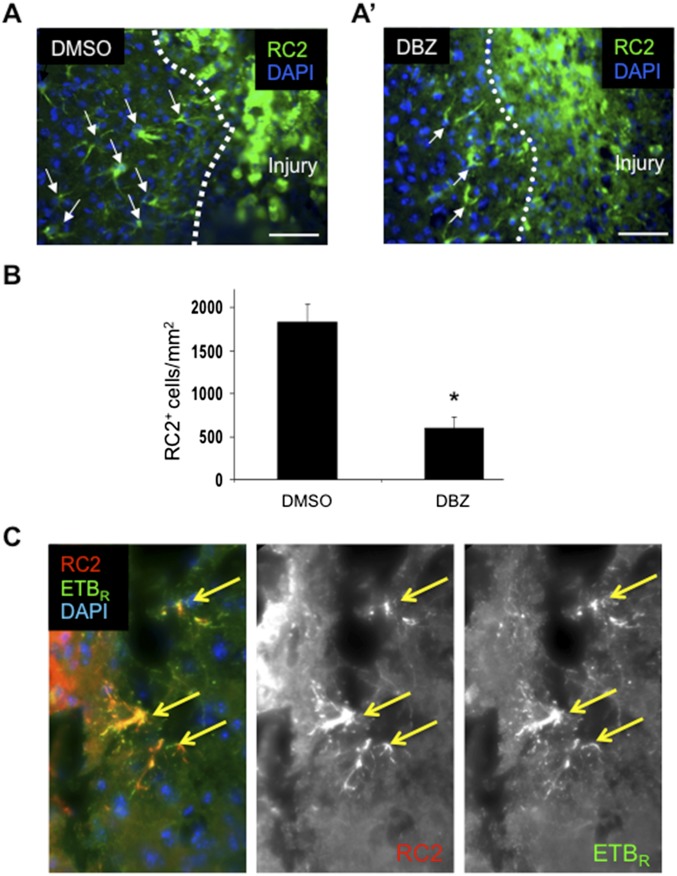
To determine if Notch signaling regulated RC2+ reactive astrocytes in other models of brain injury, we counted the number of RC2+ reactive astrocytes in cortical tissue 3 d after stereotaxic injection of dibenzazepine (DBZ), a Gamma secretase inhibitor (GSI) that inhibits cleavage of Notch1. In the brain-stab model, we observed significantly fewer RC2+ reactive astrocytes surrounding the stab injury in DBZ-injected mice than in vehicle-injected control mice (DBZ-injected, 602.7 ± 118.1 cells/mm2; DMSO-injected, 1,835.0 ± 209.7 cells/mm2; n = 3; P = 0.01) (Fig. S3). Similar to RC2+ reactive astrocytes in the peri-infarct area after stroke, RC2+ reactive astrocytes adjacent to the stab injury also coexpressed ETBR (Fig. S3).
Fig. S3.
Formation of RC2+ reactive astrocytes 3 d following cortical stab injury is attenuated by inhibition of Gamma-secretase. (A and A′) RC2+ reactive astrocytes (green) surround the injury 3 d after needle stab. Arrows indicate RC2+ reactive astrocytes. (A′) DBZ injection reduces the presence of RC2+cells. (Scale bars, 50 µm.) (B) Quantification of RC2+ cells in the peri-infarct area. DBZ treatment significantly reduced the number of RC2+ cells after injury. Data are shown as mean ± SEM. *P < 0.05; unpaired t test; n = 3. (C) As in stroke injury, 3 d after brain-stab injury most RC2+ reactive astrocytes (red) adjacent to the injury coexpress ETBR (green). Yellow arrows indicate colocalizations.
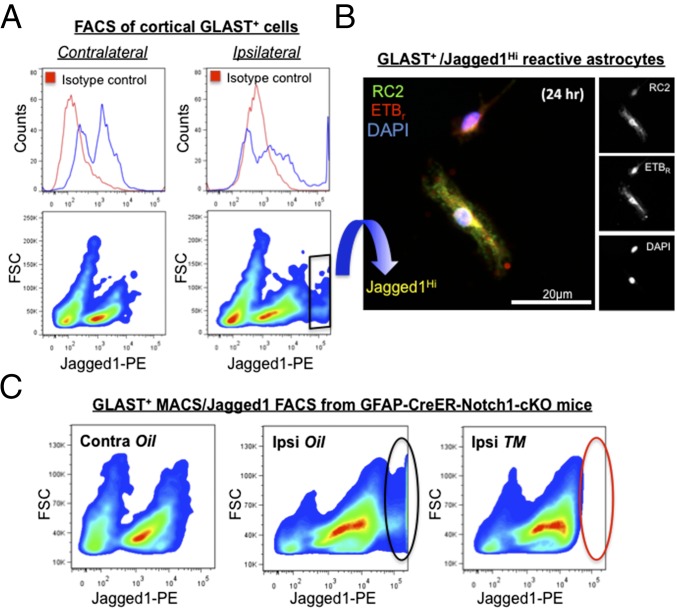
To investigate Notch1 signaling in RC2+/ETBR+ reactive astrocytes further, we assayed for Jagged1, a Notch1 ligand presented on the cell surface that induces Notch1 signaling in adjacent cells. We isolated reactive astrocytes from peri-infarct tissues by magnetic-activated cell sorting (MACS) with antibodies against glutamate aspartate transporter-1 (GLAST) (20). At 3 d after stroke, FACS phenotyping of GLAST+ reactive astrocytes from cortical tissues of C57BL/6J mice demonstrated that cell-surface Jagged1 expression was markedly up-regulated on cells from the ischemic ipsilateral side of the brain compared with cells from the contralateral side (Fig. 2A and Fig. S4). Depending on the absence or presence of injury, we observed that cortical GLAST+ cells partitioned into Jagged1Neg and Jagged1Lo cells or into Jagged1Neg, Jagged1Lo, and Jagged1Hi cells, respectively (Fig. 2A). These results demonstrated that Jagged1 levels could be used to segregate three major subpopulations of reactive astrocytes after brain injury. Because FACS-compatible antibodies for ETBR were not available, we fixed and stained cells postsort that were allowed to adhere for 24 h in culture. Notably, GLAST+/Jagged1Neg cells adhered initially but did not survive the 24 h of culture. GLAST+/Jagged1Lo and GLAST+/Jagged1Hi cells adhered, survived, and expressed RC2, ETBR, and Nestin (Fig. 2B).
Fig. 2.
Cell-surface Jagged1 levels identify distinct subpopulations of GLAST+ reactive astrocytes after cortical injury. (A) Jagged1 phenotype of GLAST+ cells isolated by MACS from pooled contralateral and ipsilateral cortical tissues of C57BL/6J mice 3 d after ischemic injury (n = 4 mice; ipsi- and contralateral tissues were dissected from the same animals). (Left) Contralateral GLAST+ cells divide into two populations, Jagged1Neg and Jagged1Lo. For specific anti-Jagged1 stain (see area under blue line on the histogram), note the bimodal distribution indicating two populations, and that the signal from cells stained with nonspecific antibody (isotype control, area under red line) overlaps the first half of the distribution defined by the blue line (i.e., Jagged1Neg cells). (Right) Cell-surface Jagged1 levels increase markedly on a portion of ipsilateral GLAST+ cells after stroke, forming a third additional cell population (i.e., Jagged1Hi cells) with a signal intensity above 105 (see distribution under blue line towards the far end of the histogram). (Right, Bottom) Isolation of Jagged1Hi cells by FACS (the black rhombus indicates the gate). (B) Post-FACS, Jagged1Hi cells adhered and were cultured for 24 h and then were fixed and stained for RC2 (green) and ETBR (red). Cell nuclei were stained by DAPI (blue). (C) GFAP-CreER-Notch1-cKO mice were treated with vehicle (corn oil) or TM (n = 3 mice per treatment group, pooled by ipsi- or contralateral cortical tissue). (Left) GLAST+ cells isolated from contralateral cortices of oil-treated GFAP-CreER-Notch1-cKO mice lacked the population of Jagged1Hi cells, similar to C57BL/6J control animals (compare with phenotype in A, Lower Left). (Center) Similar to ipsilateral cortices of typical C57BL/6J mice 3 d after dMCAO, a population of GLAST+/Jagged1Hi cells (black oval) was observed for GFAP-CreER-Notch1-cKO mice treated with oil (compare with phenotype in A, Lower Right). (Right) Astroglial deletion of Notch1 in TM-treated GFAP-CreER-Notch1-cKO mice largely removed the GLAST+/Jagged1Hi cell population (red oval). Note: Each of the three FACS phenotypes in C represents 4.06 × 10⁵ cells.
Fig. S4.
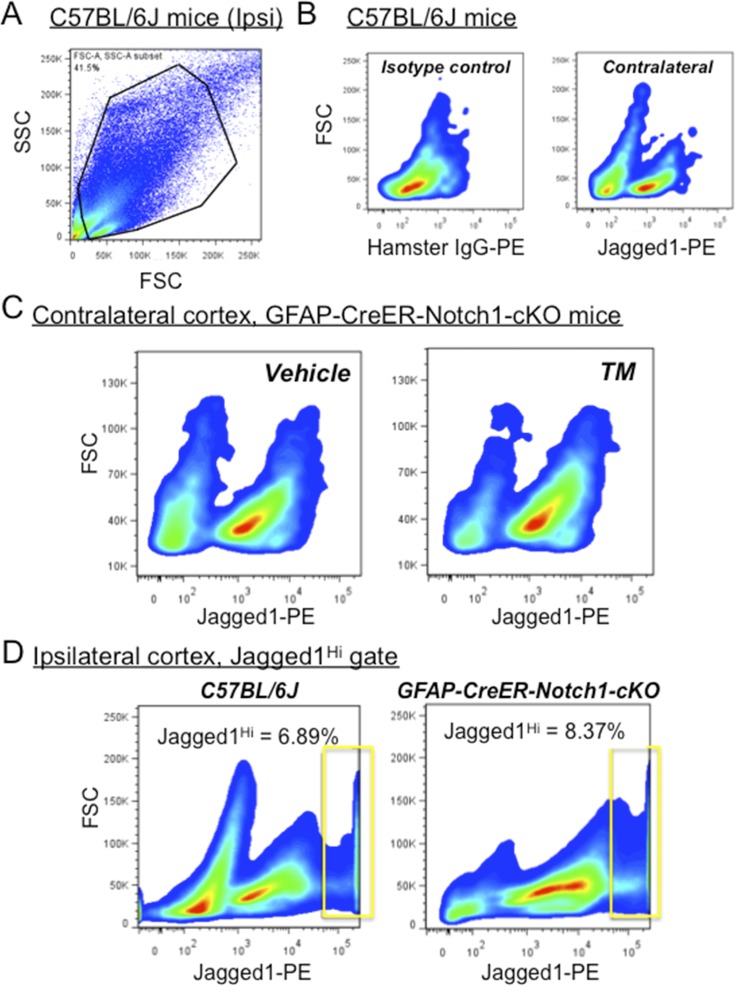
TM treatment does not alter the number of GLAST+/Jagged1+ cells from contralateral (uninjured) cortex after stroke. (A) GLAST+ input from MACS gated by side scatter (SSC) and forward scatter (FSC) of light. (B) Jagged1 phenotype of GLAST+ cells isolated by MACS from pooled contralateral cortical tissues of C57BL/6J mice (n = 4) at 3 d following dMCAO. Monoclonal antibody (PE) directed toward the extracellular domain of Jagged1 labels a population of cells that are immunoreactive in contralateral cortex that are not observed with isotype control staining (Left). (C) GLAST+ cells from contralateral cortex of GFAP-CreER-Notch1-cKO mice treated with TM or oil (vehicle) show similar populations of GLAST+/Jagged1+ immunoreactive cells (pooled results; n = 3 mice per treatment group). (D) GLAST+ cells from ipsilateral (injured) cortex from C57BL/6J and GFAP-CreER-Notch1-cKO vehicle-treated mice 3 d after stroke show similar percentages of Jagged1Hi cells (the gate is indicated by the rectangle). Data are smoothed x–y plots of GLAST+ cells subjected to FACS.
Differential Jagged1 expression on peri-infarct reactive astrocytes suggested that GLAST+ subpopulations varied in their level of Notch1 signaling. Based on their close proximity to the infarct core and their dependence on Notch1 signaling, we hypothesized that proliferating RC2+/ETBR+ reactive astrocytes belonged to the GLAST+/Jagged1Hi category of GLAST+ cells isolated from the peri-infarct area. To test this idea, we pooled live cell isolates from peri-infarct cortical tissues (n = 3 animals per group) and used the MACS/FACS strategy to assay GLAST+/Jagged1+ cells from GFAP-CreER-Notch1-cKO mice. Compared with control (vehicle-treated) GFAP-CreER-Notch1-cKO mice, we observed ablation of the GLAST+/Jagged1Hi cell population in TM-treated GFAP-CreER-Notch1-cKO mice (Fig. 2C). Injured (ipsilateral) cortex from C57BL/6J mice and from vehicle-treated GFAP-CreER-Notch1-cKO mice, which ostensibly should be normal, displayed similar percentages of GLAST+/Jagged1Hi cells [C57BL/6J: 6.89%; GFAP-CreER-Notch1-cKO (vehicle-treated): 8.37%] (Fig. S4). These results suggested that Jagged1/Notch1 signaling could occur between adjacent astrocytes to promote astroglial proliferation and potentially interact with ETBR-based signaling in RC2+/ETBR+ reactive astrocytes. The data also indicated that proliferating RC2+/ETBR+ reactive astrocytes belonged to the GLAST+/Jagged1Hi subpopulation.
Immobilized Jagged1 Induces ETBR and Promotes Reactive Astrocyte Proliferation.
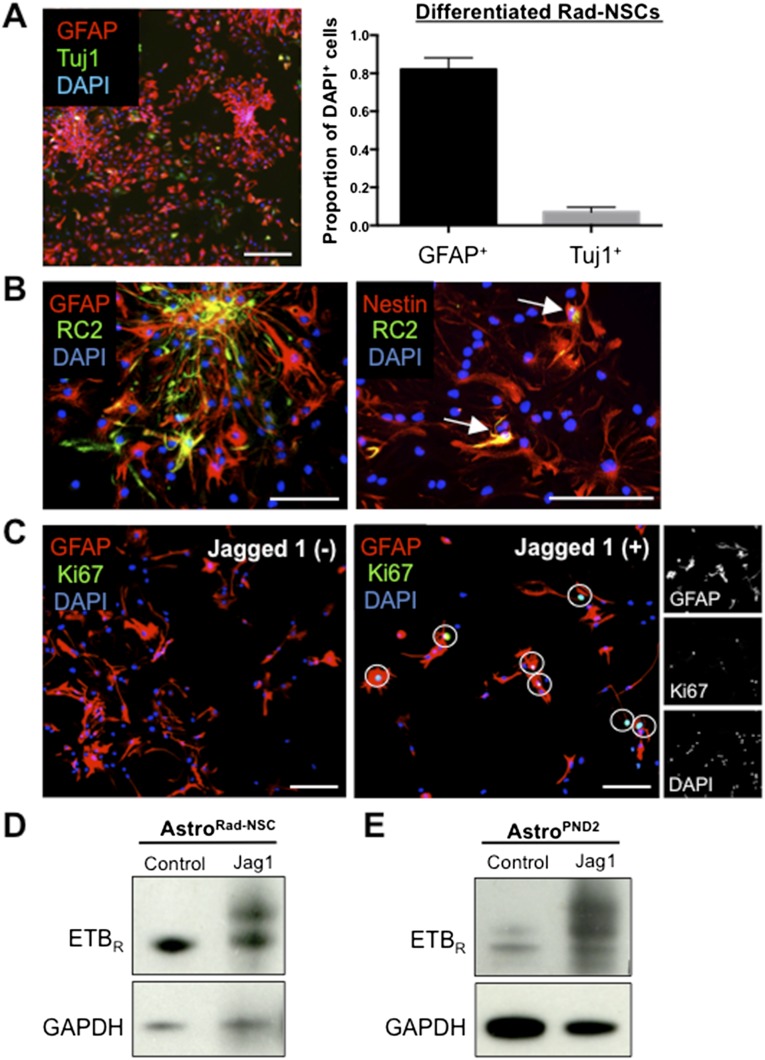
Although there is a conventional method for isolating and culturing astrocytes from neonatal mice, primary adult cortical reactive astrocytes survive poorly in culture. We recently reported the isolation and expansion of self-renewing, multipotent reactive astrocyte-derived neural stem cells (Rad-NSCs) derived from the cortical peri-infarct area after stroke (20). To avoid possible differences between neonatal and adult astrocytes, we developed methods to study signaling in adult astrocytes based on redifferentiated Rad-NSCs. After redifferentiation of Rad-NSCs in medium containing 10% FCS for 7 d, we obtained cultures that were 80% GFAP+/Tuj1− astrocytes (GFAP+: 82 ± 5.3%; Tuj1+: 7 ± 2.2%) (Fig. S5A). For clarity, we hereafter refer to the Rad-NSC–derived astrocytes as “AstroRad-NSC.” When maintained in serum-containing medium, most AstroRad-NSC expressed Nestin, and a few expressed the RC2 antigen (Fig. S5B). The above results suggested that AstroRad-NSC might be used to model reactive astrocyte signaling after brain injury.
Fig. S5.
Primary reactive astrocytes proliferate and increase ETBR expression when exposed to immobilized Jagged1. (A, Left) Passage 3–5 Rad-NSCs differentiated for 7 d provide GFAP+ (red) adult reactive astrocytes, AstroRad-NSC. (Scale bar, 200 µm.) (Right) Differentiation in medium containing 10% serum resulted in minor neuronal cell contamination (Tuj1 stain, green). (B) Subpopulations of AstroRad-NSC expressed GFAP (red) (Left), Nestin (red) (Right), and RC2 (green in both). All RC2+ cells coexpressed Nestin (white arrows). (Scale bars, 50 µm.) (C) AstroRad-NSC plated onto immobilized Jagged 1-Fc chimera proliferated and expressed Ki67 (white circles, Right), whereas AstroRad-NSC plated onto control surfaces did not proliferate or express Ki67 (Left). (Scale bars, 100 µm.) (D and E) By immunoblot, ETBR protein levels increased after cells were plated onto immobilized Jagged 1-FC for 2 d; this increase was observed for both AstroRad-NSC (D) and astrocytes from PND 2 mice (AstroPND2) (E).
Jagged1/Notch1 signaling requires mechanical tension between Jagged1 and Notch1, which interact between adjacent cell membranes. To promote Jagged1/Notch1 signaling, we plated AstroRad-NSC onto immobilized Jagged1. After 48 h, immobilized Jagged1 dramatically increased the number of RC2+/Ki67+ reactive astrocytes (Fig. S5C). To test whether exposure to Jagged1 could alter expression of ETBR, we plated AstroRad-NSC and postnatal day 2 (PND 2) astrocytes onto immobilized Jagged1; doing so markedly increased the level of ETBR for both AstroRad-NSC (Fig. S5D) and PND 2 astrocytes (Fig. S5E).
Regulation of Promoter Activity of the Gene Expressing ETBR.
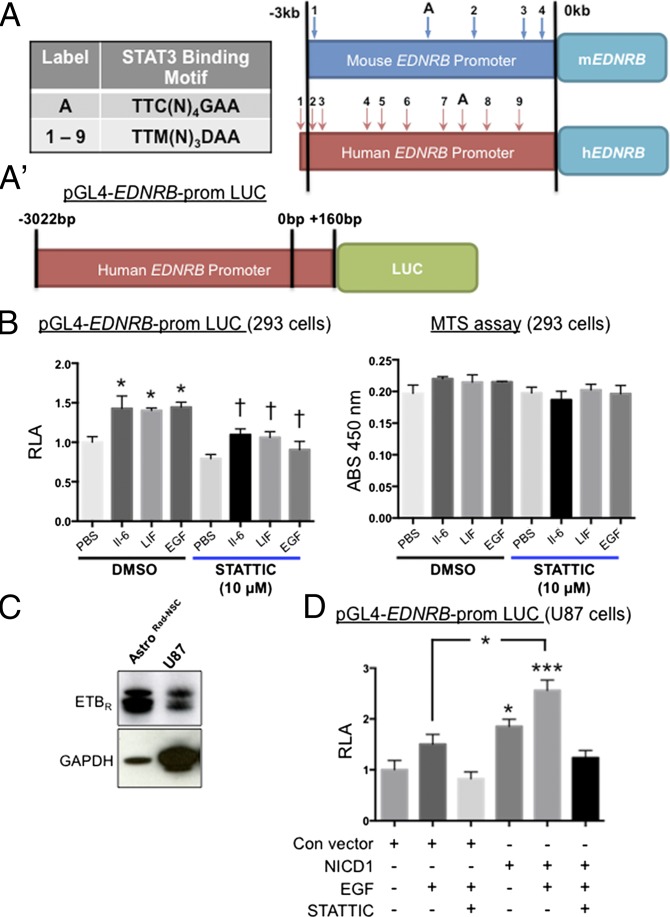
To investigate whether Notch intracellular domain 1 (NICD1)-mediated signaling might influence ETBR levels directly through enhanced transcription of the gene expressing ETBR (EDNRB), we analyzed the EDNRB promoter DNA sequence. NICD1 does not bind DNA directly and instead alters gene transcription by interacting with a DNA-binding transcription factor called CSL (CBF-1, suppressor of hairless, LAG-1). By promoter mapping, we did not find CSL DNA binding sequences within 10 kb of the ETBR coding sequence, indicating that the EDNRB promoter may not be regulated directly by NICD1. In contrast, we located multiple consensus sequences for STAT3 in human and murine EDNRB promoter regions that satisfied the TTM(N)3DAA (D: A, G, or T; M: A or C; N: A, G, T or C) motif (21) or the TTC(N)4GAA motif (22) (Fig. 3A and Table S1). To test for transcriptional regulation by STAT3, a pGL4 luciferase reporter vector containing the human EDNRB promoter sequence (−3,022 bp to +160 bp) was transfected into HEK 293 cells (23). We found that incubation of HEK 293 cells in IL-6 or LIF, cytokines that bind gp130 and signal through STAT3, led to a significant increase in EDNRB promoter activity (F = 8.51; n = 3; P = 0.0002; ANOVA) (Fig. 3B). Notably, this effect also occurred after the exposure of cells to EGF, which signals through EGF receptor (EGFR)/JAK2/STAT3 but not via gp130/JAK2/STAT3 (Fig. 3B). Next, we incubated the HEK 293 cells in IL-6, LIF, or EGF with the addition of STATTIC, a STAT3-specific pharmacological inhibitor that destabilizes p-STAT3 and prevents STAT3-mediated effects. In all cases, we observed that STATTIC attenuated the induction of EDNRB promoter activity that would be expected to occur after cytokine/growth factor incubation (Fig. 3B, Left). In some cases, a decrease in cell number resulting from inhibitor toxicity may appear to represent a reduction in promoter activity. As a control, we assayed cell viability on replicate plates under similar conditions of cytokine treatment and STATTIC. By assay of cellular metabolism using MTS (3-[4,5-dimethylthiazol-2-yl]-5-[3-carboxymethoxyphenyl]-2-[4-sulfophenyl]-2H-tetrazolium), treatment of HEK 293 cells with STATTIC was minimally cytotoxic (Fig. 3B, Right).
Fig. 3.
Transcriptional activity at the human EDNRB promoter is increased by NICD1 in a STAT3-dependent manner. (A) Mouse and human promoter sequences of the EDNRB gene contain multiple putative STAT3-binding sites. The schematic indicates the relative positions of sites (arrows with labels) upstream of the transcriptional start site (0 kb) that match the STAT3-binding motif TTM(N)3DAA (D: A, G, or T; M: A or C; N: A, G, T or C) (numbered 1 through 9) or motif TTC(N)4GAA (N: A, G, T or C) (labeled “A”). (Table S1.) (A′) Schematic of the reporter construct for the human EDNRB promoter (pGL4-hEDNRB-prom) used for transfection experiments and luciferase activity assays. A 3.5-kb span of the hEDNRB promoter was cloned upstream of the firefly luciferase gene (LUC). +160 bp indicates the position of the start codon. (B, Left) Relative luciferase activity (RLA) of HEK 293 cells transfected with pGL4-hEDNRB-promoter. After 3 h of incubation in IL-6 (50 ng/mL), LIF (20 ng/mL), or EGF (20 ng/mL), luciferase activity increased significantly relative to control (PBS/DMSO). STATTIC, a specific STAT3 inhibitor, abrogated these effects. Data are shown as mean ± SEM. *P < 0.05 vs. DMSO/PBS; †P < 0.05 vs. relevant DMSO/growth factor or DMSO/cytokine; ANOVA; n = 3. (Right) STATTIC did not affect cell viability (MTS assay). (C) Expression of ETBR by AstroRad-NSC and the human U87 cell line. (D) Compared with U87 cells transfected with control vector, U87 cells transfected with NICD1 significantly increased RLA. However, this increase was not seen in NICD1-transfected cells incubated in EGF with STATTIC or with STATTIC alone. Data are shown as mean ± SEM. *P < 0.05, ***P < 0.001; ANOVA; n = 3.
Table S1.
STAT3 DNA-binding consensus sequences are found in the human and murine EDNRB promoter
| Binding motif | Species | (ID), sequence, and promoter position in bp |
| TTC(N)4GAA | Human | (A) TTCATTTGAA, −1,175 |
| Mouse | (A) TTCATGGGAA, −1,512 | |
| TTM(N)3DAA | Human | (1) TTCCCCAAA, −3,012 |
| (2) TTACAATAA, −2,971 | ||
| (3) TTAAGTGAA, −2,875 | ||
| (4) TTACCTTAA, −2,695 | ||
| (5) TTATAAAAA, −2,609 | ||
| (6) TTCCATTAA, −1,904 | ||
| (7) TTACCTGAA, −1,298 | ||
| (8) TTAAAAAAA, −688 | ||
| (9) TTACGTGAA, −320 | ||
| Mouse | (1) TTAAAAAAA, −2,973 | |
| (2) TTCCCCAAA, −973 | ||
| (3) TTAGTAAAA, −330 | ||
| (4) TTAGCTAAA, −155 |
Promoter sites in mouse and human satisfying STAT3-binding motifs TTM(N)3DAA (D: A, G, or T; M: A or C; N: A, G, T, or C) or TTC(N)4GAA (N: A, G, T or C). Positions are relative to the transcriptional start sequence for transcript variant 1 in both human and mouse EDNRB. Human EDNRB sequence data were obtained from GenBank accession ID NG_011630 (www.ncbi.nlm.nih.gov/genbank/) with the transcriptional start point (position 0) located at 61,797 bp in sequence context. Mouse EDNRB sequence data were obtained from GenBank accession ID NC_000080.6 with the transcriptional start point located at 5,254 bp in sequence context.
EDNRB Promoter Activity Is Enhanced by Coincident NICD1/p-STAT3 Signaling.
Hes1 and Hes5, transcription factors that act downstream of Notch1 signaling, were shown to stabilize JAK2 and STAT3 complex formation, thereby increasing the level of p-STAT3 during glial development (24). Kamakura et al. (24) showed that STAT3 activity is critical for Notch-induced differentiation of embryonic radial glial cells and astrocytes. To determine if Notch1 signaling altered EDNRB transcription by enhancing STAT3 activity, we cotransfected NICD1 expression vector with pGL4-EDNRB promoter/Luc reporter. Acknowledging that HEK 293 cells could differ from glial cells, we performed additional studies with an astrocytoma cell line derived from malignant human glioma (U87 cells; ATCC no. 4TB-14). By immunoblotting, U87 cells expressed low but detectable levels of ETBR relative to AstroRad-NSC (Fig. 3C). In the presence of EGF, U87 cells transfected with pGL4-EDNRB promoter/Luc reporter exhibited EDNRB promoter activity that was enhanced by cotransfection with NICD1 expression plasmid (F = 14.71; n = 3; P = 0.0001; ANOVA) (Fig. 3D). Notably, the action of EGF and EGF/NICD1 on EDNRB promoter activity in U87 cells was attenuated in the presence of STATTIC (Fig. 3D). These data indicated that Notch1 signaling (NICD1) could enhance STAT3 activity, perhaps by stabilizing p-STAT3 as shown by Kamakura et al. (24).
Notch1 Signaling Stabilizes/Increases p-STAT Levels in Adult Reactive Astrocytes.
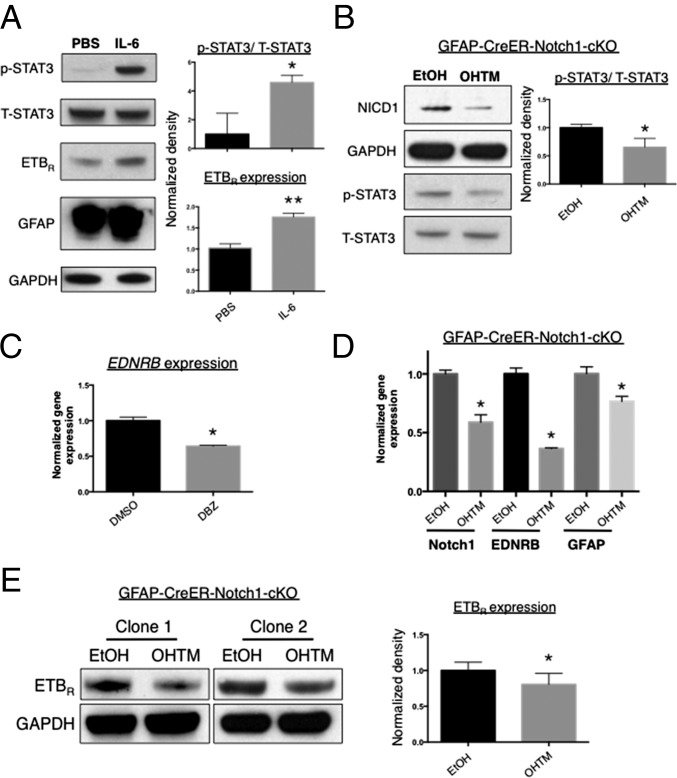
To examine whether increased phosphorylation of STAT3 in adult reactive astrocytes could induce ETBR expression, we incubated AstroRad-NSC in medium supplemented with IL-6. As expected, exposure of adult reactive astrocytes to IL-6 increased the level of p-STAT3 (P < 0.05) and also GFAP, a protein regulated at the transcriptional level by STAT3 (Fig. 4A). Of interest, we also observed an increase in ETBR levels (P < 0.01) (Fig. 4A). To determine whether Notch1 stabilized STAT3 signaling or promoted STAT3 activation, we performed a loss-of-function experiment by treating AstroRad-NSC from GFAP-CreER-Notch1-cKO mice with 4-OH-TM (hereafter OHTM) to remove Notch1 and blotted for p-STAT3. To test another factor known to stimulate gp130/JAK2/STAT3 signaling, we incubated cells with LIF. With the addition of LIF, we observed reduced NICD1 and p-STAT3 levels after 5–8 d of OHTM treatment compared with vehicle treatment (P < 0.05) (Fig. 4B).
Fig. 4.
Astroglial ETBR levels change in a manner correlated with STAT3 activation and are modified by the presence/absence of Notch1. (A) Incubation of AstroRad-NSC in IL-6 (50 ng/mL) for 2 d increased the level of activated p-STAT3, ETBR, and GFAP protein. n = 3. (B) AstroRad-NSC generated from Rad-NSC of GFAP-CreER-Notch1-cKO mice exhibited decreased cleavage of NICD1 after exposure to OHTM for 8 d in comparison with control cells treated with vehicle (ethanol, EtOH). n = 3. (C) LIF (20 ng/mL)-induced p-STAT3 levels were reduced in AstroRad-NSC after conditional deletion of Notch1. (Left) Immunoblot. (Right) Normalized band densities from immunoblot [ratio of p-STAT3 to T-STAT3]). n = 3. (C) Compared with vehicle (DMSO) treatment, exposure to a GSI (DBZ) for 24 h decreased EDNRB gene expression in AstroRad-NSC. Data are shown as mean ± SEM. *P < 0.001; unpaired t test; n = 3. (D) Notch1 cKO significantly reduced EDNRB expression in AstroRad-NSC. Data are shown as mean ± SEM. *P < 0.01; ANOVA; n = 3. (E) AstroRad-NSC differentiated from different clonal Rad-NSC lines had decreased levels of ETBR after Notch1 cKO. n = 5. Note: Rad-NSC clones 1 and 2 were isolated from separate GFAP-CreER-Notch1-cKO animals. *P < 0.05, **P < 0.01.
Jagged1/Notch1 Signaling Controls the Level of ETBR.
To test for effects of Notch signaling on ETBR, we exposed AstroRad-NSC to a GSI. By real-time quantitative RT- PCR (qRT-PCR) assays, incubation of reactive astrocytes in DBZ significantly reduced EDNRB transcription (Fig. 4C). To evaluate the effects of Notch1 signaling on ETBR in adult reactive astrocytes more specifically, we produced AstroRad-NSC using clonal Rad-NSCs isolated from the peri-infarct areas of GFAP-CreER-Notch1-cKO mice (20). By gene-expression assays, treatment of GFAP-CreER-Notch1-cKO reactive astrocytes with OHTM reduced mRNA for ETBR and GFAP; this reduction was coincident with a decrease in NICD1 transcript levels (Fig. 4D). Furthermore, OHTM treatment of GFAP-CreER-Notch1-cKO reactive astrocytes also significantly reduced ETBR protein expression (Fig. 4E).
ETBR Controls Reactive Astrocyte Proliferation in Vivo After Stroke.
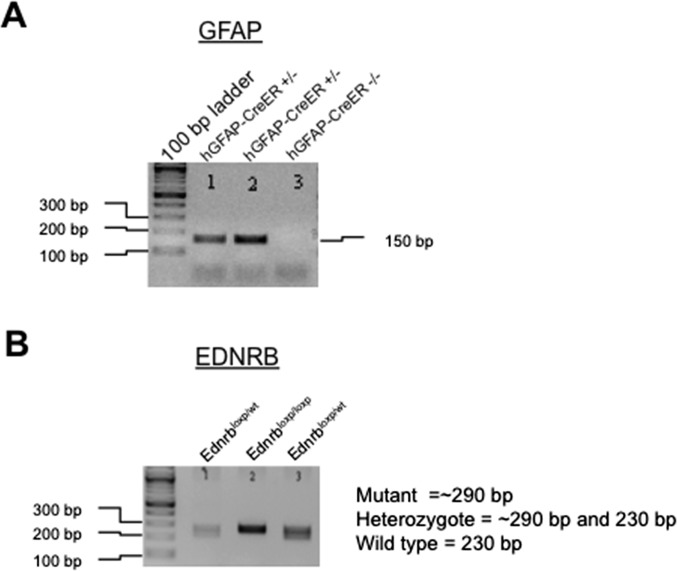
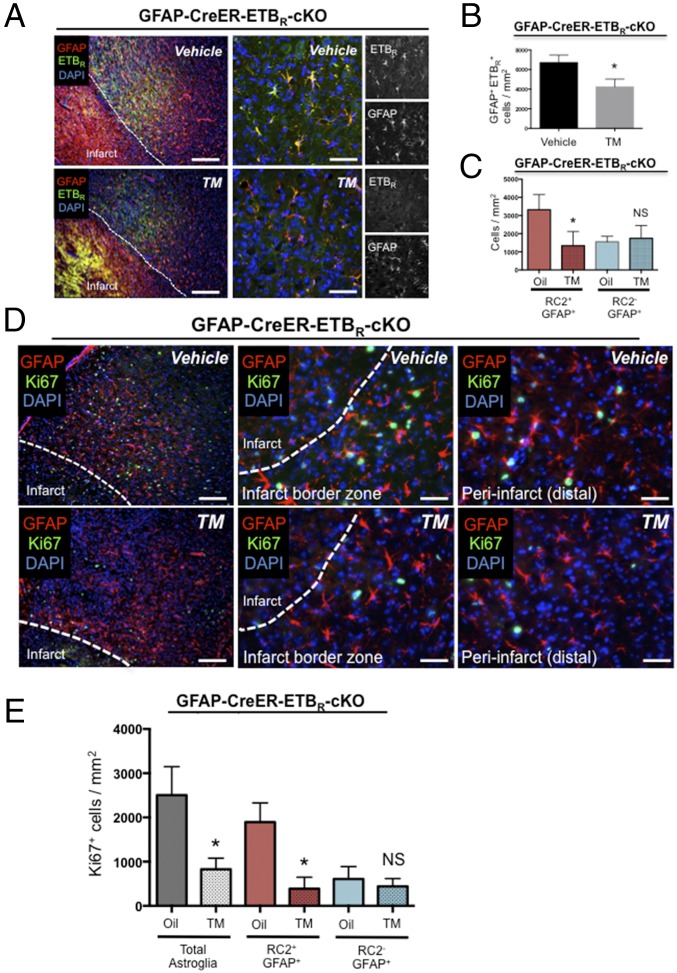
To examine the role of ETBR in the proliferation and/or function of reactive astrocytes, we generated GFAP-CreER-ETBR-cKO mice (Fig. S6). To determine if ETBR cKO affected reactive astrocytes, we obtained stereological counts from the peri-infarct area for the number of GFAP+/ETBR+ cells 30 d after TM administration and 3 d after dMCAO. The number of GFAP+/ETBR+ cells decreased significantly in TM-treated GFAP-CreER-ETBR-cKO mice compared with vehicle-treated control mice (vehicle-treated: 6,703 ± 447.5 cells/mm2; TM-treated: 4,233 ± 460.4 cells/mm2; n = 3 mice per group; P = 0.018) (Fig. 5 A and B). Of interest, we found no difference in the number of RC2−/GFAP+ cells in TM- and vehicle-treated GFAP-CreER-ETBR-cKO mice (vehicle-treated: 1,552 ± 176.1 cells/mm2; TM-treated: 1,743 ± 410.4 cells/mm2; n = 5 mice per group; P < 0.05) (Fig. 5C). However, TM treatment led to significantly reduced numbers of RC2+/GFAP+ cells relative to vehicle-treated controls (vehicle-treated: 3,318 ± 372.6 cells/mm2; TM-treated: 1,335 ± 353.0 cells/mm2; n = 5 mice per group; P = 0.01) (Fig. 5C).
Fig. S6.
Genotyping of GFAP-CreER-ETBR-cKO mice. (A) PCR for GFAP allele. (B) PCR for EDNRB allele. Note: Numbers 1, 2, and 3 correspond to the same individual mice for GFAP and EDNRB PCR reactions. Mouse #2 has the GFAP-ETBR-cKO genotype (hGFAP-CreERTM+/−:EdnrbloxP/loxP).
Fig. 5.
ETBR cKO depletes proliferative astrocytes in the peri-infarct area 3 d after stroke. (A) ETBR cKO significantly decreased the number of GFAP+/ETBR+ reactive astrocytes in the peri-infarct area 3 d after stroke. Note: Bright staining in infarct zone (A, Left) is autofluorescence/nonspecific background. Staining of cKO phenotype shows specificity of ETBR antisera. (Scale bars, 200 µm.) (B) Quantification of GFAP+/ETBR+ reactive astrocytes from tissue sections of brains with or without ETBR cKO. Data are shown as mean ± SEM. *P < 0.05; unpaired t test; n = 3 mice per group. (C) GFAP+/RC2+ reactive astrocytes, which are the majority of proliferating reactive astrocytes 3 d following stroke, were significantly decreased by ETBR cKO. In contrast, GFAP+ astrocytes negative for RC2 expression were not reduced in number. Data are mean ± SEM. *P < 0.01; ANOVA with Bonferroni; n = 5 mice per group. NS, not significant. (D) ETBR cKO reduced the number of actively dividing reactive astrocytes (Ki67+) 3 d after stroke. (Left) Representative low-magnification images from oil-treated and TM-treated GFAP-CreER-ETBR-cKO mice. (Scale bars, 100 µm.) (Center) Representative images of proximal peri-infarct area. (Scale bars, 30 µm.) (Right) Representative images of distal peri-infarct area. (Scale bars, 30 µm.) (E) ETBR cKO significantly reduced the number of proliferating reactive astrocytes in the peri-infarct area. Note: RC2+/GFAP+/Ki67+ (triple-positive) reactive astrocytes were significantly reduced in number within the peri-infarct area, whereas the number of RC2−/GFAP+/Ki67+ reactive astrocytes was not affected. Data are shown as mean ± SEM. *P < 0.01; ANOVA; n = 5 mice per group. NS, not significant.
Astroglial-specific deletion of ETBR before injury decreased the number of proliferating Ki67+/GFAP+ reactive astrocytes at 30 d after TM administration and 3 d after injury (vehicle-treated: 2,504 ± 288.9 cells/mm2; TM-treated: 829.9 ± 111.7 cells/mm2; n = 5 mice per group; P < 0.01) (Fig. 5 D and E). By triple immunohistochemistry, we observed a significant decrease in RC2+/Ki67+/GFAP+ reactive astrocytes in GFAP-CreER-ETBR-cKO mice at 3 d after dMCAO (vehicle-treated: 1,896 ± 193.4 cells/mm2; TM-treated: 388.2 ± 115.8 cells/mm2; n = 5 mice per group; P < 0.01) (Fig. 5D). However, the loss of ETBR did not affect the number of RC2−/Ki67+/GFAP+ reactive astrocytes, highlighting the importance of ETBR-based signaling for RC2+ reactive astrocytes localized in close proximity to the cortical injury (vehicle-treated: 607.1 ± 125.4 cells/mm2; TM-treated: 441.7 ± 79.60 cells/mm2; n = 5 mice per group; P < 0.05) (Fig. 5D). Consistent with the control of reactive astrogliosis in vivo by Notch1–STAT3–ETBR signaling, we observed a significant reduction in reactive astrocyte proliferation in GFAP-CreER-ETBR-cKO mice that phenocopied the reduced reactive astrocyte proliferation observed in GFAP-CreER-Notch1-cKO mice after stroke (8).
Discussion
After CNS injury, gene transcription increases for numerous proteins that control reactive astrocyte formation and function(s) (25, 26). For GFAP, signaling through Notch1, EGFR and/or gp130 drives gene transcription directly via canonical Notch (CSL)-binding promoter elements and STAT3-binding cis elements (27). In contrast, we found Jagged1/Notch1 signaling could promote ETBR expression indirectly by increasing p-STAT3. Importantly, most CNS injuries result in the local release of ET-1– and ETBR-mediated signaling as well as the secretion of growth factors/cytokines with signals transduced by STAT3 (28). After brain injury, ET-1, EGF, and IL-6 are released by several different cell types, including reactive astrocytes, and act in an autocrine/paracrine manner (29). ET-1 signaling through ETBR promotes the proliferation of primary astrocytes and glioblastoma cell lines (30–32), and pharmacological inhibition of ETBR was shown to reduce reactive astrocyte proliferation in vivo after brain-stab injury and lysolecithin-induced focal demyelination (33, 34).
Gene- and protein-expression patterns can differ among populations of reactive astrocytes in response to CNS injury (25, 26, 35). Here we identified a simple epitope profile (GLAST+/Jagged1+) for prospective isolation of three different reactive astrocyte subpopulations directly from injured cortical tissue. Of special interest, GLAST+/Jagged1Hi cells corresponded to the subset of RC2+/Nestin+/ETBR+ reactive astrocytes found closest to the infarct core after stroke; these cells required Notch1 and ETBR for proliferation. Previously, Notch1 signaling was reported to stabilize p-STAT3 in both normal and transformed cells (24, 36), and blockade of Notch1 signaling by GSI reduced stem-like glioblastoma cells and tumor growth in xenografts, prolonging host survival (37). Autocrine ETBR signaling is critical for self-renewal and survival of glioblastoma stem cells (tumor-initiating cells) (38), and pharmacological antagonists of ETBR decreased proliferation and survival of glioma and oligodendroglioma cells (31, 39). Our data from adult reactive astrocytes, neonatal astrocytes, HEK 293 cells, and U87 cells indicate the Notch1–STAT3–ETBR signaling axis may regulate numerous cell types that proliferate after tissue injury or transformation.
Materials and Methods
Detailed information for genotyping, dMCAO surgery, brain-stab injury, immunohistochemistry, immunocytochemistry, cell counting, Rad-NSC protocols, immunoblotting, real-time qRT-PCR, DNA constructs, and promoter activity assays is provided in SI Materials and Methods.
Mice.
All animal work was approved by the University of Vermont College of Medicine’s Office of Animal Care in accordance with the American Association for Accreditation of Laboratory Animal Care and National Institutes of Health guidelines (40). Adult male C57BL/6J mice (6–8 wk of age) were obtained from Taconic Farms. We obtained GFAP-CreER mice from Suzanne Baker, St. Jude Children’s Research Hospital, Memphis, TN (41). Notch1tm2Rko/GridJ mice (Notch1-flox mice; catalog no. 006951) and B6;129-Ednrbtm1Nat/J (EDNRB-flox mice; catalog no. 011080) were from JAX.
dMCAO Surgery.
Mice were anesthetized with isoflurane (1–5%; Webster Veterinary), and body temperature was maintained with a heated pad. Focal cerebral ischemia was produced by permanently occluding the middle cerebral artery (MCA) (8, 19, 20).
Statistical Analysis.
Statistical analyses were performed with GraphPad Prism software (version 6.0e). Individual groups were compared by Student’s t test (unpaired). Multiple comparisons were made by ANOVA with Bonferroni post hoc testing. P values of less than 0.05 were considered significant.
SI Materials and Methods
Genotyping.
Genotyping was performed with the REDExtract-N-Amp Tissue PCR Kit (XNAT-1KT; Sigma). We used the following primers: Notch1, forward: 5′-TGCCCTTTCCTTAAAAGTGG-3′, reverse: 5′-GCCTACTCCGACACCCAA TA-3′; EDNRB, forward: 5′-AGGAGACTGAATGCAGACCAGC, reverse: 5′-CATGTTACA GCTTGCTC CTGTG; GFAP-CreER, forward: 5′-AGCGATCGCTGCCAGGAT-3′, reverse: 5′-ACCAGCGTTTTCG TTCTGCC-3′.
dMCAO Surgery.
Mice were anesthetized with isoflurane (1–5%; Webster Veterinary), and body temperature was maintained with a heated pad. Under low-power magnification, the left temporo-parietal region of the head was shaved, and a U-shaped incision was made between the left orbit and the left ear. An incision was made superiorly on the upper margin of the temporal muscle forward. The MCA was observed through the semitranslucent skull. A small burr hole (1–2 mm) was drilled into the outer surface of the skull just over the MCA. The inner layer of skull was removed with fine forceps. The MCA then was encircled with 10-0 monofilament nylon suture (7V33; S&T), ligated, and transected superior to the ligation point. The small flap of temporo-parietal skin covering the skull was closed with Vetbond (3M Animal Care). For cKO mouse studies, animals received TM, 0.1 mg/g (T5648; Sigma), dissolved in 9:1 corn oil:absolute ethanol (vehicle) or in vehicle alone by i.p. injection for 3 consecutive days (d 0–3), followed by a 7-d or 20-d washout period, and then were subjected to dMCAO. Mice were killed humanely at 1, 3, 14, or 30 d after dMCAO.
Brain-Stab Injury.
Male C57BL/6J mice (6–9 wk of age) were used for the GSI/needle-stab study. Mice were anesthetized with isoflurane (1–5%; Webster Veterinary), and body temperature was maintained with a heated pad. After positioning on a stereotaxic apparatus (David Kopf frame equipped with an isoflurane adapter), a midline incision was made on the scalp, and the tissue was retracted. Two burr holes were drilled in the skull to dura. A 10 μL-Hamilton syringe attached to a 27-gauge needle was used to deliver GSI XX: DBZ (Calbiochem) prepared at 5 mg/mL in a 1:20 solution of DMSO and PBS to one burr hole. The other burr hole received vehicle only (1:20 DMSO/PBS). As an additional control, some mice were injected only with 1:20 DMSO/PBS. For all injections, 5 μL was injected over 5 min at a rate of 1 μL/min. Mice were killed 3 d after dMCAO.
Immunohistochemistry.
Mice were perfused transcardially, first with PBS and then with 4% (wt/vol) paraformaldehyde in PBS. Dissected tissue underwent additional fixation by overnight incubation in 4% paraformaldehyde in PBS at 4 °C, followed by equilibration in 30% (wt/vol) sucrose in PBS for 2 d at 4 °C. Brain tissue was placed in OCT compound and cut into 30-μm frozen sections on a cryostat (Leica). Frozen sections were dried for 30 min at 37 °C and incubated in PBS for 15 min. Tissue sections were then blocked in blocking buffer [5% (vol/vol) normal goat serum, 0.5% Triton X-100 in PBS] for 1 h at room temperature. They were then incubated separately in blocking buffer containing the following primary antibodies overnight at 4 °C: ETBR (1:150; SAB2700741; Sigma), GFAP (rabbit host) (1:1,000; Z0334; DAKO), GFAP (mouse host) (1:250; G3893; Sigma), or RC2 (1:50; University of Iowa Hybridoma Bank). Staining for Ki67 (1:500; Sp6 clone, ab16667; Abcam) was performed at room temperature overnight. After three PBS washes, sections were incubated in blocking buffer containing secondary antisera (Alexa Fluor 488 or Alexa Fluor 594; 1:1,000; Invitrogen) for 1 h at room temperature. Cell nuclei were stained with DAPI (Vector Laboratories). Isotype stains for rabbit IgG, mouse IgG, and mouse IgM (each at 2 μg/mL) were used as negative controls for immunohistochemical stains as in Shimada et al. (19). Photomicrographs were obtained with a confocal microscope (Zeiss LSM 510 META; Zeiss Microimaging) or an epi-fluorescence deconvolution microscope with an automated x,y,z stage (Leica DM6000B; Leica) and Leica FW4000 software.
Immunocytochemistry.
Cells were fixed with 4% paraformaldehyde at 4 °C for 10 min, rinsed three times in PBS, and blocked in blocking buffer (5% normal goat serum, 0.1% Triton X-100 in PBS) for 30 min. Primary antibodies were added separately to blocking buffer and incubated at 4 °C overnight or 1 h at room temperature: β-tubulin III (1:500; PRB-435P, Tuj1; Covance), ETBR (1:400; SAB2700741; Sigma), GFAP (rabbit host) (1:1,000; Z0334; DAKO), GFAP (mouse host) (1:500; G3893; Sigma), or RC2 (1:150; University of Iowa Hybridoma Bank).
Cell Counts.
The infarct area was defined by tissue autofluorescence, and the peri-infarct area was defined by the presence of RC2+ or GFAP+ reactive astrocytes. In mice, this area typically extends 200 µm radially from the stroke infarct core. One of every 10 serial sections was quantified for each animal. All cell counts were performed with observers blinded to slide (sample) identity. Cell numbers were assessed using stereology and Stereo Investigator software (MBF Biosciences). The fractionator probe method was used in the cortical peri-infarct area. Under low magnification (100×), the area of interest was identified, and the boundary contour was drawn using the software-pointing device. Spacing between sampling sites (grid size) was set so that 12–24 sampling sites were counted per section. Cells then were counted at high magnification (400×). For RC2+ and GFAP+ cell quantification, cell identity was ascertained by DAPI localization. We defined the outer peri-infarct area as the cortical tissue that covered 200–400 µm radially from the infarct core. All data were expressed as means and SEM. Stereo Investigator was used in conjunction with a Nikon Optiphot 2 microscope, a Hitachi HVC20 camera, a Heidenhahn focus encoder, and a motorized, computer-driven X–Z stage (all microscope attachments were provided by MBF Biosciences).
Immunoblotting.
Total protein was extracted from cells with a RIPA cell lysis buffer containing 1.0% Triton-X 100, 0.1% SDS, 0.5% deoxycholate, 50 mM Tris⋅HCL, 150 mM NaCl, 5 mM EDTA, 1× Protease Inhibitor Mixture (Roche), and 1× Phosphatase Inhibitor Mixture (Sigma) when required. Protein concentrations were determined with a Bio-Rad DC Protein Assay (Bio-Rad). Protein preparations were separated by SDS/PAGE and transferred to Immobilon-P membrane (PVDF; Millipore). The membrane was blocked with 5% (wt/vol) dry milk/1× PBS and then was incubated with primary antibody diluted in blocking buffer overnight at 4 °C or at room temperature for anti-GAPDH. After washes, the membrane was incubated with an HRP-conjugated secondary antibody for 1 h at room temperature. The blot was visualized with Western Lightning Plus-ECL (NEL103001EA; Pierce) and exposed to Kodak X-ray film. Equivalence of protein loading was verified by probing for GAPDH. We used the following primary antibodies: GFAP (1:2,000; Z0334; DAKO), GFAP (1:1,000; G3893; Sigma), cleaved NICD1 (1:1,000; AB8925; Abcam), ETRB (1:500; SAB2700741; Sigma), GAPDH (1:2,500; MAB374; Millipore), and GAPDH (1:2,500; G9545; Sigma). Films were scanned at 600 dots per inch for densitometry (ImageJ software).
Isolation and Culture of Rad-NSCs.
For isolation of Rad-NSCs, brains were removed 3 d after dMCAO, placed in a polyacrylic brain block (Acrylic Matrices, RBMA-200C; World Precision Instruments), and cut coronally into 1-mm sections. The sections were transferred into alpha-MEM (Invitrogen) in six-well plates. The cortical peri-infarct area was dissected under a light microscope. Tissues from the anterior lateral ventricle, posterior lateral ventricle, hippocampal arch, dentate gyrus, white matter, and third ventricle were carefully excluded. The tissues containing the peri-infarct area were harvested, diced into ∼1-mm3 pieces, and digested in enzyme digestion solution containing 200 U papain (Worthington), 20 μg/mL DNase (Worthington), 1.5 mM EDTA (Fisher Scientific), 1.5 mM CaCl2 (Sigma), 2 mg l-cysteine (Sigma), and DMEM/F12 medium (Lonza) at 37 °C for 20 min. Following enzymatic digestion, the tissues were triturated two times in trituration solution: 5 mL DMEM/F12 medium containing 15 mg trypsin inhibitor (Invitrogen) and 15 mg BSA (BSA; Fisher Scientific). Cells were resuspended in DMEM/F12 medium containing 0.9 M sucrose and were centrifuged to remove myelin (300 × g for 10 min). Cells were grown at a low density (10,000 cells/mL) in NSC growth medium containing 10 ng/mL EGF (BD Biosciences), 20 ng/mL recombinant human basic FGF (produced in our laboratory), 1× B27 supplement (Invitrogen), 2 mM l-glutamine (Mediatech), and 100 U/mL penicillin/100 μg/mL streptomycin in Neurobasal-A (Invitrogen) in 12-well plates (Nunc; Thermo Fisher Scientific). To generate clonal spheres, individual small spheres (10–100 cells) were pipetted under microscopy into separate 24-well plates 1 wk after plating. Clonally isolated neurospheres were expanded and passaged in NSC growth medium for further studies.
Isolation of Reactive Astrocytes or Rad-NSCs by MACS.
To isolate GLAST+ cells from peri-infarct ipsilateral cortical tissue and contralateral cortical tissue after dMCAO, we dissected and dissociated tissue to obtain a single-cell suspension (as above). Cell suspensions were blocked for 20 min at 4 °C with anti-mouse Fc receptor (FcR) blocking reagent to prevent nonspecific binding of mouse antibodies to FcR+ cells (130-092-575; Miltenyi Biotec). We then performed MACS using antibody to GLAST according to the manufacturer’s instructions (130-095-822; Miltenyi Biotec). Positive fractions from MACS isolates were lysed for immunoblotting, subjected to FACS, or cultured in NSC medium to obtain Rad-NSCs.
FACS of GLAST+ Cells After Isolation by MACS.
GLAST+ cells from ipsi- and contralateral cortex (1 × 10⁶ cells/mL) were incubated in 2 µg/mL of anti-CD339 (Jagged1) conjugated to phycoerythrin (PE; clone HMJ1-29, NBP2-00234; Novus Biologicals) or a matching isotype control (2 µg/mL; NB120-18474PE; Novus Biologicals) for 30 min at 4 °C in DMEM containing 0.5% BSA and 2 mM EDTA. Cells were washed three times with PBS and resuspended in PBS for FACS. FACS was performed with a BD FACSAria cell sorter equipped with a 488-nm (blue) Coherent Sapphire laser. Forward scatter and side scatter gates were chosen to exclude debris, doublets, and cell aggregates. The remaining events were sorted based on three gates: Jagged 1Neg, Jagged 1Lo, and Jagged 1Hi. In some cases, cells were sorted into complete culture medium (hereafter called “10% CCM”), consisting of 10% (vol/vol) FCS in 1× alpha minimum essential medium (MEM) (Corning Cellgro) supplemented with 2 mM l-glutamine (Corning Cellgro) and 100 U/mL penicillin/100 μg/mL streptomycin (Mediatech). Isolated cells were plated into 10% CCM at 1.66 × 10⁵ cells/cm2 into wells containing 12-mm glass coverslips that previously had been coated with mouse laminin and poly-d-lysine (5 µg/mL each). Flow cytometry plots were generated with FlowJo software version 7.6.5.
Isolation of PND 2 Astrocytes.
Primary astroglial cultures were prepared from C57BL/6J mice (PND 0–3) as described reported previously (8).
Ex Vivo Differentiation of Astrocytes from Rad-NSCs.
Rad-NSCs were expanded in NSC medium as neurospheres and dissociated with trypsin-EDTA. Dissociated cells were plated in 10% CCM at a density of 5.5 × 10⁵ cells/cm2 into 100-mm2 dishes (Nunc) previously coated with laminin/poly-d-lysine (5 μg/mL each; BD Biosciences). Under the above conditions, the plated cells differentiated for 7 d with medium changes every 2 d.
Experiments with Rad-NSCs.
For cKO of Notch1 in reactive astrocytes that were redifferentiated from Rad-NSCs of GFAP-CreER-Notch1-cKO mice, 10% CCM was removed and replaced with 10% CCM containing 1 μM 4-OH-TM (Sigma) or ethanol (vehicle control). This treatment was refreshed every 2 d for 5–8 d. For experiments with GSIs, cells were treated with DBZ (565789; Millipore) or DMSO (vehicle) for 2 d. For cytokine stimulation, astrocytes redifferentiated from Rad-NSCs were treated with IL-6 (50 ng/mL; I1395; Sigma), EGF (20 ng/mL; 354052; BD bioscience), or LIF (20 ng/mL; Peprotech) for 2 d in 10% CCM.
DNA Constructs.
The NICD1 coding sequence was removed from pCLEN (Addgene plasmid 17704) and cloned into lentiviral vector pWPT-GFP (Addgene plasmid 12255). For improved efficiency we generated a translational fusion between NICD1 and GFP using a viral F2A self-cleaving peptide (42). By PCR-based cloning we placed an F2A sequence between the NICD1 3′-end coding sequence and the 5′-end GFP coding sequence in such a way that bicistronic mRNA was translated into single polypeptide chain. The single chain undergoes self-cleavage into functional NICD1 and GFP proteins directly following translation. The human EDNRB promoter sequence including the region from −3,022 to +160 relative to the transcriptional start was subcloned into Kpn1 and Xho1 sites of vector pGL4.20[luc2/Puro] (Promega) to allow selection of puromycin-resistant cells.
Luciferase Promoter Assays.
HEK 293 cells were grown in 10% CCM to 70% confluence and were transfected with the pGL4:hEDNRB promoter construct in 2% CCM (i.e., 2% FCS) with Lipofectamine 3000 (Life Technologies). The vector pWPT-GFP (catalog no. 12255; Addgene) was cotransfected as an indicator of transfection efficiency. After 24 h the cells were seeded into 96-well plates at a density of 10,000 cells per well and were allowed to recover another 24 h. At 45 h posttransfection, 2% CCM was replaced with 2% CCM containing various cytokines (e.g., IL-6, LIF, EGF). The plate then was allowed to incubate for a further 3 h before luciferase activity was assessed (ONE-Glo reagent; catalog no. E6110; Promega). Luminescence was measured with a Synergy HT Multimode Microplate reader (BioTek Instruments, Inc.).
MTS Assay.
The CellTiter 96 AQueous One Solution Cell Proliferation Assay kit was used per the manufacturer’s instructions (Promega). Relative absorbance at λ = 490 nm was quantified with a Synergy HT Microplate reader.
Real-Time qRT-PCR.
RNA was extracted from cells using a High Pure RNA Isolation kit (Roche catalog no. 11828665001). After first-strand cDNA synthesis with the SuperScript III RT-PCR System (Life Technologies), relative quantification real-time PCR was performed as described by Tharp et al. (43), with minor modifications. Several TaqMan (Life Technologies) gene-expression kits and assays for mouse were used: Notch1-FAM, Mm00435249_m1; GFAP-FAM, Mm01253033_m1; EDNRB-FAM, Mm00432989_m1; and GAPDH-VIC, Mm99999915_g1. The cDNA input template was diluted 1:12, and GAPDH-VIC probe was added to each well as an internal control. All samples were run in triplicate. Real-time qRT-PCR was performed on an Applied Biosystems 7300 Real-Time PCR System with standard settings (Applied Biosystems Inc.). Gene-expression was normalized to internal GAPDH controls, and fold change was calculated using the 2−ΔΔCT method (44).
Acknowledgments
We thank Kazuhisa Takeda, MD, PhD (Tohoku University School of Medicine) for providing pGL3 vector containing EDNRB promoter DNA; Roxana del Rio-Guerra, PhD, (Harry Hood Bassett Flow Cytometry and Cell Sorting Facility at the University of Vermont) for assistance with FACS; Thomas Jetton, PhD, and William Tharp, MD, PhD, for assistance with microscopy and real-time qRT-PCR; Alexander Aronshtam, PhD, for technical support; and Krithika Rao, MS, for critical reading of the manuscript. This work was supported by National Institutes of Health Grant R01NS073815 (to J.L.S.). I.S.S. was supported by a postdoctoral fellowship from the American Heart Association, Grant 10POST3730026.
Footnotes
The authors declare no conflict of interest.
This article is a PNAS Direct Submission.
This article contains supporting information online at www.pnas.org/lookup/suppl/doi:10.1073/pnas.1501029112/-/DCSupplemental.
References
- 1.Pekny M, Nilsson M. Astrocyte activation and reactive gliosis. Glia. 2005;50(4):427–434. doi: 10.1002/glia.20207. [DOI] [PubMed] [Google Scholar]
- 2.Ridet JL, Malhotra SK, Privat A, Gage FH. Reactive astrocytes: Cellular and molecular cues to biological function. Trends Neurosci. 1997;20(12):570–577. doi: 10.1016/s0166-2236(97)01139-9. [DOI] [PubMed] [Google Scholar]
- 3.Bush TG, et al. Leukocyte infiltration, neuronal degeneration, and neurite outgrowth after ablation of scar-forming, reactive astrocytes in adult transgenic mice. Neuron. 1999;23(2):297–308. doi: 10.1016/s0896-6273(00)80781-3. [DOI] [PubMed] [Google Scholar]
- 4.Myer DJ, Gurkoff GG, Lee SM, Hovda DA, Sofroniew MV. Essential protective roles of reactive astrocytes in traumatic brain injury. Brain. 2006;129(Pt 10):2761–2772. doi: 10.1093/brain/awl165. [DOI] [PubMed] [Google Scholar]
- 5.Faulkner JR, et al. Reactive astrocytes protect tissue and preserve function after spinal cord injury. J Neurosci. 2004;24(9):2143–2155. doi: 10.1523/JNEUROSCI.3547-03.2004. [DOI] [PMC free article] [PubMed] [Google Scholar]
- 6.Sofroniew MV. Molecular dissection of reactive astrogliosis and glial scar formation. Trends Neurosci. 2009;32(12):638–647. doi: 10.1016/j.tins.2009.08.002. [DOI] [PMC free article] [PubMed] [Google Scholar]
- 7.Voskuhl RR, et al. Reactive astrocytes form scar-like perivascular barriers to leukocytes during adaptive immune inflammation of the CNS. J Neurosci. 2009;29(37):11511–11522. doi: 10.1523/JNEUROSCI.1514-09.2009. [DOI] [PMC free article] [PubMed] [Google Scholar]
- 8.Shimada IS, Borders A, Aronshtam A, Spees JL. Proliferating reactive astrocytes are regulated by Notch-1 in the peri-infarct area after stroke. Stroke. 2011;42(11):3231–3237. doi: 10.1161/STROKEAHA.111.623280. [DOI] [PMC free article] [PubMed] [Google Scholar]
- 9.Wanner IB, et al. Glial scar borders are formed by newly proliferated, elongated astrocytes that interact to corral inflammatory and fibrotic cells via STAT3-dependent mechanisms after spinal cord injury. J Neurosci. 2013;33(31):12870–12886. doi: 10.1523/JNEUROSCI.2121-13.2013. [DOI] [PMC free article] [PubMed] [Google Scholar]
- 10.Okada S, et al. Conditional ablation of Stat3 or Socs3 discloses a dual role for reactive astrocytes after spinal cord injury. Nat Med. 2006;12(7):829–834. doi: 10.1038/nm1425. [DOI] [PubMed] [Google Scholar]
- 11.Herrmann JE, et al. STAT3 is a critical regulator of astrogliosis and scar formation after spinal cord injury. J Neurosci. 2008;28(28):7231–7243. doi: 10.1523/JNEUROSCI.1709-08.2008. [DOI] [PMC free article] [PubMed] [Google Scholar]
- 12.Li Y, Chopp M. Temporal profile of nestin expression after focal cerebral ischemia in adult rat. Brain Res. 1999;838(1-2):1–10. doi: 10.1016/s0006-8993(99)01502-4. [DOI] [PubMed] [Google Scholar]
- 13.Chen Y, Swanson RA. Astrocytes and brain injury. J Cereb Blood Flow Metab. 2003;23(2):137–149. doi: 10.1097/01.WCB.0000044631.80210.3C. [DOI] [PubMed] [Google Scholar]
- 14.Bani-Yaghoub M, et al. Role of Sox2 in the development of the mouse neocortex. Dev Biol. 2006;295(1):52–66. doi: 10.1016/j.ydbio.2006.03.007. [DOI] [PubMed] [Google Scholar]
- 15.Park D, et al. The radial glia antibody RC2 recognizes a protein encoded by Nestin. Biochem Biophys Res Commun. 2009;382(3):588–592. doi: 10.1016/j.bbrc.2009.03.074. [DOI] [PubMed] [Google Scholar]
- 16.Misson JP, Edwards MA, Yamamoto M, Caviness VS., Jr Identification of radial glial cells within the developing murine central nervous system: Studies based upon a new immunohistochemical marker. Brain Res Dev Brain Res. 1988;44(1):95–108. doi: 10.1016/0165-3806(88)90121-6. [DOI] [PubMed] [Google Scholar]
- 17.Gaiano N, Nye JS, Fishell G. Radial glial identity is promoted by Notch1 signaling in the murine forebrain. Neuron. 2000;26(2):395–404. doi: 10.1016/s0896-6273(00)81172-1. [DOI] [PubMed] [Google Scholar]
- 18.Hartfuss E, Galli R, Heins N, Götz M. Characterization of CNS precursor subtypes and radial glia. Dev Biol. 2001;229(1):15–30. doi: 10.1006/dbio.2000.9962. [DOI] [PubMed] [Google Scholar]
- 19.Shimada IS, Peterson BM, Spees JL. Isolation of locally derived stem/progenitor cells from the peri-infarct area that do not migrate from the lateral ventricle after cortical stroke. Stroke. 2010;41(9):e552–e560. doi: 10.1161/STROKEAHA.110.589010. [DOI] [PMC free article] [PubMed] [Google Scholar]
- 20.Shimada IS, LeComte MD, Granger JC, Quinlan NJ, Spees JL. Self-renewal and differentiation of reactive astrocyte-derived neural stem/progenitor cells isolated from the cortical peri-infarct area after stroke. J Neurosci. 2012;32(23):7926–7940. doi: 10.1523/JNEUROSCI.4303-11.2012. [DOI] [PMC free article] [PubMed] [Google Scholar]
- 21.Bard JD, et al. Signal transducer and activator of transcription 3 is a transcriptional factor regulating the gene expression of SALL4. FASEB J. 2009;23(5):1405–1414. doi: 10.1096/fj.08-117721. [DOI] [PubMed] [Google Scholar]
- 22.Ehret GB, et al. DNA binding specificity of different STAT proteins. Comparison of in vitro specificity with natural target sites. J Biol Chem. 2001;276(9):6675–6688. doi: 10.1074/jbc.M001748200. [DOI] [PubMed] [Google Scholar]
- 23.Yokoyama S, Takeda K, Shibahara S. SOX10, in combination with Sp1, regulates the endothelin receptor type B gene in human melanocyte lineage cells. FEBS J. 2006;273(8):1805–1820. doi: 10.1111/j.1742-4658.2006.05200.x. [DOI] [PubMed] [Google Scholar]
- 24.Kamakura S, et al. Hes binding to STAT3 mediates crosstalk between Notch and JAK-STAT signalling. Nat Cell Biol. 2004;6(6):547–554. doi: 10.1038/ncb1138. [DOI] [PubMed] [Google Scholar]
- 25.Hamby ME, et al. Inflammatory mediators alter the astrocyte transcriptome and calcium signaling elicited by multiple G-protein-coupled receptors. J Neurosci. 2012;32(42):14489–14510. doi: 10.1523/JNEUROSCI.1256-12.2012. [DOI] [PMC free article] [PubMed] [Google Scholar]
- 26.Zamanian JL, et al. Genomic analysis of reactive astrogliosis. J Neurosci. 2012;32(18):6391–6410. doi: 10.1523/JNEUROSCI.6221-11.2012. [DOI] [PMC free article] [PubMed] [Google Scholar]
- 27.Ge W, et al. Notch signaling promotes astrogliogenesis via direct CSL-mediated glial gene activation. J Neurosci Res. 2002;69(6):848–860. doi: 10.1002/jnr.10364. [DOI] [PubMed] [Google Scholar]
- 28.Koyama Y, Michinaga S. Regulations of astrocytic functions by endothelins: Roles in the pathophysiological responses of damaged brains. J Pharmacol Sci. 2012;118(4):401–407. doi: 10.1254/jphs.11r13cp. [DOI] [PubMed] [Google Scholar]
- 29.Burda JE, Sofroniew MV. Reactive gliosis and the multicellular response to CNS damage and disease. Neuron. 2014;81(2):229–248. doi: 10.1016/j.neuron.2013.12.034. [DOI] [PMC free article] [PubMed] [Google Scholar]
- 30.MacCumber MW, Ross CA, Snyder SH. Endothelin in brain: Receptors, mitogenesis, and biosynthesis in glial cells. Proc Natl Acad Sci USA. 1990;87(6):2359–2363. doi: 10.1073/pnas.87.6.2359. [DOI] [PMC free article] [PubMed] [Google Scholar]
- 31.Paolillo M, Russo MA, Curti D, Lanni C, Schinelli S. Endothelin B receptor antagonists block proliferation and induce apoptosis in glioma cells. Pharmacol Res. 2010;61(4):306–315. doi: 10.1016/j.phrs.2009.11.003. [DOI] [PubMed] [Google Scholar]
- 32.Michinaga S, Ishida A, Takeuchi R, Koyama Y. Endothelin-1 stimulates cyclin D1 expression in rat cultured astrocytes via activation of Sp1. Neurochem Int. 2013;63(1):25–34. doi: 10.1016/j.neuint.2013.04.004. [DOI] [PubMed] [Google Scholar]
- 33.Koyama Y, et al. BQ788, an endothelin ET(B) receptor antagonist, attenuates stab wound injury-induced reactive astrocytes in rat brain. Glia. 1999;26(3):268–271. doi: 10.1002/(sici)1098-1136(199905)26:3<268::aid-glia8>3.0.co;2-g. [DOI] [PubMed] [Google Scholar]
- 34.Gadea A, Schinelli S, Gallo V. Endothelin-1 regulates astrocyte proliferation and reactive gliosis via a JNK/c-Jun signaling pathway. J Neurosci. 2008;28(10):2394–2408. doi: 10.1523/JNEUROSCI.5652-07.2008. [DOI] [PMC free article] [PubMed] [Google Scholar]
- 35.Egnaczyk GF, et al. Proteomic analysis of the reactive phenotype of astrocytes following endothelin-1 exposure. Proteomics. 2003;3(5):689–698. doi: 10.1002/pmic.200300407. [DOI] [PubMed] [Google Scholar]
- 36.Lee JH, et al. Notch signal activates hypoxia pathway through HES1-dependent SRC/signal transducers and activators of transcription 3 pathway. Mol Cancer Res. 2009;7(10):1663–1671. doi: 10.1158/1541-7786.MCR-09-0191. [DOI] [PubMed] [Google Scholar]
- 37.Fan X, et al. NOTCH pathway blockade depletes CD133-positive glioblastoma cells and inhibits growth of tumor neurospheres and xenografts. Stem Cells. 2010;28(1):5–16. doi: 10.1002/stem.254. [DOI] [PMC free article] [PubMed] [Google Scholar]
- 38.Liu Y, et al. Autocrine endothelin-3/endothelin receptor B signaling maintains cellular and molecular properties of glioblastoma stem cells. Mol Cancer Res. 2011;9(12):1668–1685. doi: 10.1158/1541-7786.MCR-10-0563. [DOI] [PMC free article] [PubMed] [Google Scholar]
- 39.Wan X, Zhang L, Jiang B. Role of endothelin B receptor in oligodendroglioma proliferation and survival: In vitro and in vivo evidence. Mol Med Rep. 2014;9(1):229–234. doi: 10.3892/mmr.2013.1746. [DOI] [PubMed] [Google Scholar]
- 40. Committee on Care and Use of Laboratory Animals (1996) Guide for the Care and Use of Laboratory Animals (Natl Inst Health, Bethesda), DHHS Publ No (NIH) 85-23.
- 41.Chow LM, Zhang J, Baker SJ. Inducible Cre recombinase activity in mouse mature astrocytes and adult neural precursor cells. Transgenic Res. 2008;17(5):919–928. doi: 10.1007/s11248-008-9185-4. [DOI] [PMC free article] [PubMed] [Google Scholar]
- 42.Carey BW, et al. Reprogramming of murine and human somatic cells using a single polycistronic vector. Proc Natl Acad Sci USA. 2009;106(1):157–162. doi: 10.1073/pnas.0811426106. [DOI] [PMC free article] [PubMed] [Google Scholar]
- 43.Tharp WG, et al. Measurement of altered AβPP isoform expression in frontal cortex of patients with Alzheimer’s disease by absolute quantification real-time PCR. J Alzheimers Dis. 2012;29(2):449–457. doi: 10.3233/JAD-2011-111337. [DOI] [PMC free article] [PubMed] [Google Scholar]
- 44.Livak KJ, Schmittgen TD. Analysis of relative gene expression data using real-time quantitative PCR and the 2(-Delta Delta C(T)) Method. Methods. 2001;25(4):402–408. doi: 10.1006/meth.2001.1262. [DOI] [PubMed] [Google Scholar]


