Abstract
The tolerance of microorganisms in biofilms to antimicrobial agents is examined through a meta-analysis of literature data. A numerical tolerance factor comparing the rates of killing in the planktonic and biofilm states is defined to provide a quantitative basis for the analysis. Tolerance factors for biocides and antibiotics range over three orders of magnitude. This variation is not explained by taking into account the molecular weight of the agent, the chemistry of the agent, the substratum material, or the speciation of the microorganisms. Tolerance factors do depend on the areal cell density of the biofilm at the time of treatment and on the age of the biofilm as grown in a particular experimental system. This suggests that there is something that happens during biofilm maturation, either physical or physiological, that is essential for full biofilm tolerance. Experimental measurements of antimicrobial penetration times in biofilms range over orders of magnitude, with slower penetration (>12 min) observed for reactive oxidants and cationic molecules. These agents are retarded through the interaction of reaction, sorption, and diffusion. The specific physiological status of microbial cells in a biofilm contributes to antimicrobial tolerance. A conceptual framework for categorizing physiological cell states is discussed in the context of antimicrobial susceptibility. It is likely that biofilms harbor cells in multiple states simultaneously (e.g., growing, stress-adapted, dormant, inactive) and that this physiological heterogeneity is an important factor in the tolerance of the biofilm state.
EXAMPLES OF REDUCED BIOFILM SUSCEPTIBILITY
Tolerance to antimicrobial agents is a common feature of microbial biofilm formation (1–7). Table 1 presents a few examples of biofilm tolerance to biocides and antiseptics, and Table 2 summarizes some examples of antibiotic tolerance in biofilms. Neither of these listings is comprehensive, but these two data sets can be analyzed to gain insight into the factors that influence biofilm tolerance. The examples have been selected to illustrate the wide variety of microbial species, growth environments, and antimicrobial chemistries for which biofilm reduced susceptibility has been reported. The short list in Table 1 encompasses studies designed to mimic biofilms in dental plaque, hot tubs, paper mills, drinking water, household drains, urinary catheters, food processing plants, cooling water systems, and hospitals. These examples employ a range of individual and mixed species biofilms and diverse biocidal chemistries including halogens, phenolics, quaternary ammonium compounds, aldehydes, a plant essential oil, and peroxides. The studies captured in Table 2 cover 19 antibiotics and 9 organisms that include aerobic bacteria, strict anaerobes, and a fungus.
TABLE 1.
Selected examples of tolerance of bacteria in biofilms to biocides and antiseptics
| Organisms | Agent | Molecular weight(g mole−1) |
Substratuma | (log10 cfu cm−2)Xo |
TF | References |
|---|---|---|---|---|---|---|
| Pseudomonas aeruginosa, | Hypochlorite, pH 11 | 52.5 | SS | 9.9 | 767 | 37 |
| Klebsiella pneumoniae | Chlorosulfamate | 131 | 272 | |||
| P. aeruginosa | Peracetic acid | 76.1 | PS | 8 | 6.7 | 67 |
| Aggregatibacter | Chlorhexidine | 506 | CN | 7.48 | 2.7 | 68 |
| actinomycetocomitans | Cetylpyridinium chloride | 340 | 3.4 | |||
| Legionella in mixed species | Glutaraldehyde | 100 | RR | 6.1 | 2.0 | 69 |
| Bromo-nitropropane-diol | 200 | 1.0 | ||||
| P. aeruginosa | Hydrogen peroxide | 34 | PE | 6.65 | 2.8 | 70 |
| Mixed drinking water | Chlorine dioxide | 67.5 | G | 5.3 | 1.0 | 71 |
| Staphylococcus aureus | Benzalkonium chloride | 360 | G | 7.9 | 52 | 38 |
| P. aeruginosa | Bromine | 96.9 | PC | 5.3 | 1.4 | 72 |
| P. aeruginosa | Benzylchlorophenol, | 195 | G | 8.5 | 7.4 | 39 |
| S. aureus | phenylphenol | 4.2 | ||||
| Salmonella typhimurium | Triclosan | 290 | Pellicle | 7.2 | 20 | 73 |
| Citrobacter diversus | Povidone-iodine | 365 | S | 8.8 | 11 | 74 |
| Listeria monocytogenes | Iodine | 254 | SS | 5.2 | 1.7 | 8 |
| Mixed paper mill white water | Thymol | 150 | SS | 7.7 | 1.1 | 75 |
| Mixed oral | Chlorhexidine | 506 | HAP | 9 | 13.5 | 76 |
Abbreviations: SS, stainless steel; PS, polystyrene; CN, cellulose nitrate; RR, red rubber; PE, polyester; G, glass; PC, polycarbonate; S, silicone; BR, Buna rubber; HAP, hydroxyapatite
TABLE 2.
Selected examples of tolerance of bacteria or fungi in biofilms to antibiotics
| Organisms | Agent | Molecular weight(g mole−1) |
Substratuma | (log10 cfu cm−2)Xo |
TF | References |
|---|---|---|---|---|---|---|
| Propionibacterium acnes | Rifampin | 823 | G | 4 | 77 | |
| Daptomycin | 1620 | 16 | ||||
| Vancomycin | 1468 | 16 | ||||
| Penicillin G | 334 | 2 | ||||
| Corynebacterium urealyticum | Ciprofloxacin | 330 | PS | 2048 | 78 | |
| Moxifloxacin | 401 | 512 | ||||
| Vancomycin | 1468 | 512 | ||||
| Pseudomonas aeruginosa | Gentamicin | 478 | 4 | 79 | ||
| Tobramycin | 468 | 4 | ||||
| Ciprofloxacin | 330 | 8 | ||||
| Ofloxacin | 361 | 4 | ||||
| P. aeruginosa | Tobramycin | 468 | SS | 9.6 | 4.4 | 80 |
| Ciprofloxacin | 330 | 3.5 | ||||
| K. pneumoniae | Ciprofloxacin | 330 | PC | 10.3 | 90 | 64 |
| Ampicillin | 371 | 10.2 | 14 | |||
| Staphylococcus epidermidis | Ciprofloxacin | 330 | SS | 8.9 | 14 | 81 |
| Rifampin | 823 | 7 | ||||
| P. aeruginosa | Tobramycin | 468 | PC | 10.4 | 265 | 82 |
| Ciprofloxacin | 330 | 104 | ||||
| P. aeruginosa | Tobramycin | 468 | S | 8.3 | 208 | 45 |
| 7.4 | 1.5 | |||||
| S. aureus | Nisin | 3354 | PS | 7.5 | 5.3 | 83 |
| Vancomycin | 1468 | 7.8 | 55 | |||
| S. epidermidis | Levofloxacin | 350 | G | 10.3 | 12 | 48 |
| Vancomycin | 1468 | 157 | ||||
| Porphyromonas gingivalis | Amoxicillin | 365 | CA | 3.3 | 84 | |
| Doxycycline | 444 | 21 | ||||
| Metronidazole | 171 | 4.2 | ||||
| Staphylococcus lugdunensis | Cefazolin | 456 | PS | 256 | 85 | |
| Rifampin | 823 | 4 | ||||
| Daptomycin | 1620 | 64 | ||||
| Moxifloxacin | 401 | 4 | ||||
| Naficillin | 414 | 16 | ||||
| Candida albicans | Amphotericin B | 923 | PVC | 3.4 | 86 | |
| C. albicans | Fluconazole | 306 | PVC | 4.4 | 87 |
Abbreviations: as for Table 1; CA, cellulose acetate; PVC, polyvinyl choride
Biofilm reduced susceptibility is quantified in Tables 1 and 2 by a tolerance factor, TF, defined as:
where CP and CB denote planktonic and biofilm dose concentration, respectively, tP and tB denote planktonic and biofilm dose duration, respectively, and LRP and LRB denote the measured log reduction in planktonic and biofilm populations, respectively.
TF compares the rate of killing in the planktonic and biofilm states. For example, a value of TF = 10 means that biofilm killing is 10 times slower than in the planktonic condition. A quick inspection of Tables 1 and 2 reveals that the tolerance factor ranges widely, from a value of 1.0 (no difference at all between suspended and sessile susceptibility) to a value of more than 1,000.
FACTORS INFLUENCING BIOFILM SUSCEPTIBILITY
One of the challenges of understanding biofilm tolerance is the large number of factors that likely influence the susceptibility in a particular biofilm. Some of the factors that could be important are antimicrobial chemistry, substratum material, areal cell density or thickness, biofilm age, microbial speciation, and medium composition. Here I attempt to shed some light on some of these factors by meta-analyses of the literature.
Antimicrobial Chemistry
When the tolerance factors for biocides reported in Table 1 are regressed against the molecular weight of the antimicrobial agent, no correlation whatsoever is apparent (Fig. 1A; R2 = 0.0007). Indeed, this value of R2 suggests that none of the considerable variation in TF can be attributed to the size of the antimicrobial molecule itself. A similar analysis of the tolerance factors for antibiotics (Table 2) also reveals no correlation (Fig. 1B; R2 = 0.012). There are no reports in the literature demonstrating that antimicrobial size is a predictor of efficacy against biofilms.
FIGURE 1.
Tolerance factors versus antimicrobial agent molecular weight for the data on (A) biocides and antiseptics from Table 1 and (B) antibiotics from Table 2. doi:10.1128/microbiolspec.MB-0010-2014.f1
TF ranges widely even for a single antimicrobial agent. For example, values of TF for tobramycin measured against just one bacterium, Pseudomonas aeruginosa, run from 1.5 to 265. TF values for ciprofloxacin, measured against four different bacteria, range from 3.5 to 2,048. It will be seen shortly that the rate of biofilm killing by chlorine ranges over three orders of magnitude even when scaled for the dose concentration. These observations suggest that the numerical value of TF is not specific to a particular antimicrobial agent. Put another way, at least at this point in time, the chemistry of a particular antimicrobial does not allow us to predict its relative efficacy against a biofilm.
At the risk of redundancy, it is important not to extrapolate a TF value pulled from the tables compiled here to some other system. It is to be expected that if more measurements were available, we would find that TF values for every antimicrobial range widely.
Substratum Material
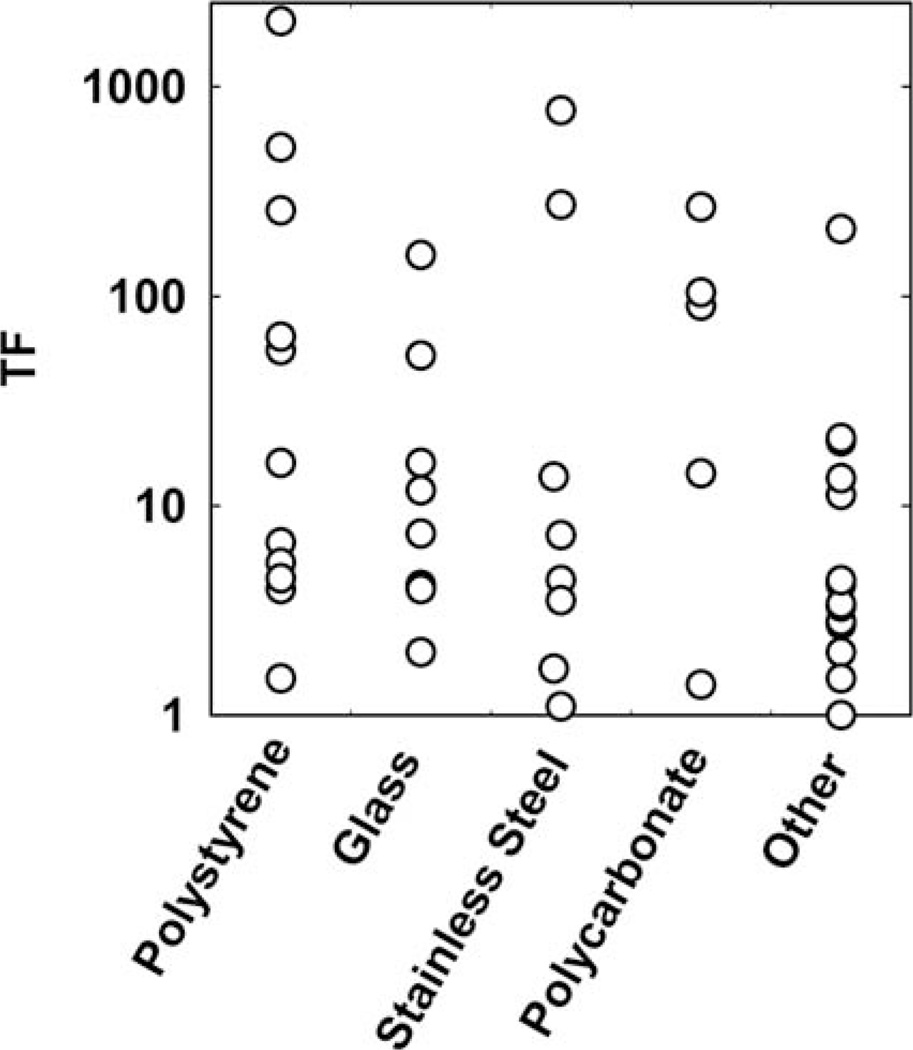
The data compiled in Tables 1 and 2 reflect measurements made using biofilms formed on a wide variety of materials: polystyrene, glass, stainless steel, cellulose acetate or nitrate, polycarbonate, silicone, polyvinyl chloride, rubber, polyester, and hydroxyapatite. Though analysis of variance of these data (plotted in Fig. 2) indicates a borderline statistically significant difference between the five groups (p = 0.053), I suspect that the root of this difference is in methodology rather than material. The polystyrene group, which has somewhat higher TF values, is all data from multiwell plates. Most of the data collected in plate assays derive from a series of antimicrobial concentrations as opposed to kill data in time. This method can produce very high TF values with antibiotics when delivered at extremely high (and not physiologically relevant) concentrations. Inspection of the data shows that TF ranges by two orders of magnitude for a given material (Fig. 2). For example, tolerance factors reported for biofilms grown on stainless steel (n = 8) range from 1.1 to 767.
FIGURE 2.
Tolerance factors grouped and compared by substratum material. doi:10.1128/microbiolspec.MB-0010-2014.f2
There may be occasional situations in which the substratum material does influence biofilm accumulation and antimicrobial tolerance. For example, whereas iodine was relatively effective at killing Listeria on stainless steel (TF = 1.7), it was ineffective against the same strain when biofilms were formed on Buna rubber (TF = 70) (8). Buna rubber was shown to have an independent bacteriostatic effect. Biofilms formed on mild steel, in which some corrosion of the metal was evident, were less susceptible to killing by monochloramine than biofilms on stainless steel (9). These examples suggest that the substratum material is most likely to influence biofilm susceptibility when it leaches or corrodes.
Cell Density
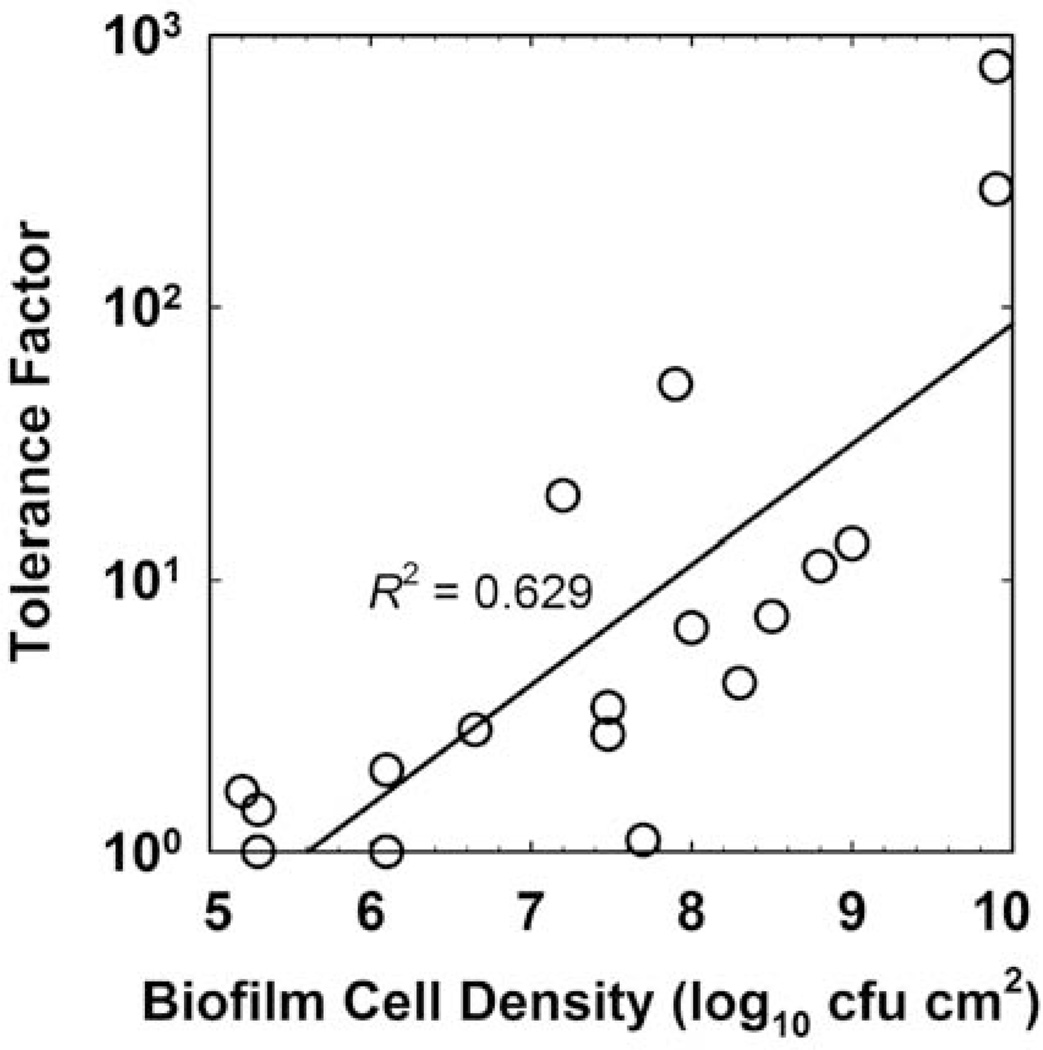
When the tolerance factors for biocides and antiseptics tabulated in Table 1 are regressed against the untreated control biofilm areal cell density (measured in units of log10 CFU cm−2), a clear correlation emerges (Fig. 3; R2 = 0.629). To put these values in terms of the approximate thickness of the biofilm, a biofilm of 6.0 log10 CFU cm−2 corresponds roughly to a sparse monolayer, whereas the most massive biofilm in this data set (9.9 log10 CFU cm−2) was nearly 1 mm thick. This result shows that tolerance to biocides depends on the extent of biofilm accumulation.
FIGURE 3.
Tolerance factor versus biofilm cell density for the data in Table 1. The line is the least squares regressed fit. doi:10.1128/microbiolspec.MB-0010-2014.f3
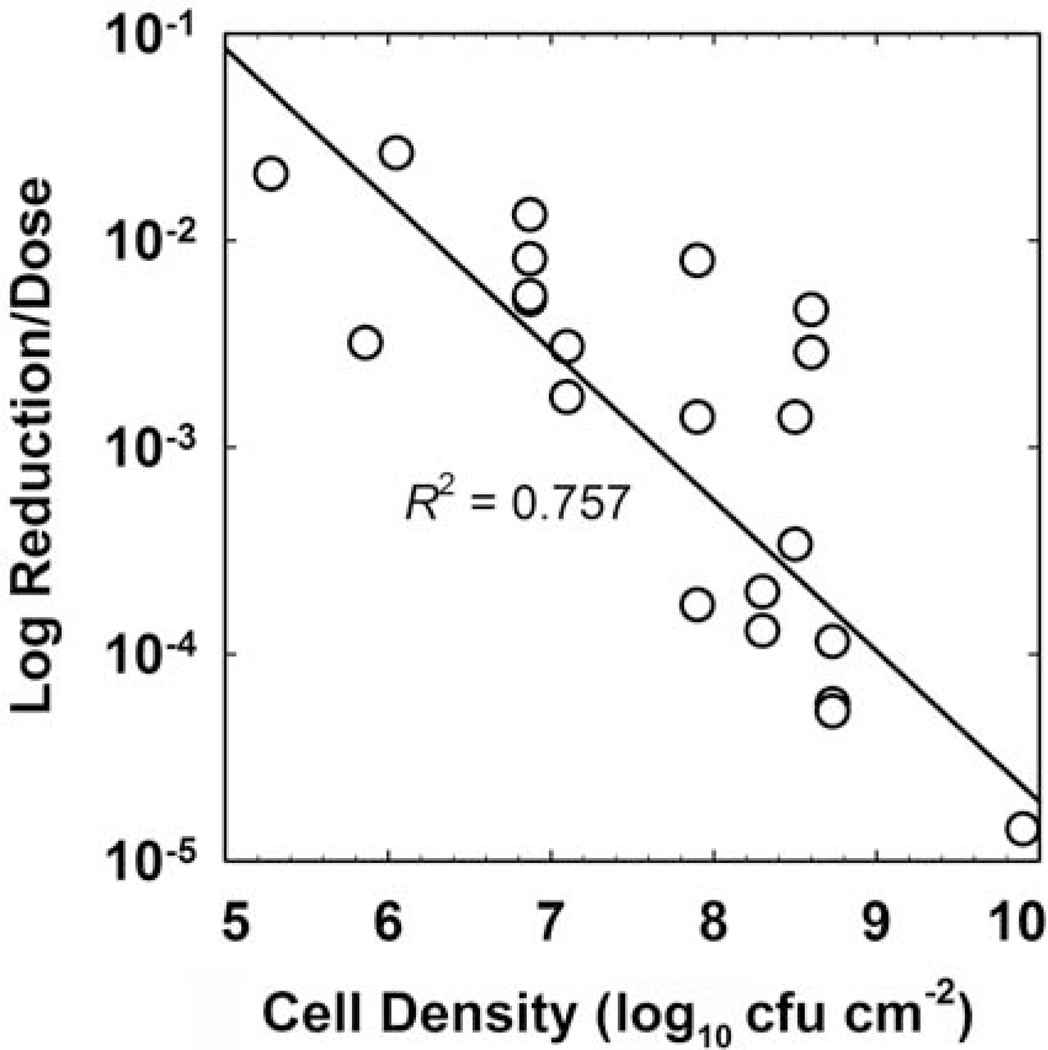
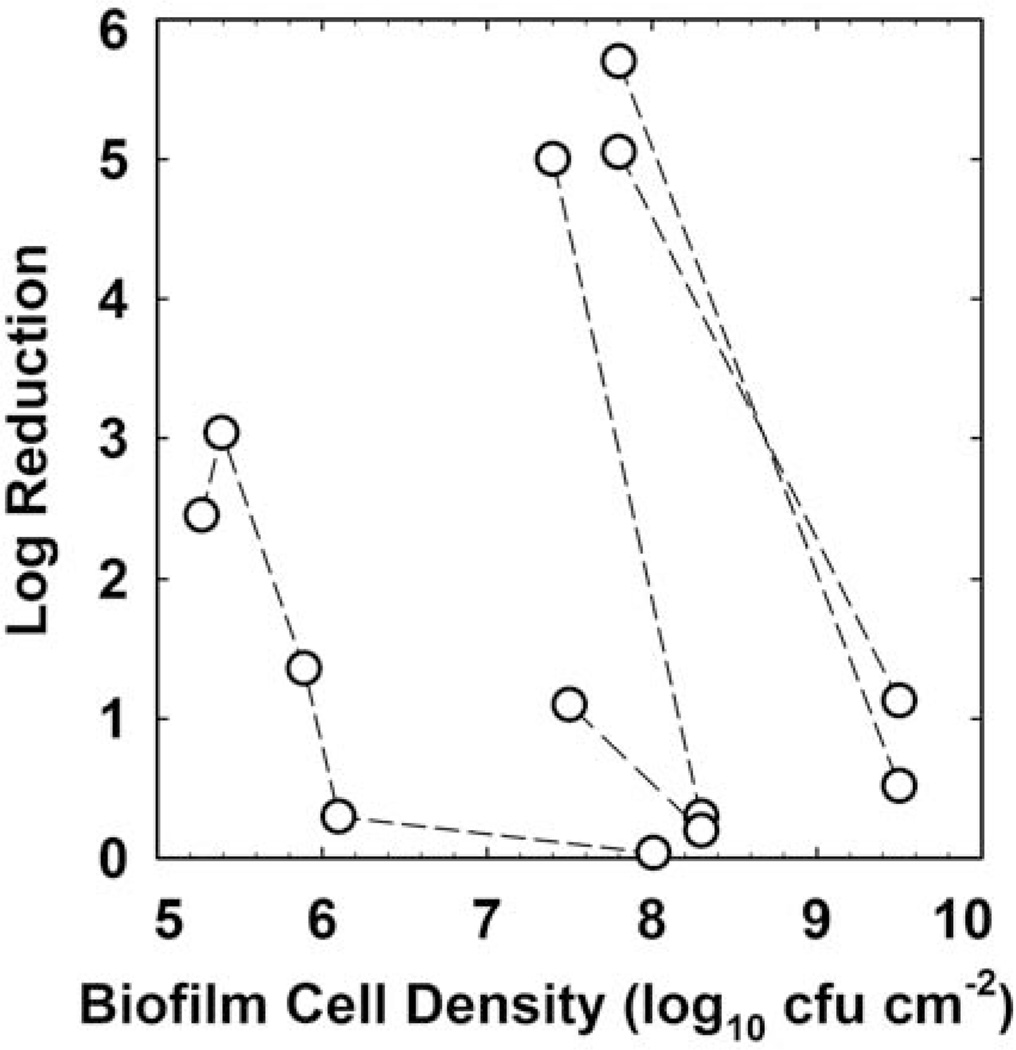
There are few biocides for which there is sufficient data available to perform an agent-specific analysis of the role of biofilm cell density in susceptibility. Chlorine is one such agent, and Figure 4 presents a correlation (R2 = 0.757) that reinforces an important role for the extent of biofilm accumulation prior to treatment in determining the efficacy of a chlorine dose. This analysis includes data from nine independent investigations using Staphylococcus, Pseudomonas, Listeria, Salmonella, and mixed-species biofilms. There is also an important dependence of biofilm antibiotic tolerance on the cell density of the biofilm. This is most clearly demonstrated in investigations which have challenged biofilms at different stages of development with the same antibiotic dose. Older, thicker biofilms are invariably less susceptible than younger, less dense biofilms (Fig. 5). The overall correlation of log reduction with cell density is poor in this case (R2 = 0.125), but the effect within an investigation is obvious and consistent.
FIGURE 4.
Efficacy of chlorine treatment against biofilms as a function of the untreated control biofilm areal cell density. The y-axis is the reported log reduction divided by the product of dose concentration and duration (CBtB). The line is the least squares regressed fit. Sources: references 8, 37–44. doi:10.1128/microbiolspec.MB-0010-2014.f4
FIGURE 5.
Antibiotic efficacy against Pseudomonas aeruginosa biofilms as a function of the untreated control biofilm areal cell density. Dashed lines connect data points from the same investigation. The antibiotics used include tobramycin, cipro-floxacin, and gentamicin. Sources: references 11, 45–47. doi:10.1128/microbiolspec.MB-0010-2014.f5
Age
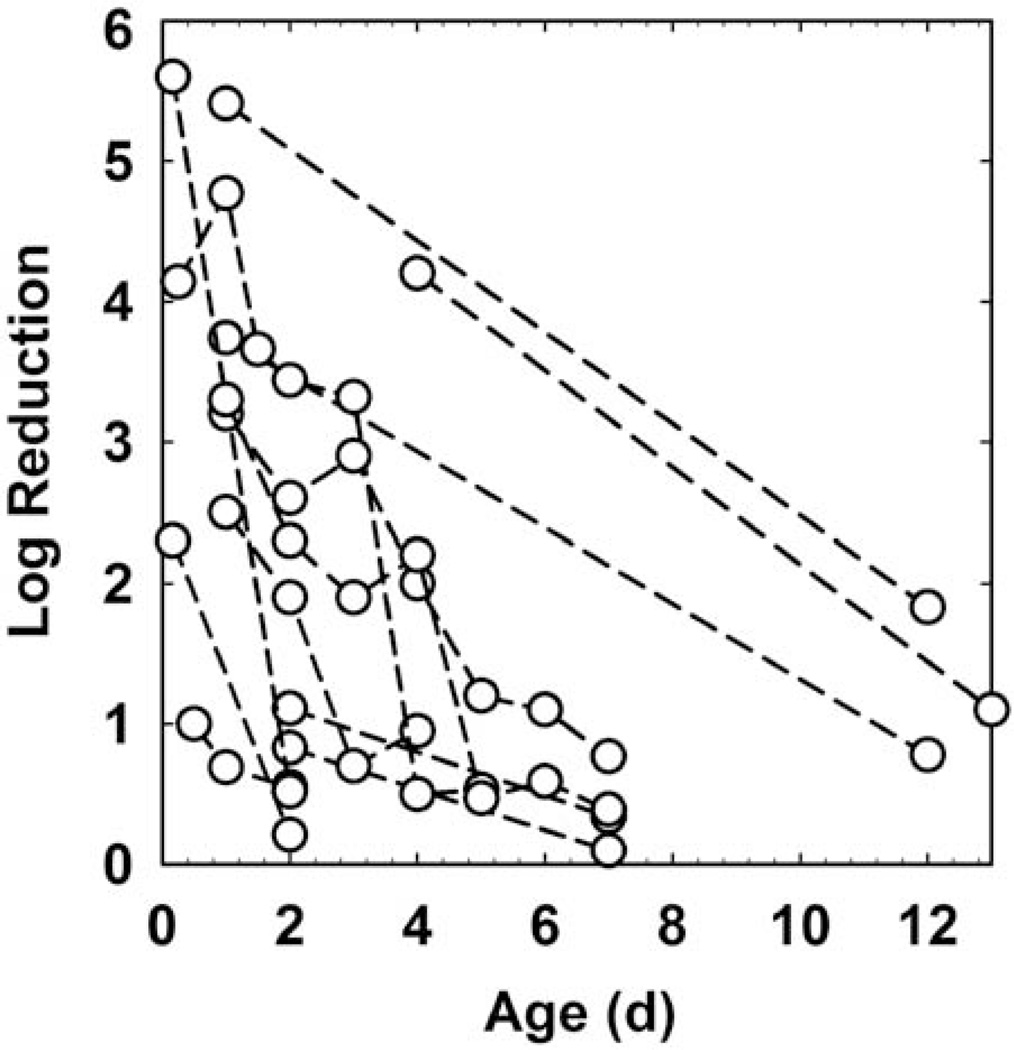
Several investigations have compared the efficacy of identical antimicrobial challenges against biofilms of different ages. Within a given experimental system, bio-films tend to become less susceptible as they age (Fig. 6), though here again the overall correlation is not strong (R2 = 0.217). Assuming a first order process, the characteristic time (expressed as a half-life) for biofilm tolerance to develop as determined from these data sets was 2.7 ± 2.0 days (n = 12). This suggests that, at least in vitro, biofilm tolerance manifests over a timescale of a few days. This result also provides an important clue that the biological state of the organisms in a biofilm is a key factor in determining their susceptibility.
FIGURE 6.
Antimicrobial efficacy as a function of biofilm age. Dashed lines connect data points from the same investigation. Sources: references 11, 25, 45, 47, 48–51. doi:10.1128/microbiolspec.MB-0010-2014.f6
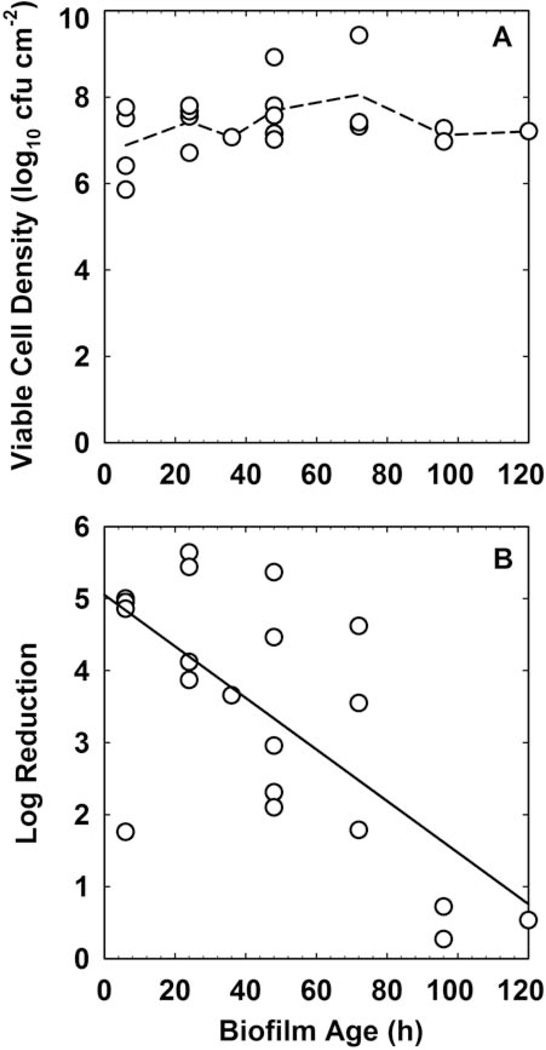
Biofilm age and biofilm cell density are usually strongly correlated. The effects of these two parameters are therefore easily confounded. Is the difference in susceptibility between 2-day-old and 7-day-old biofilms (10) a function of age or a function of the substantial difference in biofilm accumulation at these two time points? Here I analyze one data set where, fortuitously, it is possible to separate these two parameters. Wolcott et al. (11) reported on the challenge of Staphylococcus aureus biofilm with gentamicin. During more than 100 h of the maturation of the biofilm there was little change in the biofilm cell density (Fig. 7A). Biofilms removed at different ages were treated with gentamicin, and the log reduction in viable counts was determined. This log reduction did not correlate with the untreated control biofilm cell density (R2 = 0.087). There was correlation between the biofilm susceptibility to gentamicin and biofilm age (Fig. 7B; R2 = 0.470).
FIGURE 7.
(A) Maturation of S. aureus biofilm and (B) change in gentamicin susceptibility with age. The dashed line in panel A connects the mean values at each time point. The solid line in panel B is the least squares regressed fit. Source: reference 11. doi:10.1128/microbiolspec.MB-0010-2014.f7
Though the preceding example indicates a more important role for biofilm age than for cell density, in general it is very difficult to uncouple the individual contributions of age and density to biofilm tolerance.
Species Composition
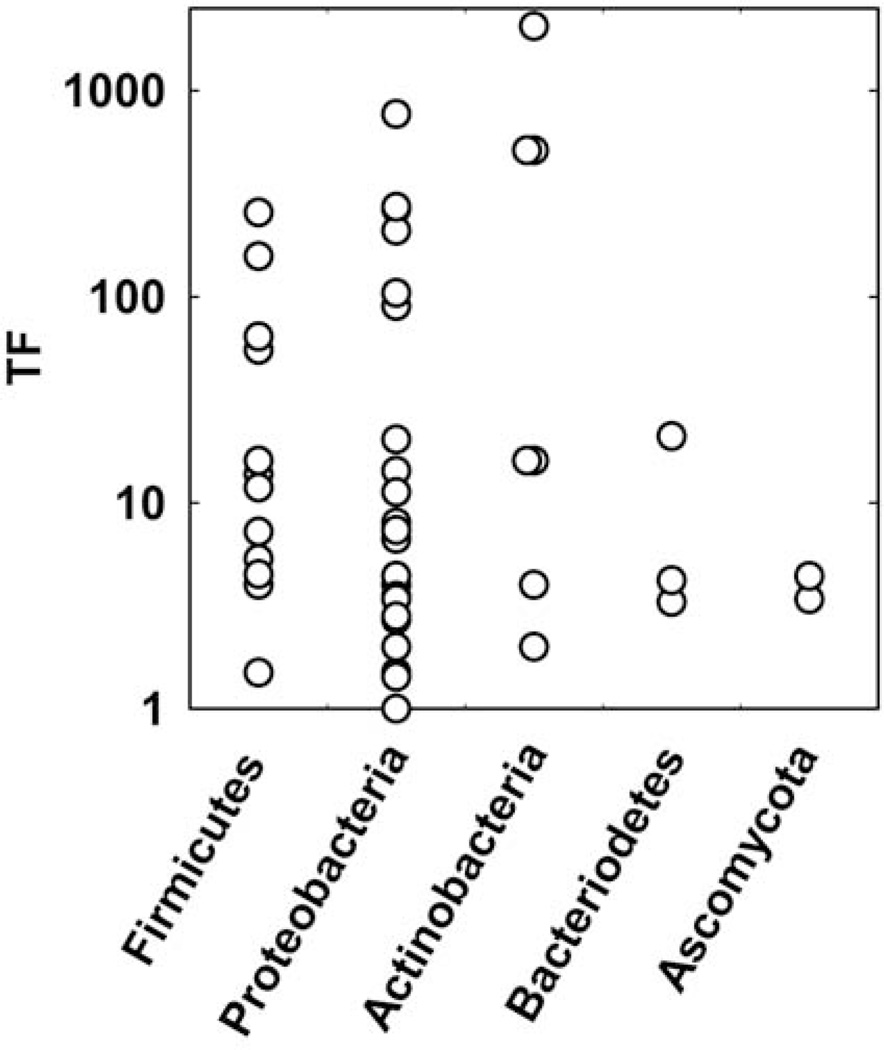
In this section I explore the role of the microbial composition of a biofilm on its antimicrobial tolerance. Tolerance factors, for both biocides and antibiotics, are grouped by phylum in Figure 8. There is no statistically significant difference between the mean values of TF for any of the phyla (p = 0.26 by analysis of variance). For the three phyla for which there are four or more data points (Firmicutes, Proteobacteria, Actinobacteria), TF ranges over at least two orders of magnitude. One thing these data suggest is that tolerance is not specific to any particular subgroup of microorganisms. Indeed, reduced biofilm susceptibility appears to be a broadly distributed capability across the microbial world.
FIGURE 8.
Tolerance factors for biocides and antibiotics for four bacterial phyla and a fungus. doi:10.1128/microbiolspec.MB-0010-2014.f8
Medium Composition
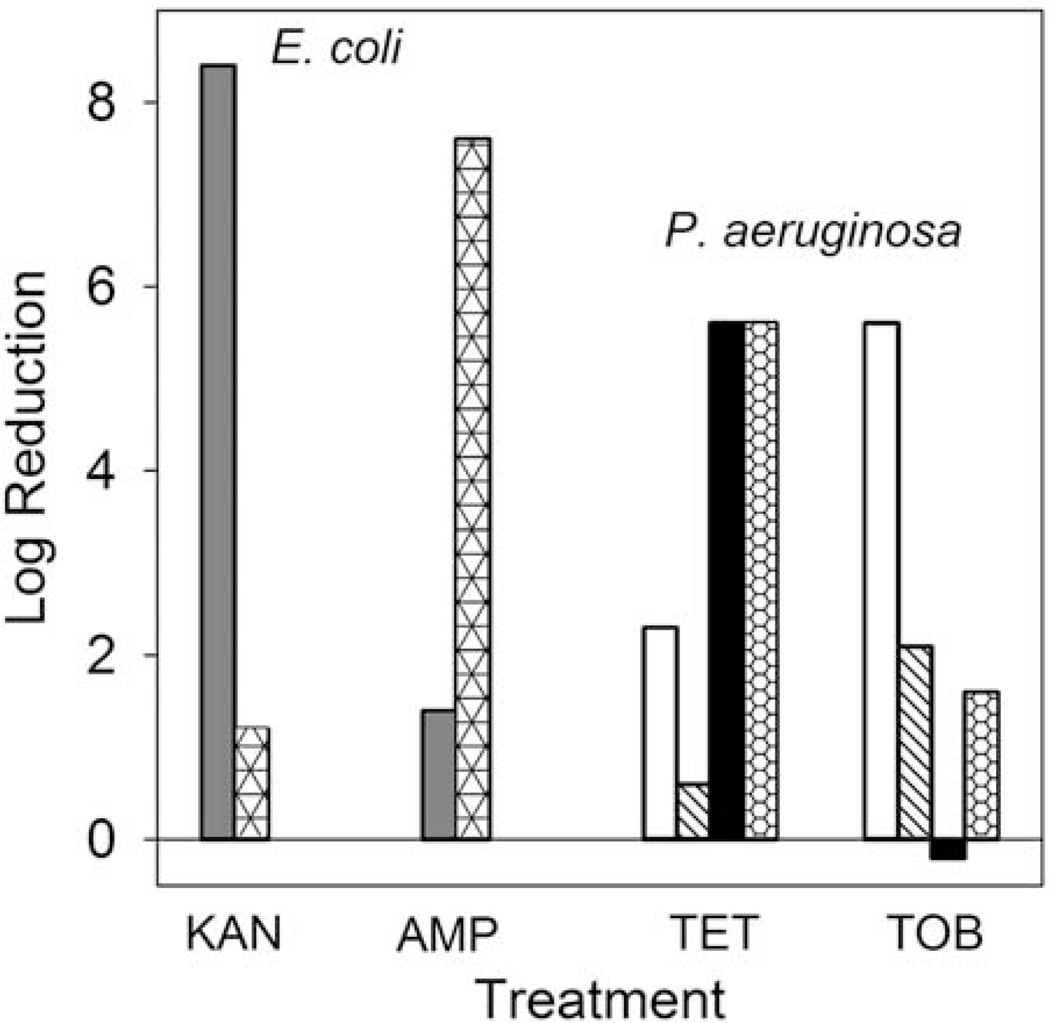
Antimicrobial susceptibility can be very sensitive to the composition of the medium used in the assay. I was not able to devise an informative way to test for effects of medium composition on TF values. To underscore the dramatic influence medium composition can play, Figure 9 presents some measurements made with young Escherichia coli or P. aeruginosa biofilms. At this early stage of development, antibiotics can be very effective against the bacteria under certain culture conditions. However, changes in the medium can drastically alter bacterial susceptibility. For example, 6-h-old E. coli biofilms are decimated by kanamycin when challenged on LB medium (8.4 log reduction) but scarcely affected when the medium is supplemented with glucose (1.2 log reduction). A similarly dramatic effect is seen for ampicillin treatment, except that it is exactly the reverse: on LB medium ampicillin is ineffective (1.4 log reduction), whereas the addition of glucose greatly enhances killing (7.6 log reduction). Analogous alterations in antibiotic susceptibility can be seen in 4-h-old P. aeruginosa biofilms exposed to tetracycline or tobramycin on different media (Fig. 9). For each agent there are conditions under which they are very effective and conditions under which they are ineffective. These conditions are not the same for the different antibiotics. These data lead to the hypothesis that medium composition influences microbial physiology, which in turn alters antimicrobial susceptibility.
FIGURE 9.
Medium effects on biofilm susceptibility to antibiotics. The different bar fills denote various media: LB (gray); LB + glucose (triangles); TSA, aerobic (white); TSA, anaerobic (hatched); noble agar, aerobic (black); noble agar, anaerobic (honeycomb). Sources: reference 52 for E. coli and unpublished data of Borriello and Stewart for P. aeruginosa. doi:10.1128/microbiolspec.MB-0010-2014.f9
Summary
What has been shown so far is that there is no discernable generalized role of antimicrobial size, antimicrobial chemistry, substratum material, or microbial species composition on the quantitative level of tolerance established during biofilm formation. Only areal cell density and biofilm age partially correlate with antimicrobial tolerance. This suggests that there is something that happens during biofilm maturation, either physical or physiological, that is essential for full biofilm tolerance. Case study results also point to an important role for medium composition, and hence physiology, in biofilm tolerance. Another way to say this is that the details of how the biofilm is grown for a particular test are likely to be more important than the choice of antimicrobial agent or microorganism.
MECHANISMS OF BIOFILM ANTIMICROBIAL TOLERANCE
Antimicrobial Depletion
One simple and possibly underappreciated mechanism of biofilm protection is depletion of the antimicrobial agent in the fluid bathing the biofilm. The antimicrobial could be depleted either by reaction in the fluid phase, by reaction with the biofilm or attachment substratum, or by sorption to constituents of the biofilm or substratum material. This mechanism is especially plausible in systems with a relatively high surface area to volume ratio, such as a 96-well microtiter plate. In this type of system, the demand exhibited by the biofilm could quickly reduce the dissolved concentration of antimicrobial.
The obvious way to control for antimicrobial depletion is to assay the bulk fluid during the course of treatment, or at least before and after the exposure period, to test whether the antimicrobial concentration is sustained. This is not typically done.
Since the surface area to volume ratio is a critical physical characteristic of a system, determining the potential for antimicrobial depletion, and since most of the data sets in Tables 1 and 2 include details permitting calculation of this ratio, a quantitative analysis can be conducted. When the tolerance factors in Table 1 are regressed against the surface area to volume ratio, no correlation is apparent (R2 = 0.022). Neither do the biofilm TFs for antibiotics in Table 2 correlate with the surface area to volume ratio of the biofilm test system (R2 = 0.010). What these analyses indicate is that antimicrobial depletion is probably not a general cause of biofilm tolerance in in vitro models.
Penetration
The extent of antimicrobial penetration into a biofilm is expected to depend on biofilm thickness, effective diffusivity of the agent in the biofilm, reactivity of the agent in the biofilm, the sorptive capacity of the biofilm for the agent, the dose concentration and dose duration, and external mass transfer properties (12). In other words, this is a complex interaction and problem. A good starting place is to examine actual measurements of antimicrobial penetration in biofilms.
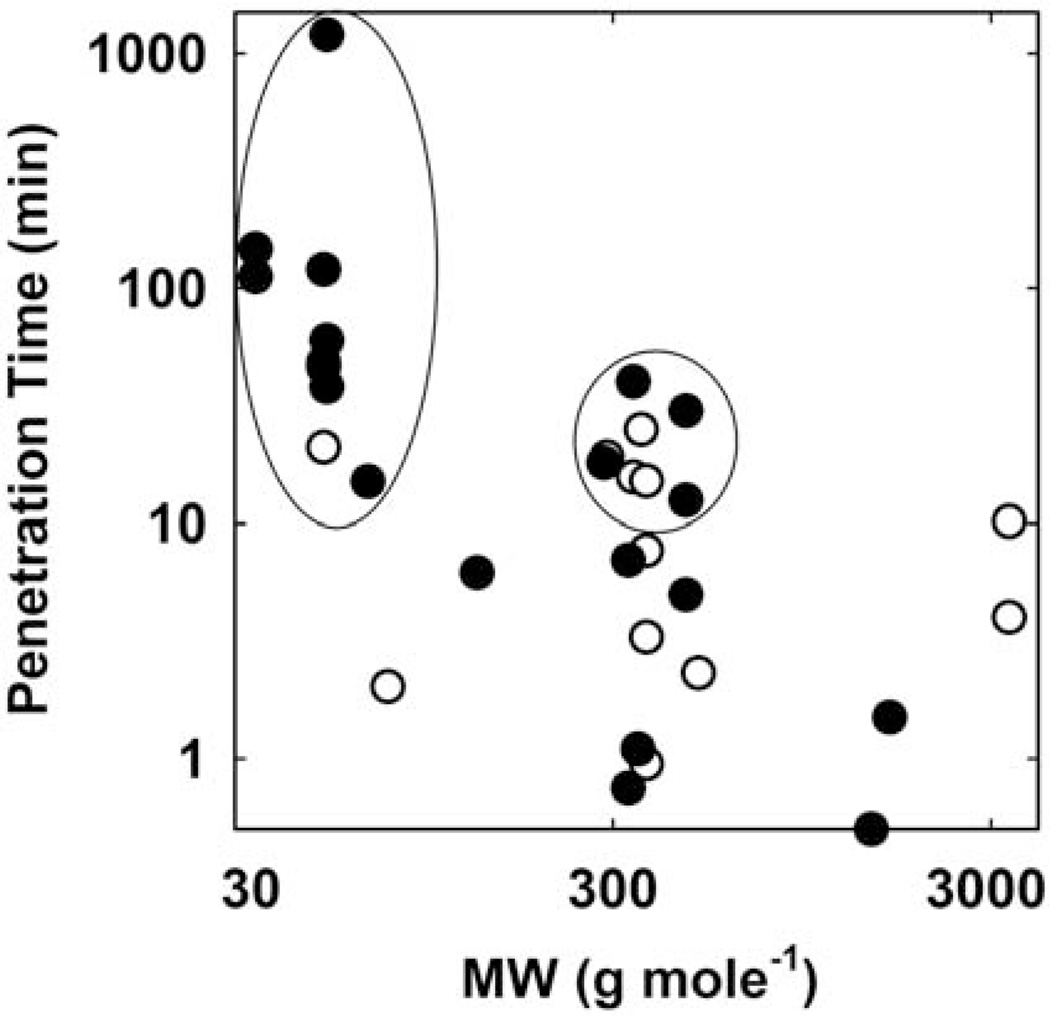
A survey of experimentally measured penetration times of antimicrobial agents in biofilms is presented in Figure 10. This data set excludes measurements made using diffusion chambers in which the biofilm is sandwiched between two compartments. These approaches can be useful for determining whether penetration occurs but are not appropriate for determining absolute penetration times, because the time constants are dependent on the device geometry. The measurements reported in Figure 10 were made using microelectrodes, time lapse microscopy of fluorescent-tagged drugs, total internal reflection spectroscopy, and time lapse microscopy of fluorescence loss from cells preloaded with a fluorophore.
FIGURE 10.
Experimentally measured antimicrobial penetration times in biofilms versus molecular weight of the antimicrobial. The penetration time was determined as the time to attain, at the base or center of the biofilm, 50% of the equilibrium concentration of the antimicrobial agent either through a direct measurement of the antimicrobial agent (solid circles) or by loss of membrane integrity detected with a fluorescent probe (open circles). Penetration times greater than 12 min are circled. Sources: references 15, 37, 53–63. doi:10.1128/microbiolspec.MB-0010-2014.f10
The penetration times in Figure 10 range from a fraction of a minute to almost a full day. It is tempting to judge some of these as fast and others as slow, but keep in mind that the important comparison to be made is between the dose duration and the penetration time. A penetration time of 30 min could be fast if the dose duration is 8 h and slow if the dose duration is 3 min.
Penetration times do not increase with the molecular weight of the antimicrobial as intuition might suggest. Indeed, one thing that can be inferred from Figure 10 is that even large antibiotics or antimicrobial peptides can penetrate a biofilm within a few minutes. Some examples of large agents that access the interior of a biofilm relatively quickly include vancomycin (0.5 min), daptomycin (1.5 min), and nisin (4 to 10 min).
There are two groups of agents, circled in Figure 10, with measured penetration times longer than 12 min. The antimicrobials in the first group (lower molecular weight) are all reactive oxidants: chlorine, chlorine dioxide, monochloramine, and hydrogen peroxide. The agents in the second group (higher molecular weight) are mostly cationic molecules including quaternary ammonium compounds, such as cetylpyridinium chloride and benzalkonium chloride, and an aminoglycoside antibiotic. The retarded penetration of these agents into the biofilm derives from the reaction or sorption of the agent in the biofilm as it diffuses. Halogens react with unchar-acterized components of biomass and are neutralized. Hydrogen peroxide is destroyed by the action of catalase. Agents with a positive charge likely bind to negatively charged polymers or to cell surfaces, delaying penetration. Retarded penetration due to reaction and sorption has been analyzed by mathematical models (12, 13).
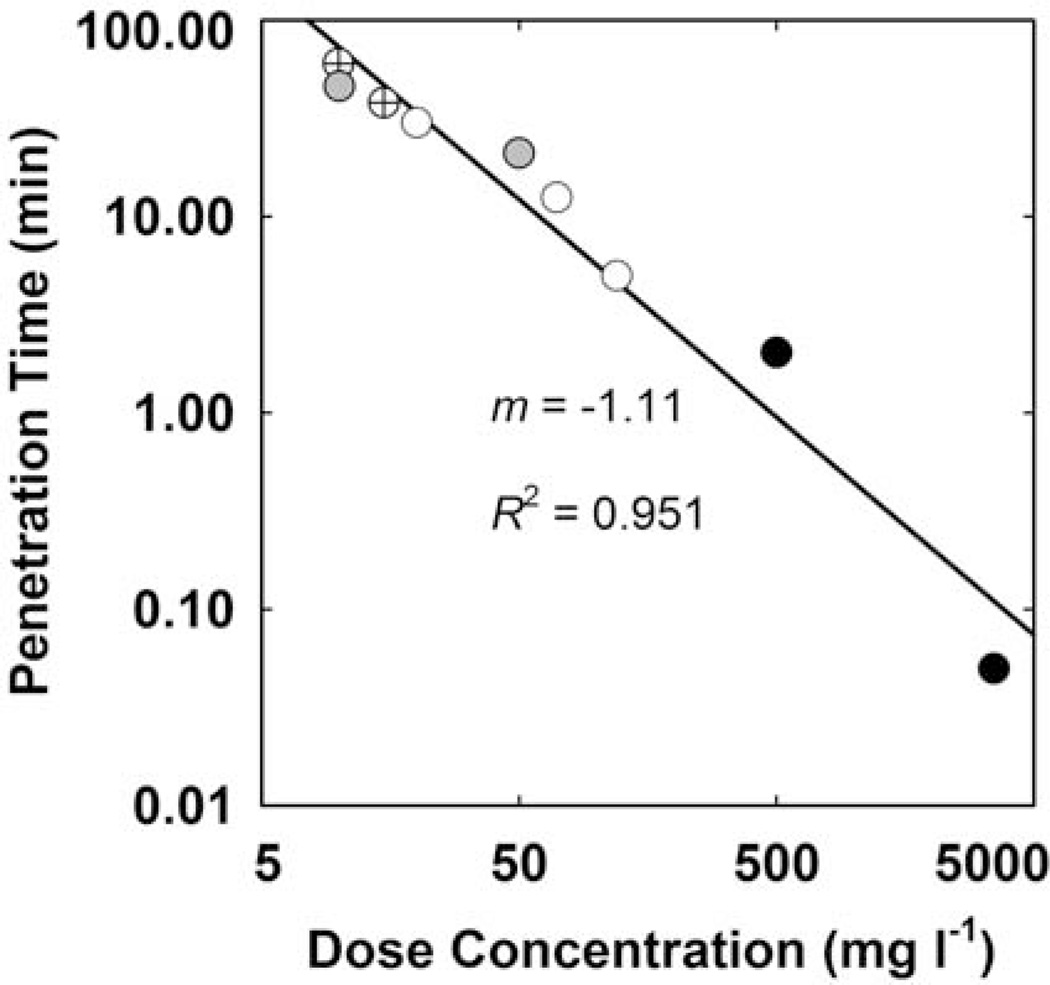
When considering agents that are subject to reaction or sorption in the biofilm, it is anticipated that the rate of penetration will depend on the applied concentration. This prediction is borne out by the subset of data plotted in Figure 11. This analysis shows that agents such as chlorine, peracetic acid, and tobramycin (all members of the circled groups in Fig. 10) penetrate a given biofilm faster as the applied concentration is increased. The slope of the regressed line in Figure 11 is close to −1. This tells us that penetration time for these agents is inversely proportional to dose concentration. For example, a dose concentration that is 10 times higher will result in a penetration time that is one 10th as long. This is not expected to be true of antimicrobials that do not react or sorb in the biofilm. The 50% penetration time for a noninteracting solute is predicted to be independent of the applied concentration.
FIGURE 11.
Experimentally measured antimicrobial penetration times in biofilms versus dose concentration. The line is the least squares regressed fit. Symbols indicate data for chlorine (cross, 55), chlorine (gray, 54), tobramycin (white, 62), peracetic acid (black, 53). doi:10.1128/microbiolspec.MB-0010-2014.f11
The preceding analysis and discussion is helpful for gaining insight into the fundamental phenomenon of antimicrobial penetration in a biofilm, but it does not tell us if retarded penetration actually limits antimicrobial efficacy in practice. The most likely situation for incomplete penetration to occur is when reactive oxidants are delivered at relatively low concentrations to thick bio-films for brief dose durations. Antibiotics likely penetrate biofilms in vivo because dose durations are relatively long. Another argument for penetration of antibiotics, including the sticky aminoglycosides, is that they result in log reductions in vivo that indicate access to most of the bacteria. For example, a classic clinical study of inhaled tobramycin in cystic fibrosis patients reported log reductions of P. aeruginosa in sputum of slightly greater than 2 after 2 weeks of therapy (14). This tells us that the drug reached 99% of the bacteria. Even in applications in which the dose duration is brief, for example, a mouth rinse treating dental plaque, penetration of the antimicrobial may not be limiting. Corbin (15) found no correlation between the clinical efficacy of mouth rinse active ingredients and their in vitro penetration time.
Physiology
Microorganisms in biofilms may be tolerant to antimicrobial agents because they enter less susceptible physiological states. For example, it is widely appreciated that microorganisms in the stationary phase of a batch planktonic culture, which may be slow-growing or non-growing and may be less metabolically active than growing cells, can be less sensitive to killing by antimicrobials. A few research studies have compared killing in exponential phase, stationary phase, and biofilms (Fig. 12). Though this analysis lacks sufficient data to make a strong conclusion, it suggests that whereas exponential phase planktonic cells are clearly less susceptible than biofilms cells, stationary phase planktonic cells are not consistently different from biofilm cells. The terminology of batch planktonic cultures is probably inadequate as a basis for characterizing the physiological heterogeneity within a biofilm.
FIGURE 12.
Comparison of antimicrobial susceptibility of exponential phase planktonic (solid symbols) or stationary phase planktonic (open symbols) to biofilm cells. The solid line is the line of equality. Points below the line indicate that biofilm cells were less susceptible than planktonic cells. Points above the line indicate that planktonic cells were less susceptible than biofilm cells. Sources: references 38, 64–66. doi:10.1128/microbiolspec.MB-0010-2014.f12
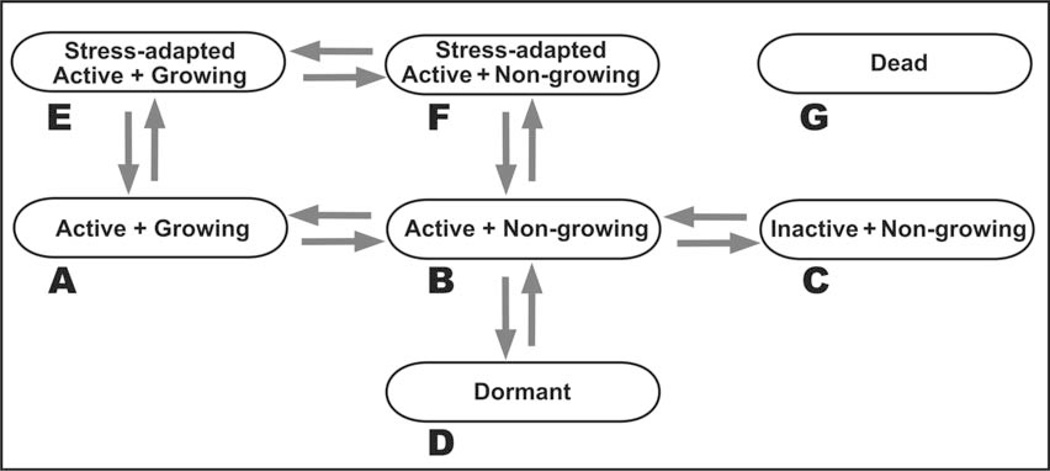
A wide variety of terms have been used to characterize the physiological state of a microbial cell: exponential phase, stationary phase, lag phase, nongrowing, stressed, adapted, inactive, viable but nonculturable, persister, dormant. Figure 13 presents a simplified categorization of physiological states based on discrimination of three features: (i) growth, (ii) metabolic and anabolic activity, and (iii) deployment of specific stress-adaptive responses. Though the schematic in Figure 13 presents these as discrete states, it may be more realistic to think of them as stations along continua. The susceptibility of a cell will depend on both the physiological state and the particular antimicrobial agent. Here are a few examples to illustrate the diversity of protected states.
FIGURE 13.
Conceptual diagram of distinct cell states important for antimicrobial sensitivity. The dead cell state can presumably be accessed from any of the other states. doi:10.1128/microbiolspec.MB-0010-2014.f13
In general, when biofilm microorganisms are compared to planktonic cells for antimicrobial susceptibility, the comparison is to a growing batch culture (Fig. 13A). These are cells that may be relatively sensitive to antimicrobial attack because their current environment is growth permissive and their current investment is in cell growth and replication rather than survival. Cells that transition to a nongrowing but still active state (Fig. 13B) may quickly acquire tolerance to some agents. In the conceptualization of Figure 13, this state is conceived of as cells with an active membrane potential and capacity for generation of some ATP along with sub-maximal capacity for transcription and translation. These cells do not exhibit DNA replication, cell wall synthesis, or balanced translation of all of the proteins required to make a new cell. In such a state, bacteria become insensitive to β-lactam antibiotics, which lyse cells by inhibiting cell wall synthesis as the cell continues to expand (16). Cells that transition to the inactive, nongrowing state (Fig. 13C) lack any catabolism or anabolism. Such a cell cannot maintain a membrane potential and thus may become insensitive to aminoglycoside antibiotics, which depend on active transport to reach their intracellular targets (17). The dormant state (Fig. 13D) is conceived of as distinct from the inactive, nongrowing state (Fig. 13C).
The dormant state is also metabolically inactive and nongrowing. To enter the dormant state, however, the cell has implemented protective modifications. Such modifications could include, hypothetically, alteration of membrane lipid and porin composition to reduce permeability, hibernation of ribosomes, inhibition of transcription and replication machinery, and deployment of enzymes that protect against oxidative stress without consuming ATP (e.g., catalase). In contrast, the nongrowing, inactive state (Fig. 13C) is an energetically disabled cell that has no other protective modifications. By way of an analogy, the state in Figure 13C could be compared to a car that has run out of gas by the side of the road and been abandoned, whereas a vehicle analogous to the cell state in Figure 13D, while also out of gas, has had the windows rolled up, the radiator drained, the battery disconnected, and a cover tied over it. Such a dormant cell state could confer tolerance to a wide variety of antimicrobial challenges. The much-discussed persister cell may represent such a dormant state (18, 19). Metabolically active bacteria are able to sense their environment and actively respond to the presence of an antimicrobial stress. In the schema of Figure 13, either growing cells (Fig. 13A) or nongrowing yet active cells (Fig. 13B) have the capacity to deploy active stress responses (resulting in the states shown in Figs. 13E and 13F, respectively). Examples of stress responses that have been demonstrated in bacterial bio-films include catalase induction upon treatment with hydrogen peroxide (20), β-lactamase induction upon treatment with imipenem (21), and induction of the lipopolysaccharide-modifying pmr operon upon treatment with colistin (22). In each of these examples, the induced gene or genes enhance the capacity of the bio-film to tolerate the antimicrobial either by augmenting destruction of the antimicrobial agent or by modifying the cell to make it less susceptible.
Because biofilms are known to contain niches of varying environmental chemistry and biological activity, it is important to recognize that a biofilm could harbor cells in more than one, possibly all, of the states shown in Figure 13 (23). This physiological heterogeneity or diversification is likely an important factor in the tolerance of the biofilm state. Note that none of these states is necessarily exclusively associated with either a planktonic or biofilm cell.
One difficulty with analyzing the physiological variety diagrammed in Figure 13 is a lack of standard quantitative measures of most of the physiological characteristics. There is an excellent quantitative parameter to characterize microbial growth: specific growth rate. Techniques to measure local growth rates within bio-films could offer insight into the spectrum of physiological states that influence antimicrobial susceptibility. In addition, it would be helpful to have quantitative measures of the overall cellular capacity for transcription or translation, the relative expression of adaptive stress responses, and some quantitative definition of dormancy.
The cell states diagrammed in Figure 13 are surely associated with the differential expression of specific sets of genes in a particular organism. One issue to keep in mind in interpreting the analysis of antimicrobial susceptibility of genetic mutants grown as biofilms is that a mutation that affects the areal cell density of the biofilm could indirectly alter its susceptibility. Indeed, this effect is to be expected, as discussed above and presented in Figures 3 to 5. Some of the systems that have been reported to contribute to biofilm antimicrobial tolerance include the stringent response (24), the SOS response (25), efflux pumps (26, 27), quorum sensing (28), toxin-antitoxin modules (29, 30), the elaboration of periplasmic or extracellular polysaccharides (31, 32, 33), and others (34–36). At this time it is still too early to be able to identify a consensus genetic basis for biofilm antimicrobial tolerance, but these details are certain to follow.
ACKNOWLEDGMENTS
Conflicts of interest: I declare no conflicts.
REFERENCES
- 1.Stewart PS, McFeters GA, Huang CT. Biofilm control by antimicrobial agents. In: Bryers JD, editor. Biofilms. 2nd ed. New York: John Wiley & Sons; 2000. pp. 373–405. [Google Scholar]
- 2.Mah TF, O’Toole GA. Mechanisms of biofilm resistance to antimicrobial agents. Trends Microbiol. 2001;9:34–39. doi: 10.1016/s0966-842x(00)01913-2. [DOI] [PubMed] [Google Scholar]
- 3.Stewart PS, Costerton JW. Antibiotic resistance of bacteria in biofilms. Lancet. 2001;358:135–138. doi: 10.1016/s0140-6736(01)05321-1. [DOI] [PubMed] [Google Scholar]
- 4.Lewis K. Riddle of biofilm resistance. Antimicrob Agents Chemother. 2001;45:999–1007. doi: 10.1128/AAC.45.4.999-1007.2001. [DOI] [PMC free article] [PubMed] [Google Scholar]
- 5.Davies D. Understanding biofilm resistance to antibacterial agents. Nat Rev Drug Dis. 2003;2:114–122. doi: 10.1038/nrd1008. [DOI] [PubMed] [Google Scholar]
- 6.Stewart PS, Mukherjee PK, Ghannoum MA. Biofilm antimicrobial resistance. In: Ghannoum M, GA O’Toole, editors. Microbial Biofilms. 1st ed. Washington, DC: ASM Press; 2004. pp. 250–268. [Google Scholar]
- 7.Bridier A, Briandet R, Thomas V, Dubois-Brissonnet F. Resistance of bacterial biofilms to disinfectants: a review. Biofouling. 2011;27:1017–1032. doi: 10.1080/08927014.2011.626899. [DOI] [PubMed] [Google Scholar]
- 8.Ronner AB, Wong AC. Biofilm development and sanitizer inactivation of Listeria monocytogenes and Salmonella typhimurium on stainless steel and Buna-n rubber. J Food Prot. 1993;56:750–758. doi: 10.4315/0362-028X-56.9.750. [DOI] [PubMed] [Google Scholar]
- 9.Chen CI, Griebe T, Srinivasan R, Stewart PS. Effects of various metal substrata on accumulation of Pseudomonas aeruginosa biofilms and efficacy of monochloramine as a biocide. Biofouling. 1993;7:421–251. [Google Scholar]
- 10.Anwar H, Strap JL, Costerton JW. Establishment of aging biofilms: possible mechanism of bacterial resistance to antimicrobial therapy. Antimicrob Agents Chemother. 1992;36:1347–1351. doi: 10.1128/aac.36.7.1347. [DOI] [PMC free article] [PubMed] [Google Scholar]
- 11.Wolcott RD, Rumbaugh KP, James G, Schultz G, Phillips P, Yang Q, Watters C, Stewart PS, Dowd SE. Biofilm maturity studies indicate sharp debridement opens a time-dependent therapeutic window. J Wound Care. 2010;19:320–328. doi: 10.12968/jowc.2010.19.8.77709. [DOI] [PubMed] [Google Scholar]
- 12.Stewart PS. Theoretical aspects of antibiotic diffusion into microbial biofilms. Antimicrob Agents Chemother. 1996;40:2517–2522. doi: 10.1128/aac.40.11.2517. [DOI] [PMC free article] [PubMed] [Google Scholar]
- 13.Stewart PS, Raquepas JB. Implications of reaction-diffusion theory for the disinfection of microbial biofilms by reactive antimicrobial agents. Chem Eng Sci. 1995;50:3099–3104. [Google Scholar]
- 14.Ramsey BW, Pepe MS, Quan JM, Otto KL, Montgomery AB, Williams-Warren J, Vasiljev-K M, Borowitz D, Bowman CM, Marshall BC, Marshall S, Smith AL. Intermittent administration of inhaled tobramycin in patients with cystic fibrosis. New Engl J Med. 1999;340:23–30. doi: 10.1056/NEJM199901073400104. [DOI] [PubMed] [Google Scholar]
- 15.Corbin A, Pitts B, Parker A, Stewart PS. Antimicrobial penetration and efficacy in an in vitro oral biofilm model. Antimicrob Agents Chemother. 2011;55:3338–3344. doi: 10.1128/AAC.00206-11. [DOI] [PMC free article] [PubMed] [Google Scholar]
- 16.Tuomanen E, Cozens R, Tosch W, Zak O, Tomasz A. The rate of killing of Escherichia coli by [beta]-lactam antibiotics is strictly proportional to the rate of bacterial growth. J Gen Microbiol. 1986;132:1297–1304. doi: 10.1099/00221287-132-5-1297. [DOI] [PubMed] [Google Scholar]
- 17.Taber HW, Mueller JP, Miller PF, Arrow AS. Bacterial uptake of aminoglycoside antibiotics. Microbiol Rev. 1987;51:439–457. doi: 10.1128/mr.51.4.439-457.1987. [DOI] [PMC free article] [PubMed] [Google Scholar]
- 18.Lewis K. Persister cells, dormancy and infectious disease. Nat Rev Microbiol. 2007;5:48–56. doi: 10.1038/nrmicro1557. [DOI] [PubMed] [Google Scholar]
- 19.Lewis K. Persister cells. Annu Rev Microbiol. 2010;64:357–372. doi: 10.1146/annurev.micro.112408.134306. [DOI] [PubMed] [Google Scholar]
- 20.Elkins JG, Hassett DJ, Stewart PS, Schweizer HP, McDermott TR. Pseudomonas aeruginosa biofilm resistance to hydrogen peroxide: protective role of catalase. Appl Environ Microbiol. 1999;65:4594–4600. doi: 10.1128/aem.65.10.4594-4600.1999. [DOI] [PMC free article] [PubMed] [Google Scholar]
- 21.Bagge N, Schuster M, Hentzer M, Ciofu O, Givskov M, Greenberg EP, Høiby N. Pseudomonas aeruginosa biofilms exposed to imipenem exhibit changes in global gene expression and beta-lactamase and alginate production. Antimicrob Agents Chemother. 2004;48:1175–1187. doi: 10.1128/AAC.48.4.1175-1187.2004. [DOI] [PMC free article] [PubMed] [Google Scholar]
- 22.Pamp SJ, Gjermansen M, Johansen HK, Tolker-Nielsen T. Tolerance to the antimicrobial peptide colistin in Pseudomonas aeruginosa biofilms is linked to metabolically active cells, and depends on the pmr and mexAB-oprM genes. Mol Microbiol. 2008;68:223–240. doi: 10.1111/j.1365-2958.2008.06152.x. [DOI] [PubMed] [Google Scholar]
- 23.Stewart PS, Franklin MJ. Physiological heterogeneity in biofilms. Nat Rev Microbiol. 2008;6:199–210. doi: 10.1038/nrmicro1838. [DOI] [PubMed] [Google Scholar]
- 24.Nguyen D, Joshi-Datar A, Lepine F, Bauerle E, Olakanmi O, Beer K, McKay G, Siehnel R, Schafhauser J, Wang Y, Britigan BE, Singh PK. Active starvation responses mediate antibiotic tolerance in biofilms and nutrient-limited bacteria. Science. 2011;334:982–986. doi: 10.1126/science.1211037. [DOI] [PMC free article] [PubMed] [Google Scholar]
- 25.Bernier SP, Lebeaux D, DeFrancesco AS, Valomon A, Soubigou G, Coppée JY, Ghigo JM, Beloin C. Starvation, together with the SOS response, mediates high biofilm-specific tolerance to the fluoroquinolone ofloxacin. PLoS Genet. 2013;9:e1003144. doi: 10.1371/journal.pgen.1003144. [DOI] [PMC free article] [PubMed] [Google Scholar]
- 26.Liao J, Schurr MJ, Sauer K. The MerR-like regulator BrlR confers biofilm tolerance by activating multidrug-efflux pumps in Pseudomonas aeruginosa biofilms. J Bacteriol. 2013;195:3352–3363. doi: 10.1128/JB.00318-13. [DOI] [PMC free article] [PubMed] [Google Scholar]
- 27.Zhang L, Mah TF. Involvement of a novel efflux system in biofilm-specific resistance to antibiotics. J Bacteriol. 2008;190:4447–4452. doi: 10.1128/JB.01655-07. [DOI] [PMC free article] [PubMed] [Google Scholar]
- 28.Bjarnsholt T, Jensen PØ, Burmølle M, Hentzer M, Haagensen JA, Hougen HP, Calum H, Madsen KG, Moser C, Molin S, Høiby N, Givskov M. Pseudomonas aeruginosa tolerance to tobramycin, hydrogen peroxide and polymorphonuclear leukocytes is quorum-sensing dependent. Microbiology. 2005;151:373–383. doi: 10.1099/mic.0.27463-0. [DOI] [PubMed] [Google Scholar]
- 29.Harrison JJ, Wade WD, Akierman S, Vacchi-Suzzi C, Stremick CA, Turner RJ, Ceri H. The chromosomal toxin gene yafQ is a determinant of multidrug tolerance for Escherichia coli growing as a biofilm. Antimicrob Agents Chemother. 2009;53:2253–2258. doi: 10.1128/AAC.00043-09. [DOI] [PMC free article] [PubMed] [Google Scholar]
- 30.Van Acker H, Sass A, Dhondt I, Nelis HJ, Coenye T. Involvement of toxin-antitoxin modules in Burkholderia cenocepacia biofilm persistence. Pathog Dis. 2014 doi: 10.1111/2049-632X.12177. [Epub ahead of print.] [DOI] [PubMed] [Google Scholar]
- 31.Mah TF, Pitts B, Pellock B, Walker GC, Stewart PS, O’Toole GA. A genetic basis for Pseudomonas aeruginosa biofilm antibiotic resistance. Nature. 2003;426:306–310. doi: 10.1038/nature02122. [DOI] [PubMed] [Google Scholar]
- 32.Colvin KM, Gordon VD, Murakami K, Borlee BR, Wozniak DJ, Wong GC, Parsek MR. The Pel polysaccharide can serve a structural and protective role in the biofilm matrix of Pseudomonas aeruginosa . PLoS Pathog. 2011;7:e10012164. doi: 10.1371/journal.ppat.1001264. [DOI] [PMC free article] [PubMed] [Google Scholar]
- 33.Billings N, Millan MR, Caldara M, Rusconi R, Tarasova Y, Stocker R, Ribbeck K. The extracellular matrix component Psl provides fast-acting antibiotic defense in Pseudomonas aeruginosa biofilms. PLoS Pathog. 2013;9:e1003526. doi: 10.1371/journal.ppat.1003526. [DOI] [PMC free article] [PubMed] [Google Scholar]
- 34.Lynch SV, Dixon L, Benoit MR, Brodie EL, Keyhan M, Hu P, Ackerley DF, Andersen GL, Matin A. Role of the rapA gene in controlling antibiotic resistance of Escherichia coli biofilms. Antimicrob Agents Chemother. 2007;51:3650–3658. doi: 10.1128/AAC.00601-07. [DOI] [PMC free article] [PubMed] [Google Scholar]
- 35.Zhang L, Hinz AJ, Nadeau JP, Mah TF. Pseudomonas aeruginosa tssC1 links type VI secretion and biofilm-specific antibiotic resistance. J Bacteriol. 2011;193:5510–5513. doi: 10.1128/JB.00268-11. [DOI] [PMC free article] [PubMed] [Google Scholar]
- 36.Zhang L, Chiang WC, Gao Q, Givskov M, Tolker-Nielsen T, Yang L, Zhang G. The catabolite repression control protein Crc plays a role in the development of antimicrobial-tolerant subpopulations in Pseudomonas aeruginosa biofilms. Microbiology. 2012;158:3014–3019. doi: 10.1099/mic.0.061192-0. [DOI] [PubMed] [Google Scholar]
- 37.Stewart PS, Rayner J, Roe F, Rees WM. Biofilm penetration and disinfection efficacy of alkaline hypochlorite and chlorosulfmates. J Appl Microbiol. 2001;91:525–532. doi: 10.1046/j.1365-2672.2001.01413.x. [DOI] [PubMed] [Google Scholar]
- 38.Luppens SB, Reij MW, van der Heijden RW, Rombouts FM, Abee T. Development of a standard test to assess the resistance of Staphylococcus aureus biofilm cells to disinfectants. Appl Environ Microbiol. 2002;68:4194–4200. doi: 10.1128/AEM.68.9.4194-4200.2002. [DOI] [PMC free article] [PubMed] [Google Scholar]
- 39.Buckingham-Meyer K, Goeres DM, Hamilton MA. Comparative evaluation of biofilm disinfectant efficacy tests. J Microbiol Methods. 2007;70:236–244. doi: 10.1016/j.mimet.2007.04.010. [DOI] [PubMed] [Google Scholar]
- 40.Byun MW, Kim JH, Kim DH, Kim HJ, Jo C. Effects of irradiation and sodium hypochlorite on the micro-organisms attached to a commercial food container. Food Microbiol. 2007;24:544–548. doi: 10.1016/j.fm.2006.08.005. [DOI] [PubMed] [Google Scholar]
- 41.Griebe T, Chen CI, Srinivasan R, Stewart PS. Analysis of biofilm disinfection by monochloramine and free chlorine. In: Geesey GG, Lewandowski Z, Flemming HC, editors. Biofouling and Biocorrosion in Industrial Water Systems. Boca Raton, FL: Lewis Publishers; 1993. pp. 151–161. [Google Scholar]
- 42.Norwood DE, Gilmour A. The growth and resistance to sodium hypochlorite of Listeria monocytogenes in a steady-state multispecies biofilm. J Appl Microbiol. 2000;88:512–520. doi: 10.1046/j.1365-2672.2000.00990.x. [DOI] [PubMed] [Google Scholar]
- 43.Oie S, Huang Y, Kamiya A, Konishi H, Nakazawa T. Efficacy of disinfectants against biofilm cells of methicillin-resistant Staphylococcus aureus . Microbios. 1996;85:223–230. [PubMed] [Google Scholar]
- 44.Kim J, Pitts B, Stewart PS, Camper A, Yoon J. Comparison of the antimicrobial effects of chlorine, silver ion, and tobramycin on biofilm. Antimicrob Agents Chemother. 2008;52:1446–1453. doi: 10.1128/AAC.00054-07. [DOI] [PMC free article] [PubMed] [Google Scholar]
- 45.Anwar H, van Biesen T, Dasgupta M, Costerton JW. Interaction of biofilm bacteria with antibiotics in a novel in vitro chemostat system. Antimicrob Agents Chemother. 1989;33:1824–1826. doi: 10.1128/aac.33.10.1824. [DOI] [PMC free article] [PubMed] [Google Scholar]
- 46.Jass J, Costerton JW, Lappin-Scott HM. The effect of electrical currents and tobramycin on Pseudomonas aeruginosa biofilms. J Indust Microbiol. 1995;15:234–242. doi: 10.1007/BF01569830. [DOI] [PubMed] [Google Scholar]
- 47.Borriello G, Werner EM, Roe F, Kim AM, Ehrlich GD, Stewart PS. Oxygen limitation contributes to antibiotic tolerance of Pseudomonas aeruginosa in biofilms. Antimicrob Agents Chemother. 2004;48:2659–2664. doi: 10.1128/AAC.48.7.2659-2664.2004. [DOI] [PMC free article] [PubMed] [Google Scholar]
- 48.Shapiro JA, Nguyen VL, Chamberlain NR. Evidence for persisters in Staphylococcus epidermidis RP62a planktonic cultures and biofilms. J Med Microbiol. 2011;60:950–960. doi: 10.1099/jmm.0.026013-0. [DOI] [PubMed] [Google Scholar]
- 49.Tré-Hardy M, Macé C, Manssouri NE, Vanderbist F, Traore H, Devleeschouwer MJ. Effect of antibiotic co-administration on young and mature biofilms of cystic fibrosis clinical isolates: the importance of the biofilm model. Int J Antimicrob Agents. 2009;33:40–45. doi: 10.1016/j.ijantimicag.2008.07.012. [DOI] [PubMed] [Google Scholar]
- 50.Singla S, Harjai K, Chhibber S. Susceptibility of different phases of biofilm of Klebsiella pneumoniae to three different antibiotics. J Antibiot. 2013;66:61–66. doi: 10.1038/ja.2012.101. [DOI] [PubMed] [Google Scholar]
- 51.Corcoran M, Morris D, De Lappe N, O’Connor J, Lalor P, Dockery P, Cormican M. Commonly used disinfectants fail to eradicate Salmonella enterica biofilms from food contact surface materials. Appl Environ Microbiol. 2014;80:1507–1514. doi: 10.1128/AEM.03109-13. [DOI] [PMC free article] [PubMed] [Google Scholar]
- 52.Zuroff TR, Bernstein H, Lloyd-Randolfi J, Jimenez-Taracido L, Stewart PS, Carlson RP. Robustness analysis of culturing perturbations on Escherichia coli colony biofilm beta-lactam and amino-glycoside antibiotic tolerance. BMC Microbiol. 2010;10:185. doi: 10.1186/1471-2180-10-185. [DOI] [PMC free article] [PubMed] [Google Scholar]
- 53.Bridier A, Dubois-Brissonnet F, Greub G, Thomas V, Briandet R. Dynamics of the action of biocides in Pseudomonas aeruginosa biofilms. Antimicrob Agents Chemother. 2011;55:2648–2654. doi: 10.1128/AAC.01760-10. [DOI] [PMC free article] [PubMed] [Google Scholar]
- 54.Davison WM, Pitts B, Stewart PS. Spatial and temporal patterns of biocide action against Staphylococcus epidermidis biofilms. Antimicrob Agents Chemother. 2010;54:2920–2927. doi: 10.1128/AAC.01734-09. [DOI] [PMC free article] [PubMed] [Google Scholar]
- 55.de Beer D, Srinivasan R, Stewart PS. Direct measurement of chlorine penetration into biofilms during disinfection. Appl Environ Microbiol. 1994;60:4339–4344. doi: 10.1128/aem.60.12.4339-4344.1994. [DOI] [PMC free article] [PubMed] [Google Scholar]
- 56.Jang A, Szabo J, Hosni AA, Coughlin M, Bishop PL. Measurement of chlorine dioxide penetration in dairy process pipe biofilms during disinfection. Appl Microbiol Biotechnol. 2006;72:368–376. doi: 10.1007/s00253-005-0274-5. [DOI] [PubMed] [Google Scholar]
- 57.Lee WH, Wahman DG, Bishop PL, Pressman JG. Free chlorine and monochloramine application to nitrifying biofilm: comparison of biofilm penetration, activity, and viability. Environ Sci Technol. 2011;45:1412–1419. doi: 10.1021/es1035305. [DOI] [PubMed] [Google Scholar]
- 58.Liu X, Roe F, Jesaitis A, Lewandowski Z. Resistance of bio-films to the catalase inhibitor 3-amino-1,2,4-triazole. Biotechnol Bioeng. 1998;59:156–162. [PubMed] [Google Scholar]
- 59.Dabbi-Oubekka S, Briandet R, Fontaine-Aupart MP, Steenkeste K. Correlative time-resolved fluorescence microscopy to assess antibiotic diffusion-reaction in biofilms. Antimicrob Agents Chemother. 2012;56:3349–3358. doi: 10.1128/AAC.00216-12. [DOI] [PMC free article] [PubMed] [Google Scholar]
- 60.Sandt C, Barbeau J, Gagnon MA, LaFleur M. Role of the ammonium group in the diffusion of quaternary ammonium compounds in Streptococcus mutans biofilms. J Antimicrob Chemother. 2007;60:1281–1287. doi: 10.1093/jac/dkm382. [DOI] [PubMed] [Google Scholar]
- 61.Stewart PS, Roe F, Rayner J, Elkins JG, Lewandowski Z, Ochsner UA, Hassett DJ. Effect of catalase on hydrogen peroxide penetration into Pseudomonas aeruginosa biofilms. Appl Environ Microbiol. 2000;66:836–838. doi: 10.1128/aem.66.2.836-838.2000. [DOI] [PMC free article] [PubMed] [Google Scholar]
- 62.Tseng BS, Zhang W, Harrison JJ, Quach TP, Song JL, Penterman J, Singh PK, Chopp DL, Packman AI, Parsek MR. The extracellular matrix protects Pseudomonas aeruginosa biofilms by limiting the penetration of tobramycin. Environ Microbiol. 2013;15:2865–2878. doi: 10.1111/1462-2920.12155. [DOI] [PMC free article] [PubMed] [Google Scholar]
- 63.Vrany JD, Stewart PS, Suci PA. Comparison of recalcitrance to ciprofloxacin and levofloxacin exhibited by Pseudomonas aeruginosa biofilms displaying rapid-transport characteristics. Antimicrob Agents Chemother. 1997;41:1352–1358. doi: 10.1128/aac.41.6.1352. [DOI] [PMC free article] [PubMed] [Google Scholar]
- 64.Anderl JN, Franklin MJ, Stewart PS. Role of antibiotic penetration limitation in Klebsiella pneumoniae biofilm resistance to ampicillin and ciprofloxacin. Antimicrob Agents Chemother. 2000;44:1818–1824. doi: 10.1128/aac.44.7.1818-1824.2000. [DOI] [PMC free article] [PubMed] [Google Scholar]
- 65.Liao J, Sauer K. The MerR-like transcriptional regulator BrlR contributes to Pseudomonas aeruginosa biofilm tolerance. J Bacteriol. 2012;194:4823–4836. doi: 10.1128/JB.00765-12. [DOI] [PMC free article] [PubMed] [Google Scholar]
- 66.Podos SD, Thanassi JA, Leggio M, Pucci MJ. Bactericidal activity of ACH-702 against nondividing and biofilm staphylococci. Antimicrob Agents Chemother. 2012;56:3812–3818. doi: 10.1128/AAC.00092-12. [DOI] [PMC free article] [PubMed] [Google Scholar]
- 67.Spoering AL, Lewis K. Biofilms and planktonic cells of Pseudomonas aeruginosa have similar resistance to killing by antimicrobials. J Bacteriol. 2001;183:6746–6751. doi: 10.1128/JB.183.23.6746-6751.2001. [DOI] [PMC free article] [PubMed] [Google Scholar]
- 68.Thrower Y, Pinney RJ, Wilson M. Susceptibilities of Actinobacillus actinomycetemcomitans biofilms to oral antiseptics. J Med Microbiol. 1997;46:425–429. doi: 10.1099/00222615-46-5-425. [DOI] [PubMed] [Google Scholar]
- 69.Green PN, Pirrie RS. A laboratory apparatus for the generation and biocide efficacy testing of Legionella biofilms. J Appl Bacteriol. 1993;74:388–393. doi: 10.1111/j.1365-2672.1993.tb05143.x. [DOI] [PubMed] [Google Scholar]
- 70.Wood P, Jones M, Bhakoo M, Gilbert P. A novel strategy for control of microbial biofilms through generation of biocide at the biofilm-surface interface. Appl Environ Microbiol. 1996;62:2598–2602. doi: 10.1128/aem.62.7.2598-2602.1996. [DOI] [PMC free article] [PubMed] [Google Scholar]
- 71.Walker JT, Morales M. Evaluation of chlorine dioxide (ClO2) for the control of biofilms. Wat Sci Technol. 1997;35:319–323. [Google Scholar]
- 72.Goeres DM, Loetterle LR, Hamilton MA. A laboratory hot tub model of disinfectant efficacy evaluation. J Microbiol Meth. 2007;68:184–192. doi: 10.1016/j.mimet.2006.07.010. [DOI] [PubMed] [Google Scholar]
- 73.Tabak M, Scher K, Hartog E, Römling U, Matthews KR, Chikindas ML, Yaron S. Effect of triclosan on Salmonella typhimurium at different growth stages and in biofilms. FEMS Microbiol Lett. 2007;267:200–206. doi: 10.1111/j.1574-6968.2006.00547.x. [DOI] [PubMed] [Google Scholar]
- 74.Stickler D, Hewett P. Activity of antiseptics against biofilms of mixed bacterial species growing on silicone surfaces. Eur J Clin Microbiol Infect Dis. 1991;10:416–421. doi: 10.1007/BF01968021. [DOI] [PubMed] [Google Scholar]
- 75.Neyret C, Herry JM, Meylheuc T, Dubois-Brissonnet F. Plant-derived compounds as natural antimicrobials to control paper mill biofilms. J Ind Microbiol Biotechnol. 2014;41:87–96. doi: 10.1007/s10295-013-1365-4. [DOI] [PubMed] [Google Scholar]
- 76.Blanc V, Isabal S, Sánchez MC, Llama-Palacios A, Herrera D, Sanz M, León R. Characterization and application of a flow system for in vitro multispecies oral biofilm formation. J Periodont Res. 2013 doi: 10.1111/jre.12110. [Epub ahead of print.] [DOI] [PubMed] [Google Scholar]
- 77.Tafin UF, Corvec S, Betrisey B, Zimmerli W, Trampuz A. Role of rifampin against Propionibacterium acnes biofilm in vitro and in an experimental foreign-body infection model. Antimicrob Agents Chemother. 2012;56:1885–1891. doi: 10.1128/AAC.05552-11. [DOI] [PMC free article] [PubMed] [Google Scholar]
- 78.Soriano F, Huelves L, Naves P, Rodriguez-Cerrato V, del Prado G, Ruiz V, Ponte C. In vitro activity of ciprofloxacin, moxifloxacin, vancomycin, and erythromycin against planktonic and biofilm forms of Corynebacterium urealyticum . J Antimicrob Chemother. 2009;63:353–356. doi: 10.1093/jac/dkn491. [DOI] [PubMed] [Google Scholar]
- 79.Khan W, Bernier SP, Kuchma SL, Hammond JH, Hasan F, O’Toole GA. Aminoglycoside resistance of Pseudomonas aeruginosa bio-films modulated by extracellular polysaccharide. Int Microbiol. 2010;13:207–212. doi: 10.2436/20.1501.01.127. [DOI] [PMC free article] [PubMed] [Google Scholar]
- 80.Folsom JP, Richards L, Pitts B, Roe F, Ehrlich GD, Parker A, Mazurie A, Stewart PS. Physiology of Pseudomonas aeruginosa in biofilms as revealed by transcriptome analysis. BMC Microbiol. 2010;10:294. doi: 10.1186/1471-2180-10-294. [DOI] [PMC free article] [PubMed] [Google Scholar]
- 81.Zheng Z, Stewart PS. Growth limitation of Staphylococcus epidermidis in biofilms contributes to rifampin tolerance. Biofilms. 2004;1:31–35. [Google Scholar]
- 82.Walters MC, Roe F, Bugnicourt A, Franklin MJ, Stewart PS. Contributions of antibiotic penetration, oxygen limitation, and low metabolic activity to tolerance of Pseudomonas aeruginosa biofilms to cipro-floxacin and tobramycin. Antimicrob Agents Chemother. 2003;47:317–323. doi: 10.1128/AAC.47.1.317-323.2003. [DOI] [PMC free article] [PubMed] [Google Scholar]
- 83.Okuda K, Zendo T, Sugimoto S, Iwase T, Tajima A, Yamada S, Sonomoto K, Mizunoe Y. Effects of bacteriocins on methicillin-resistant Staphylococcus aureus biofilm. Antimicrob Agents Chemother. 2013;57:5572–5579. doi: 10.1128/AAC.00888-13. [DOI] [PMC free article] [PubMed] [Google Scholar]
- 84.Larsen T. Susceptibility of Porphyromonas gingivalis in biofilms to amoxicillin, doxycycline and metronidazole. Oral Microbiol Immunol. 2014;17:267–271. doi: 10.1034/j.1399-302x.2002.170501.x. [DOI] [PubMed] [Google Scholar]
- 85.Frank KL, Reichert EJ, Piper KE, Patel R. In vitro effects of antimicrobial agents on planktonic and biofilm forms of Staphylococcus lugdunensis clinical isolates. Antimicrob Agents Chemother. 2007;51:888–895. doi: 10.1128/AAC.01052-06. [DOI] [PMC free article] [PubMed] [Google Scholar]
- 86.Al-Dhaheri RS, Douglas LJ. Absence of amphotericin B-tolerant persister cells in biofilms of some Candida species. Antimicrob Agents Chemother. 2008;52:1884–1887. doi: 10.1128/AAC.01473-07. [DOI] [PMC free article] [PubMed] [Google Scholar]
- 87.Hawser SP, Douglas LJ. Resistance of Candida albicans biofilms to antifungal agents in vitro . Antimicrob Agents Chemother. 1995;39:2128–2131. doi: 10.1128/aac.39.9.2128. [DOI] [PMC free article] [PubMed] [Google Scholar]


