

Abstract

Intermolecular ion pairs (salt bridges) are crucial for protein–DNA association. For two protein–DNA complexes, we demonstrate that the ion pairs of protein side-chain NH3+ and DNA phosphate groups undergo dynamic transitions between distinct states in which the charged moieties are either in direct contact or separated by water. While the crystal structures of the complexes show only the solvent-separated ion pair (SIP) state for some interfacial lysine side chains, our NMR hydrogen-bond scalar coupling data clearly indicate the presence of the contact ion pair (CIP) state for the same residues. The 0.6-μs molecular dynamics (MD) simulations confirm dynamic transitions between the CIP and SIP states. This behavior is consistent with our NMR order parameters and scalar coupling data for the lysine side chains. Using the MD trajectories, we also analyze the free energies of the CIP–SIP equilibria. This work illustrates the dynamic nature of short-range electrostatic interactions in DNA recognition by proteins.
Ion pairs (also known as salt bridges) of electrostatically interacting cationic and anionic moieties are important for many proteins and nucleic acids to perform their function. Despite their importance, ion pairs of biological macromolecules are not well understood in terms of dynamics. The vast majority of experiment-based knowledge on the dynamic properties of ion pairs is limited to those for small compounds. One can distinguish two major states of the ion pairs, which are typically minima in the potentials of mean force: the contact ion-pair (CIP) state, in which a cation and an anion are in direct contact; and the solvent-separated ion-pair (SIP) state, in which one or more solvent molecules intervene between the electrostatically interacting cation and anion.1−3 For small molecule compounds, kinetics and thermodynamics of the CIP and SIP states have been experimentally studied by time-resolved absorption spectroscopy since the 1980s.4−7 By contrast, despite the wealth of solution NMR methods for investigating protein dynamics,8−12 experimental studies on the dynamic properties of ion pairs in biological macromolecules remain very rare.
Recently, several groups, including some of us, developed NMR methods for investigating dynamics of charged moieties of protein side chains.13−18 In particular, lysine (Lys) NH3+ groups have proven to be extremely useful probes for NMR studies of protein side-chain dynamics involving hydrogen bonds and ion pairs.16−21 Owing to very slow relaxation of in-phase single-quantum 15N coherence of NH3+ groups, extensive characterizations are feasible for Lys side chains forming hydrogen bonds and ion pairs. For example, a recent study on the HoxD9-DNA complex showed that the Lys NH3+ groups forming intermolecular ion pairs with DNA are highly mobile despite the presence of short-range electrostatic interactions and hydrogen bonds.18 However, the origin of this high mobility was unclear with the NMR methodology alone, largely because structural and energetic details were not available for this system.
In our current study, we resolve this problem and delineate the ion-pair dynamics by integrating NMR spectroscopy and molecular dynamics (MD) simulations for structurally well-characterized DNA complexes of the fruit fly Antennapedia (Antp) homeodomain and human Egr-1 (also known as Zif268) zinc-finger proteins. These proteins, representing two major classes of eukaryotic transcription factors, are well characterized by biophysical means.22−26 The crystal structures of the specific DNA complexes of the Antp homeodomain and Egr-1 zinc-finger proteins are available at 2.5 and 1.6 Å resolutions,22,24 respectively, and provide structural details around the ion pairs. For these systems, we investigated the dynamics of the short-range electrostatic interactions involving Lys side chains that are important for molecular association of protein and DNA.
By NMR spectroscopy, we characterized the Lys side chains forming the intermolecular ion pairs with DNA in these complexes at pH 5.8. In the Lys-selective 1H–15N HISQC spectra19 (Figure 1A), the Antp homeodomain–DNA and Egr-1–DNA complexes exhibited 1H–15N correlation signals from four and six Lys side-chain amino groups, respectively, under the experimental conditions used. 15Nζ chemical shifts27,28 as well as multiplet structures due to 1JNH coupling in F1–1H-coupled HSQC spectra19 clearly indicated that these Lys side-chain amino groups were predominantly in the form of NH3+ rather than NH2, as shown in the Supporting Information (SI). Two noninterfacial Lys side-chain amino groups in the Antp complex did not show corresponding signals, presumably due to rapid hydrogen exchange. We assigned the observed NMR signals from the NH3+ groups by Lys-selective triple-resonance experiments as previously described.29,30
Figure 1.
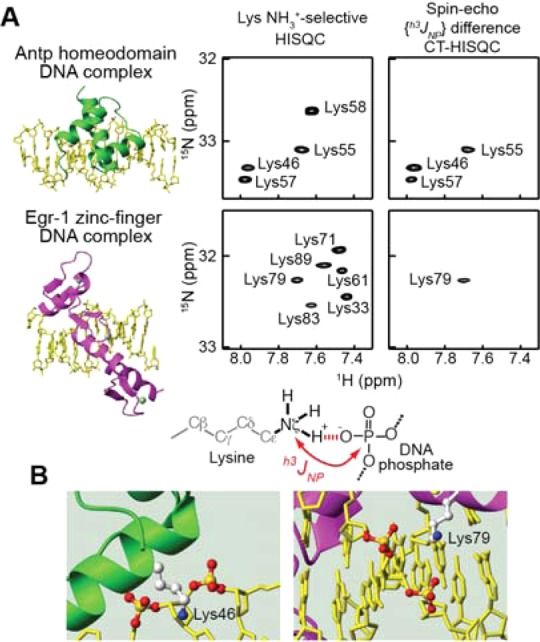
Discrepancy between NMR and crystallographic data with regard to the intermolecular ion pairs. (A) NMR evidence for the CIP states for Antp homeodomain Lys46, Lys55, and Lys57 and Egr-1 zinc-finger Lys79. The spin–echo h3JNP modulation difference constant-time HISQC spectra 18 show signals only from NH3+ groups that exhibit hydrogen-bond scalar coupling between Lys 15Nζ and DNA 31P nuclei across CIP. (B) Crystal structures showing only SIP states for Lys46 in the Antp-DNA complex (PDB 9ANT)24 and Lys79 in the Egr-1-DNA complex (1AAY).22 The distances from the Nζ atoms (blue) to the closest DNA phosphate oxygen atoms are 4.7 Å for Lys46 and 4.2 Å for Lys79.
To detect the CIP states, we measured the hydrogen-bond scalar coupling h3JNP between Lys side-chain 15N and DNA phosphate 31P nuclei, as previously described.18 Only CIP states involving a direct hydrogen bond can exhibit a sizable h3JNP coupling, whereas SIP states cannot. The NH3+ groups of Antp homeodomain Lys46, Lys55, and Lys57 and Egr-1 zinc-finger Lys79 exhibited sizable h3JNP coupling (Figure 1A; see also Table S1 in the SI). All of them are located at the protein–DNA interfaces in the crystal structures. For Lys55 and Lys57 of the Antp homeodomain–DNA complex, the sizable h3JNP couplings are consistent with the CIP states seen in the crystal structure. For the Antp homeodomain Lys46 and the Egr-1 zinc-finger Lys79, however, we found an intriguing difference between the crystallographic data and our NMR data. Although the crystal structures show only SIP states for these side chains (Figure 1B), our h3JNP data clearly indicate a major presence of the CIP states for their NH3+ groups. Given this discrepancy, it is important to study the dynamic behavior of the intermolecular ion pairs.
To gain insight into the above-mentioned discrepancy, we performed 0.6 μs MD simulations for the Antp homeodomain–DNA and Egr-1 zinc-finger–DNA complexes solvated with TIP3P water molecules using the NAMD 2.9 software31 together with CHARMM31 force field parameters.32−34 The protonation states of titratable residues were assigned according to their standard states at pH 7.0. This seems to be valid for the interfacial Lys side chains as well because Poisson–Boltzmann equations-based calculations with the APBS program35 for the crystal structures suggest that the interactions with DNA can lower their pKa from the standard value (10.4) by no more than 1.7. We monitored the contacts between each Lys side chain group and any DNA phosphate group in the MD trajectories (Figure 2). For all the Lys NH3+ groups that can directly contact DNA phosphate group, the N···O distances dynamically fluctuated between two ranges: one between 2.5–3.2 Å, corresponding to the CIP states, the other between 3.8–6.0 Å, corresponding to the SIP states. The transitions between the CIP and SIP states occurred typically on a pico- to nanosecond time scale. These dynamic transitions in the MD simulations between the CIP and SIP equilibrium states give an interpretation of the above-mentioned discrepancy between the crystallographic and NMR data. This also resolves the issue of why some protein–DNA crystal structures show intervening water while others do not for similar systems. Consideration of any single structure is obviously inadequate to describe transitions between the CIP and SIP states.
Figure 2.
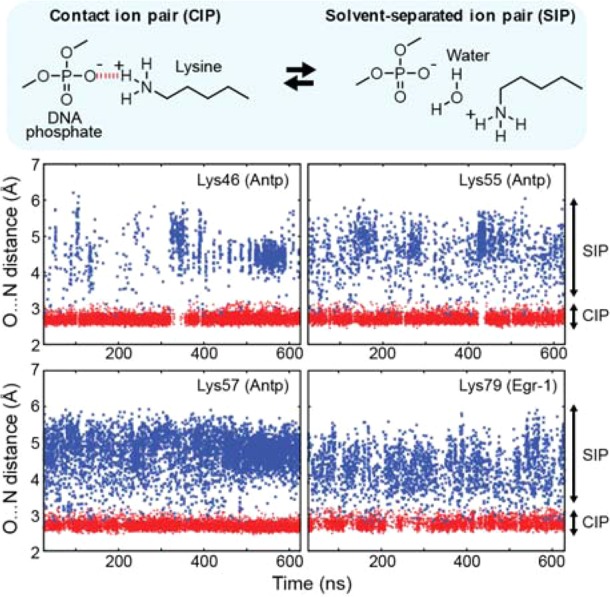
Dynamic transitions between the CIP (red) and SIP (blue) states of the intermolecular ion pairs of Lys side-chain NH3+ and DNA phosphate groups observed in the 0.6-μs MD simulations for the Antp–DNA and Egr-1–DNA complexes. Trajectories of distances from Lys Nζ atoms to the closest DNA phosphate oxygen atoms (Ophosphate) are shown for the intermolecular ion pairs for which the presence of CIP was experimentally confirmed (see Figure 1A). In these plots, a CIP is defined as a state with the Ophosphate···Nζ distance < 2.8 Å or with a hydrogen bond being formed between Ophosphate and Nζ atoms. The geometric criteria for the hydrogen bond were (1) the Ophosphate···Hζ distance < 2.3 Å; (2) the Ophosphate···Nζ distance < 3.2 Å; and (3) the Ophosphate···Hζ–Nζ angle being between 130° and 180°.
Given these computational results, we compared observables that can be assessed both computationally by MD and experimentally by NMR. One of them was the three-bond scalar coupling between 15Nζ and 13Cγ nuclei (3JNζCγ) related to the Lys χ4 torsion angle. Because the 15Nζ atoms are within the Lys NH3+ cations, this observation is directly relevant to the dynamics of the intermolecular ion pairs. As described,17 we measured 3JNζCγ coupling constants for Lys side chains in these complexes (Table S1 in the SI). Figure 3A shows comparisons of the experimental and computed 3JNζCγ. Two correlation plots are displayed. One plot compares the experimental data with the ensemble averages of 3JNζCγ coupling constants, ⟨3JNζCγ⟩, calculated from the MD configurational ensemble, whereas the other plot compares to those calculated from single crystal structures. For each structure, a 3JNζCγ constant was calculated from a χ4 angle using the Karplus equation36 together with the empirical coefficients for Lys side chains.37 The MD ensemble ⟨3JNζCγ⟩ shows excellent agreement with the experimental data, for which the root-mean-square deviation (rmsd) was 0.22 Hz. By contrast, the 3JNζCγ constants calculated from the single crystal structures exhibited bimodal distributions with two clusters corresponding to trans and gauche χ4 conformers and show poor agreement with the experimental NMR data (rmsd, 0.93 Hz). This remarkable difference between these plots is due to the presence of various different torsion angles sampled in the MD trajectories.
Figure 3.
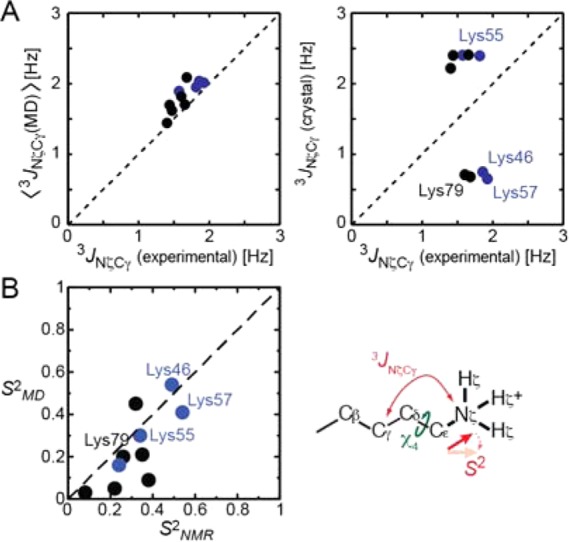
NMR data indicating that the intermolecular ion pairs are as dynamic as seen in the MD simulations. Blue and black circles show the data points for Lys side chains of the Antp-DNA and Egr-1-DNA complexes, respectively. (A) Comparison of experimental 3JNζCγ coupling data to ensemble averages for the MD trajectory (left). Corresponding comparison to those calculated from single crystal structures is also shown. (B) Comparison of NMR-derived (S2NMR) and MD-derived (S2MD) order parameters for Lys Cε–Nζ bonds. Data points for the Lys side chains involved in the intermolecular ion pairs are annotated.
The other observables we used to validate the dynamics of the intermolecular ion pairs were the order parameters, S2, for the Lys Cε-Nζ bonds. As previously described,16 we measured 15N relaxation parameters for Lys NH3+ groups at the 1H-frequencies of 800 and 600 MHz (Table S2 in the SI) and determined the order parameters S2 for the two protein–DNA complexes (Table S3 in the SI). The order parameters were also calculated using autocorrelation functions for the internal motions of the Cε–Nζ bonds from the MD trajectories (Figure S2 and Table S4 in the SI). Figure 3B shows comparison of these computational and experimental S2 data. Both the MD-derived and NMR-derived S2 data show values less than 0.6, indicating the highly dynamic nature of the Lys NH3+ groups, even for those in intermolecular ion pairs. The correlation coefficient was 0.75 between the computational and experimental S2 data for the Lys NH3+ groups. The MD-derived S2 parameters tended to be smaller than NMR-derived S2 parameters. The same tendency for other bond vectors has been noted and discussed by other groups.38,39 Nevertheless, the NMR 3JNζCγ and S2 data for the Lys NH3+ groups collectively indicate that the intermolecular ion pairs are indeed essentially as dynamic as seen in the MD simulations.
Encouraged by the consistency between NMR and simulation, we extended our analysis of the MD trajectories to argue the energetics of the CIP and SIP states. Figure 4 shows the probability distribution and free energy profile of the contact distances from the Lys Nζ atoms to the DNA phosphate groups. Two major peaks corresponding to the CIP and SIP states are clearly identified in these probability distributions (Figure 4A). The presence of an intervening energy barrier is identified in a range between 3.2–3.8 Å (Figure 4B). For the intermolecular ion pairs whose CIP states were experimentally detected, the free energy differences, ΔGo(CIP → SIP), were determined to be 0.8–1.6 kcal/mol at standard temperature, and the energy barriers, ΔG‡(CIP → SIP), for escape from the CIP state were determined to be 2.2–3.2 kcal/mol, which are qualitatively consistent with the mean lifetimes of the CIP states (Table S4 in the SI). Variation in the energetics among different residues is most likely related to the difference in local environments. The discrepancy between the X-ray and NMR data (Figure 1) might be caused by perturbation in CIP–SIP equilibria due to the presence of crystal packing force, precipitants, and other differences between the crystalline and solution conditions. Computation of the potential of mean force (PMF) should depend on force-field parameters used. For alkali-halide ion pairs, Dill and co-workers found that simulations using some different sets of force-field parameters gave the same overall trends in PMFs, but with moderate variations (± ∼0.5 kcal/mol) in calculated free energies of the CIP and SIP states.40 Charge transfer,41,42 which is not taken into account in the simulations, might also impact the CIP–SIP equilibria in the simulations. Nonetheless, it is worth mentioning that the free energies for the intermolecular ion pairs in the protein–DNA complexes are similar to previous experimental data for monovalent ion pairs of some small organic compounds [ΔGo(CIP → SIP) ≈ 1–2 kcal/mol]5−7 and computed PMF between free Lys+–Glu– pairs in water [ΔGo(CIP → SIP) ≈ 0.7–1.6 kcal/mol; ΔG‡(CIP → SIP) ≈ 0.8–3.4 kcal/mol].43
Figure 4.
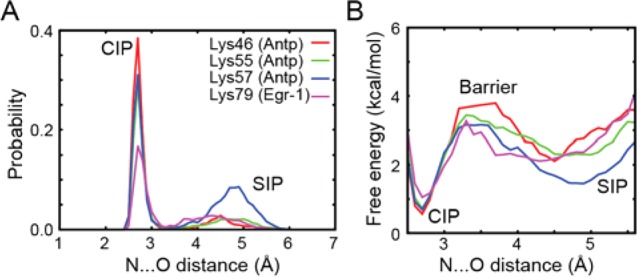
Energetics of the CIP–SIP equilibria for the ion pairs of the Lys NH3+ and DNA phosphate groups analyzed using the 0.6 μs MD simulations for the Antp–DNA and Egr-1–DNA complexes. (A) Probability distribution of the CIP and SIP states as a function of the distance from the Lys Nζ atom to the closest DNA phosphate oxygen atom. (B) Interionic potentials of mean force for the intermolecular ion pairs. Vertical relative normalization is arbitrary between curves.
In conclusion, our current study combining the experimental and computational approaches illustrates the dynamic equilibria of short-range electrostatic interactions at protein–DNA interfaces. Although crystal structures typically show either CIP or SIP state for each ion pair, our data show that the intermolecular ion pairs in the protein–DNA complexes undergo the dynamic transitions between the CIP and SIP states on a pico- to nanosecond time scale, which allows facile sampling of recognition events. Rapid breakage of CIPs might facilitate the proteins to slide on nonspecific DNA and to locate the target sites. The dynamic behavior of electrostatically interacting cationic and anionic moieties at molecular interfaces might facilitate molecular recognition and catalysis by proteins.
Experimental Methods
The Egr-1 zinc-finger and Antp homeodomain proteins were expressed in Escherichia coli, and purified by cation-exchange, and size-exclusion chromatographic methods. DNA was chemically synthesized and purified by anion-exchange chromatography. NMR experiments for the protein–DNA complexes were performed using Bruker Avance III spectrometers operated at the 1H frequencies of 800, 750, and 600 MHz. Other experimental and computational details are given in the Supporting Information.
Acknowledgments
This work was supported partly by the grants R01GM105931 (to J.I.), R01GM107590 (to J.I.), and R01GM037657 (to B.M.P.) from the National Institutes of Health and by the grant H-0037 (to B.M.P.) from the R.A. Welch Foundation. A portion of the computational research was carried out through NSF Xsede via the Texas Advanced Computing Center (TACC) at The University of Texas at Austin.
Supporting Information Available
Experimental and computational details; tables of NMR scalar coupling constants, 15N relaxation, and order parameters; a table summarizing the dynamic behavior of interfacial Lys NH3+ groups in the MD simulations; a figure of F1-1H-coupled HSQC spectra; and a figure of autocorrelation functions. The Supporting Information is available free of charge on the ACS Publications website at DOI: 10.1021/acs.jpclett.5b01134.
The authors declare no competing financial interest.
Supplementary Material
References
- Pettitt B. M.; Rossky P. J. Alkali-Halides in Water - Ion Solvent Correlations and Ion Ion Potentials of Mean Force at Infinite Dilution. J. Chem. Phys. 1986, 84, 5836–5844. [Google Scholar]
- Collins K. D. Charge Density-Dependent Strength of Hydration and Biological Structure. Biophys. J. 1997, 72, 65–76. [DOI] [PMC free article] [PubMed] [Google Scholar]
- Marcus Y.; Hefter G. Ion Pairing. Chem. Rev. 2006, 106, 4585–4621. [DOI] [PubMed] [Google Scholar]
- Simon J. D.; Peters K. S. Picosecond Dynamics of Ion-Pairs - The Effect of Hydrogen-Bonding on Ion-Pair Intermediates. J. Am. Chem. Soc. 1982, 104, 6542–6547. [Google Scholar]
- Masnovi J. M.; Kochi J. K. Direct Observation of Ion-Pair Dynamics. J. Am. Chem. Soc. 1985, 107, 7880–7893. [Google Scholar]
- Yabe T.; Kochi J. K. Contact Ion-Pairs - Picosecond Dynamics of Solvent Separation, Internal Return, and Special Salt Effect. J. Am. Chem. Soc. 1992, 114, 4491–4500. [Google Scholar]
- Peters K. S.; Li B. L. Picosecond Dynamics of Contact Ion-Pairs and Solvent-Separated Ion-Pairs in the Photosolvolysis of Diphenylmethyl Chloride. J. Phys. Chem. 1994, 98, 401–403. [Google Scholar]
- Case D. A. Molecular Dynamics and NMR Spin Relaxation in Proteins. Acc. Chem. Res. 2002, 35, 325–331. [DOI] [PubMed] [Google Scholar]
- Loria J. P.; Berlow R. B.; Watt E. D. Characterization of Enzyme Motions by Solution NMR Relaxation Dispersion. Acc. Chem. Res. 2008, 41, 214–221. [DOI] [PubMed] [Google Scholar]
- Mittermaier A. K.; Kay L. E. Observing Biological Dynamics at Atomic Resolution Using NMR. Trends Biochem. Sci. 2009, 34, 601–611. [DOI] [PubMed] [Google Scholar]
- Jensen M. R.; Zweckstetter M.; Huang J. R.; Blackledge M. Exploring Free-Energy Landscapes of Intrinsically Disordered Proteins at Atomic Resolution Using NMR Spectroscopy. Chem. Rev. 2014, 114, 6632–6660. [DOI] [PubMed] [Google Scholar]
- Palmer A. G. III. Chemical Exchange in Biomacromolecules: Past, Present, and Future. J. Magn. Reson. 2014, 241, 3–17. [DOI] [PMC free article] [PubMed] [Google Scholar]
- Paquin R.; Ferrage F.; Mulder F. A.; Akke M.; Bodenhausen G. Multiple-Timescale Dynamics of Side-Chain Carboxyl and Carbonyl Groups in Proteins by 13C Nuclear Spin Relaxation. J. Am. Chem. Soc. 2008, 130, 15805–15807. [DOI] [PubMed] [Google Scholar]
- Trbovic N.; Cho J. H.; Abel R.; Friesner R. A.; Rance M.; Palmer A. G. III. Protein Side-Chain Dynamics and Residual Conformational Entropy. J. Am. Chem. Soc. 2009, 131, 615–622. [DOI] [PMC free article] [PubMed] [Google Scholar]
- Hansen A. L.; Kay L. E. Quantifying Millisecond Time-Scale Exchange in Proteins by CPMG Relaxation Dispersion NMR Spectroscopy of Side-Chain Carbonyl Groups. J. Biomol. NMR 2011, 50, 347–355. [DOI] [PubMed] [Google Scholar]
- Esadze A.; Li D. W.; Wang T.; Brüschweiler R.; Iwahara J. Dynamics of Lysine Side-Chain Amino Groups in a Protein Studied by Heteronuclear 1H–15N NMR Spectroscopy. J. Am. Chem. Soc. 2011, 133, 909–919. [DOI] [PubMed] [Google Scholar]
- Zandarashvili L.; Li D. W.; Wang T.; Brüschweiler R.; Iwahara J. Signature of Mobile Hydrogen Bonding of Lysine Side Chains from Long-Range 15N–13C Scalar J-Couplings and Computation. J. Am. Chem. Soc. 2011, 133, 9192–9195. [DOI] [PubMed] [Google Scholar]
- Anderson K. M.; Esadze A.; Manoharan M.; Brüschweiler R.; Gorenstein D. G.; Iwahara J. Direct Observation of the Ion-Pair Dynamics at a Protein–DNA Interface by NMR Spectroscopy. J. Am. Chem. Soc. 2013, 135, 3613–3619. [DOI] [PMC free article] [PubMed] [Google Scholar]
- Iwahara J.; Jung Y. S.; Clore G. M. Heteronuclear NMR Spectroscopy for Lysine NH3 Groups in Proteins: Unique Effect of Water Exchange on 15N Transverse Relaxation. J. Am. Chem. Soc. 2007, 129, 2971–2980. [DOI] [PubMed] [Google Scholar]
- Zandarashvili L.; Esadze A.; Iwahara J. NMR Studies on the Dynamics of Hydrogen Bonds and Ion Pairs Involving Lysine Side Chains of Proteins. Adv. Protein Chem. Struct. Biol. 2013, 93, 37–80. [DOI] [PubMed] [Google Scholar]
- Zandarashvili L.; Iwahara J. Temperature Dependence of Internal Motions of Protein Side-Chain NH3+ Groups: Insight into Energy Barriers for Transient Breakage of Hydrogen Bonds. Biochemistry 2015, 54, 538–545. [DOI] [PubMed] [Google Scholar]
- Elrod-Erickson M.; Rould M. A.; Nekludova L.; Pabo C. O. Zif268 Protein-DNA Complex Refined at 1.6 Å: A Model System for Understanding Zinc Finger–DNA Interactions. Structure 1996, 4, 1171–1180. [DOI] [PubMed] [Google Scholar]
- Esadze A.; Kemme C. A.; Kolomeisky A. B.; Iwahara J. Positive and Negative Impacts of Nonspecific Sites During Target Location by a Sequence-Specific DNA-Binding Protein: Origin of the Optimal Search at Physiological Ionic Strength. Nucleic Acids Res. 2014, 42, 7039–7046. [DOI] [PMC free article] [PubMed] [Google Scholar]
- Fraenkel E.; Pabo C. O. Comparison of X-ray and NMR Structures for the Antennapedia Homeodomain–DNA Complex. Nat. Struct. Biol. 1998, 5, 692–697. [DOI] [PubMed] [Google Scholar]
- Qian Y. Q.; Billeter M.; Otting G.; Muller M.; Gehring W. J.; Wüthrich K. The Structure of the Antennapedia Homeodomain Determined by NMR Spectroscopy in Solution: Comparison with Prokaryotic Repressors. Cell 1989, 59, 573–580. [DOI] [PubMed] [Google Scholar]
- Zandarashvili L.; Vuzman D.; Esadze A.; Takayama Y.; Sahu D.; Levy Y.; Iwahara J. Asymmetrical Roles of Zinc Fingers in Dynamic DNA-Scanning Process by the Inducible Transcription Factor Egr-1. Proc. Natl. Acad. Sci. U. S. A. 2012, 109, E1724–1732. [DOI] [PMC free article] [PubMed] [Google Scholar]
- Andre I.; Linse S.; Mulder F. A. Residue-Specific pKa Determination of Lysine and Arginine Side Chains by Indirect 15N and 13C NMR Spectroscopy: Application to Apo Calmodulin. J. Am. Chem. Soc. 2007, 129, 15805–15813. [DOI] [PubMed] [Google Scholar]
- Takayama Y.; Castaneda C. A.; Chimenti M.; Garcia-Moreno B.; Iwahara J. Direct Evidence for Deprotonation of a Lysine Side Chain Buried in the Hydrophobic Core of a Protein. J. Am. Chem. Soc. 2008, 130, 6714–6715. [DOI] [PubMed] [Google Scholar]
- Anderson K. M.; Nguyen D.; Esadze A.; Zandarashvili L.; Gorenstein D. G.; Iwahara J. A Chemical Approach for Site-Specific Identification of NMR Signals from Protein Side-Chain NH3+ Groups Forming Intermolecular Ion Pairs in Protein-Nucleic Acid Complexes. J. Biomol. NMR 2015, 62, 1–5. [DOI] [PMC free article] [PubMed] [Google Scholar]
- Esadze A.; Zandarashvili L.; Iwahara J. Effective Strategy to Assign 1H-15N Heteronuclear Correlation NMR Signals from Lysine Side-Chain NH3+ Groups of Proteins at Low Temperature. J. Biomol. NMR 2014, 60, 23–27. [DOI] [PMC free article] [PubMed] [Google Scholar]
- Phillips J. C.; Braun R.; Wang W.; Gumbart J.; Tajkhorshid E.; Villa E.; Chipot C.; Skeel R. D.; Kale L.; Schulten K. Scalable Molecular Dynamics with NAMD. J. Comput. Chem. 2005, 26, 1781–1802. [DOI] [PMC free article] [PubMed] [Google Scholar]
- Foloppe N.; MacKerell A. D. All-Atom Empirical Force Field for Nucleic Acids: I. Parameter Optimization Based on Small Molecule and Condensed Phase Macromolecular Target Data. J. Comput. Chem. 2000, 21, 86–104. [Google Scholar]
- MacKerell A. D.; Bashford D.; Bellott M.; Dunbrack R. L.; Evanseck J. D.; Field M. J.; Fischer S.; Gao J.; Guo H.; Ha S.; Joseph-McCarthy D.; Kuchnir L.; Kuczera K.; Lau F. T.; Mattos C.; Michnick S.; Ngo T.; Nguyen D. T.; Prodhom B.; Reiher W. E.; Roux B.; Schlenkrich M.; Smith J. C.; Stote R.; Straub J.; Watanabe M.; Wiorkiewicz-Kuczera J.; Yin D.; Karplus M. All-Atom Empirical Potential for Molecular Modeling and Dynamics Studies of Proteins. J. Phys. Chem. B 1998, 102, 3586–3616. [DOI] [PubMed] [Google Scholar]
- Mackerell A. D. Jr.; Feig M.; Brooks C. L. III. Extending the Treatment of Backbone Energetics in Protein Force Fields: Limitations of Gas-Phase Quantum Mechanics in Reproducing Protein Conformational Distributions in Molecular Dynamics Simulations. J. Comput. Chem. 2004, 25, 1400–1415. [DOI] [PubMed] [Google Scholar]
- Baker N. A.; Sept D.; Joseph S.; Holst M. J.; McCammon J. A. Electrostatics of Nanosystems: Application to Microtubules and the Ribosome. Proc. Natl. Acad. Sci. U. S. A. 2001, 98, 10037–10041. [DOI] [PMC free article] [PubMed] [Google Scholar]
- Karplus M. Contact Electron-Spin Coupling of Nuclear Magnetic Moments. J. Chem. Phys. 1959, 30, 11–15. [Google Scholar]
- Huang J.; MacKerell A. D. Jr. CHARMM36 All-Atom Additive Protein Force Field: Validation Based on Comparison to NMR Data. J. Comput. Chem. 2013, 34, 2135–2145. [DOI] [PMC free article] [PubMed] [Google Scholar]
- Gu Y.; Li D. W.; Brüschweiler R. NMR Order Parameter Determination from Long Molecular Dynamics Trajectories for Objective Comparison with Experiment. J. Chem. Theory Comput 2014, 10, 2599–2607. [DOI] [PubMed] [Google Scholar]
- Maragakis P.; Lindorff-Larsen K.; Eastwood M. P.; Dror R. O.; Klepeis J. L.; Arkin I. T.; Jensen M. O.; Xu H.; Trbovic N.; Friesner R. A.; Iii A. G.; Shaw D. E. Microsecond Molecular Dynamics Simulation Shows Effect of Slow Loop Dynamics on Backbone Amide Order Parameters of Proteins. J. Phys. Chem. B 2008, 112, 6155–6158. [DOI] [PMC free article] [PubMed] [Google Scholar]
- Fennell C. J.; Bizjak A.; Vlachy V.; Dill K. A. Ion Pairing in Molecular Simulations of Aqueous Alkali Halide Solutions. J. Phys. Chem. B 2009, 113, 6782–6791. [DOI] [PMC free article] [PubMed] [Google Scholar]
- Barril X.; Aleman C.; Orozco M.; Luque F. J. Salt Bridge Interactions: Stability of the Ionic and Neutral Complexes in the Gas Phase, in Solution, and in Proteins. Proteins: Struct., Funct. Genet. 1998, 32, 67–79. [DOI] [PubMed] [Google Scholar]
- Nadig G.; Van Zant L. C.; Dixon S. L.; Merz K. M. Charge-Transfer Interactions in Macromolecular Systems: A New View of the Protein/Water Interface. J. Am. Chem. Soc. 1998, 120, 5593–5594. [Google Scholar]
- Masunov A.; Lazaridis T. Potentials of Mean Force between Ionizable Amino Acid Side Chains in Water. J. Am. Chem. Soc. 2003, 125, 1722–1730. [DOI] [PubMed] [Google Scholar]
Associated Data
This section collects any data citations, data availability statements, or supplementary materials included in this article.