Abstract
Kidney stones have been shown to exhibit a “twinkling artifact” (TA) under Color-Doppler ultrasound. Although this technique has better specificity than conventional Bmode imaging, it has lower sensitivity. To improve the overall performance of using TA as a diagnostic tool, Doppler output parameters were optimized in-vitro. The collected data supports a previous hypothesis that TA is caused by random oscillations of micron sized bubbles trapped in the cracks and crevices of kidney stones. A set of optimized parameters were implemented such that that the MI & TI remained within the FDA approved limits. Several clinical kidney scans were performed with the optimized settings and were able to detect stones with improved SNR relative to the default settings.
Keywords: Ultrasound, Doppler, kidney stone, detection, cavitation, optimization
I. Introduction
Kidney stone disease affects 11% of the population in the US [1] with a reoccurrence rate of 35–50% within 5 years [2]. Typical diagnostics for kidney stone disease is computed tomography (CT) with KUB x-rays for follow up. Depending upon how much imaging is required, this can lead to a considerable radiation dosage administered to a patient. Though ultrasound is sometimes used for follow up exams and is typically used for pediatric and pregnant stone patients, it suffers from a broad range of sensitivity (78%–96%) and specificity (31–100%) in the detection of stones [3,4].
A method for improving the sensitivity and specificity of ultrasound is to leverage an imaging artifact that kidney stones viewed under Color Doppler appear to “twinkle”. That is to say, the color coded velocity estimation fluctuates randomly throughout the entire Doppler color map. Studies have shown that although the sensitivity of the twinkling artifact (TA) is lower than B mode (56% vs 71%), the specificity is much greater (74% vs 48%)[5]. One could use B mode to find a suspected region of a possible kidney stone and then test the region with CF Doppler to see that it twinkles to improve the overall accuracy of detection.
In addition to testing the efficacy of TA as a diagnostic tool, there has been research to determine the mechanism of the twinkling artifact with the intention of improving the sensitivity. Theories for TA have ranged from phase jitter in the hardware to stone motion. Our group has hypothesized the existence of micron sized bubbles trapped in the cracks and crevices on the stone. To understand why this would cause TA, one needs to understand that the processed Doppler measurements are sensitive to weakly scattering blood cells and filter out the strongly scattering vessel wall signal. This is typically done with a wall filtering to block out low frequency signals from the vessel walls and measuring phase difference between a series of pulses within a Doppler ensemble to measure the phase. With this in mind, a stable hyperechoic target will reflect back a series of incidence pulses with repeatability in the amplitude and zero phase delay and thus zero velocity. If the target is in motion, there will be repeatable phase delay between pulses which is calculated as a velocity. If the target has randomness in the scattering, then the phase and amplitude will have randomness with it as well. In the case of a kidney stone, multiple bubbles trapped in cracks or crevices can oscillate from a strong enough incident wave. Since a Doppler pulse is multiple cycles in each pulse, the initial part of the pulse excites the bubbles and then the later part of the wave scatters back randomly with the collective random growth and collapse of the bubbles. The wall filter removes the bright scattering signal from the stone itself, leaving only random backscatter signal from the bubbles. This leads to random phase delay between pulses in the ensemble therefore the velocity estimate is random, and thus twinkling. This hypothesis was tested by the disappearance of the twinkling artifact as the stone was over-pressured during imaging to suppress bubble activity [6].
Under this hypothesis, we aimed to improve the sensitivity and specificity of twinkling artifact as a diagnostic tool for finding kidney stones. The approach has two-parts:
Enhance the random bubble activity without exceeding FDA acoustic output limits (MI & TI). This will improve the sensitivity of TA.
Filter out blood flow imaging and motion artifact that typically appears as the probe moves during a Color Doppler imaging. This will improve the specificity.
II. Materials and Methods
To allow for full control over the Doppler imaging hardware and software, we used a V-1 Verasonics Data Acquisition System (VDAS, Verasonics Inc., Redmond, WA, USA). The device is programmed and controlled through a host computer (HP Z820, Hewlett Packard, Palo Alto, CA, USA) using MATLAB (Mathworks, Waltham, MA, USA). The system is programmed to work with the ATL HDI C5-2 or the ATL HDI P4-1 (Philips Ultrasound, Andover, MA, USA).
An agar-glycerol based soft tissue mimicking phantom (fig. 1) was made per IEC guidelines [7]. The phantom had 5cm of material between the probe and the targets with a 1cm void where the targets sat followed by 4cm of material and an acoustic absorber on the bottom to prevent reflections. A real 4mm COM stone and a 4mm glass bead were used as targets. The probe was aligned with the targets such that the brightest hyperecho from both targets was achieved in a B mode scan. The glass bead was used as a stable backscattering target that does not have any bubbles trapped on its surface and is used as a reference Doppler power value. Therefore as parameters are changed, any change in the Doppler power of the glass bead will be due to some other effect.
Figure 1.
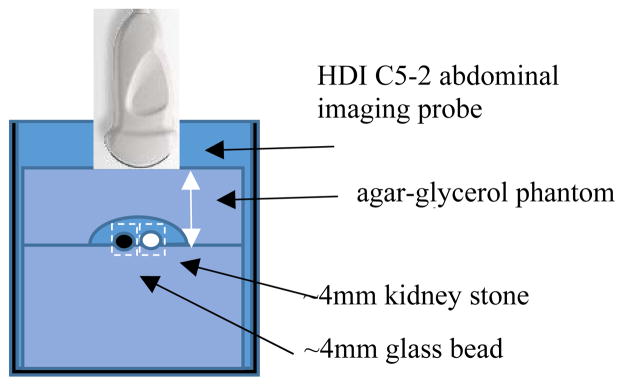
Experimental Setup
A plane wave Doppler imaging sequence was used with the parameters swept individually. The beamformed IQ data ensemble was saved for each parameter setting and three samples were taken for each parameter. The raw RF signal was also monitored to make sure that the A/D acquisition was not saturating since this can also cause twinkling artifact.
IQ data was collected after Verasonics software beamforming process. The first two pulses in the ensemble were dropped and the remaining pulses were low-pass wall filtered by a quadratic regression curve fit method. Since the magnitude of the TA is required for optimization, Doppler power is then calculated for each voxel over the entire imaging plane. The stone and glass bead positions were then manually selected and the average Doppler power/voxel was calculate for a 5mm × 5mm square region centered on the target. A 10mm × 10mm square region also centered around the stone, but not including the stone ROI was used as the “noise” value for calculating the effective SNR of the TA. Three acquistions were collected for each set of parameters and the SNR of the stone was plotted along with that of the bead as reference.
III. Results
A. #cycles/pulse
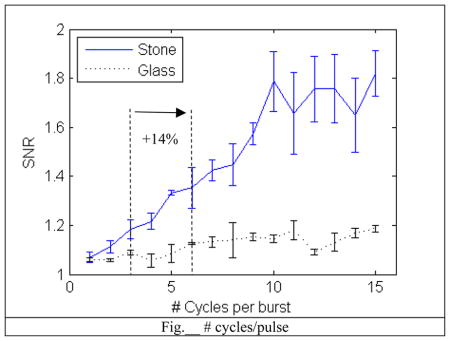
Increasing the number of cycles for each pulse improved the SNR linearly. This makes sense since there are more cycles of ultrasound generating an increase in random bubble activity. The downside to longer pulses is a decrease in axial resolution, but this is an acceptable sacrifice since we are using this method to detect the stone and using the BMode for the actual imaging.
B. Angle
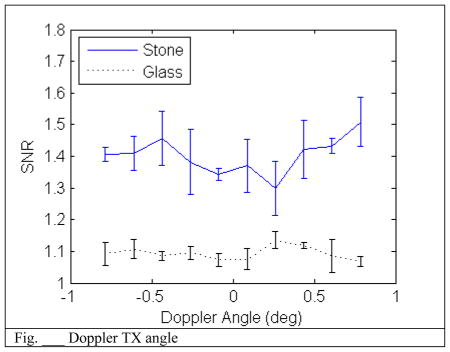
Varying the Angle does not seem to have a dramatic effect on increasing the SNR. This is expected since the stone shape has a rough surface and the backscatter intensity should be independent of angle.
C. PRF
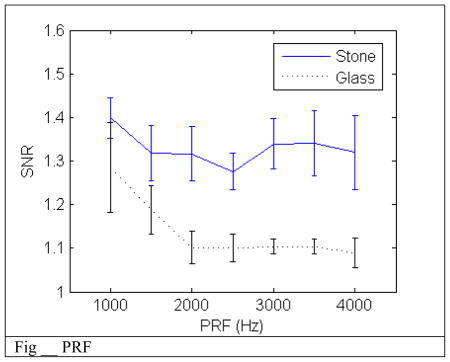
SNR remains constant over the tested PRF range. This makes sense because the decay time for a micron sized bubble is much shorter than the period between pulses. Therefore each pulse should not interfere with another pulse. This independence of the PRF on SNR allows for a maximum PRF setting dependent on imaging depth. This would increase the range of the velocity measurement which will improve the efficacy of the wall filter for removing motion artifact and low velocity blood flow.
Amplitude:
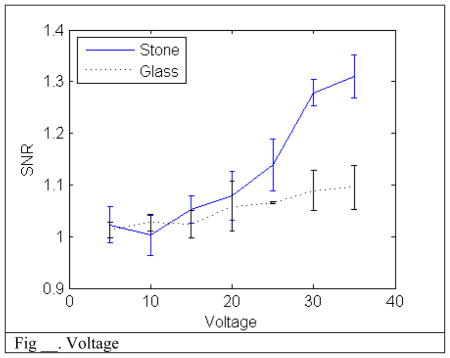
Increasing the amplitude of the transmit signal increases the SNR for both the stone and the glass bead though the stone has a much more significant improvement. The overall improvement is due to the increase of the backscatter signal over thermal noise. The discrepancy between the two targets is due to the random bubble activity effect having a much greater response than the backscatter.
D. #pulses/ensemble
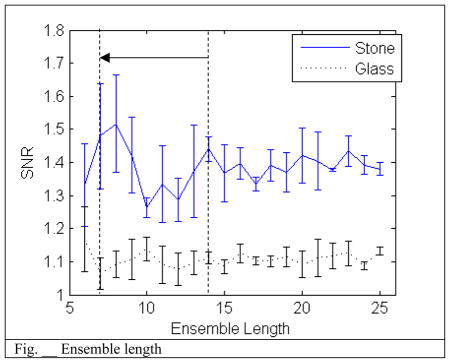
Ensemble length also does not seem to have an effect on the SNR. This is most likely also due to the period between pulses is much longer than the bubble decay time and so each pulse has no effect on another pulse. However, the wall filter operates differently depending on the number of samples and too short of an ensemble will begin to filter out the random bubble activity signal as well. More work needs to be performed to optimize a balance between the wall filter and the ensemble length.
New output parameters were programmed in to the Doppler imaging sequence for human trials. Doubling the number of transmit cycles from the default of 3 to 6 should give a SNR increase of 14%. To balance the thermal index, the number of pulses in the ensemble is reduced from 14 to 7 which would leaves the SNR unchanged.. These new output parameters were tested with positive results. An example image for both Bmode and TA are shown below
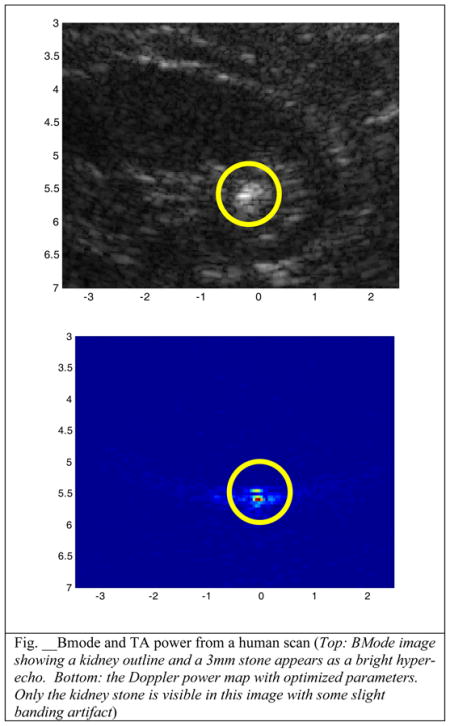
Five sets of data were collected from two different patients. The large variability of the TA SNR is not surprising over 5 frames of data. This can be attributed to the random excitation of the bubbles and thus variability in the measured power. It should be noted that the frame with the lowest SNR was on the same order of as the Bmode detection and the maximum SNR was an order of magnitude higher. Therefore it can be suggested that depending on the acquisition frame, TA has similar if not much better sensitivity compared to Bmode.
IV. Conclusion
This work was developed on the underlying theory that TA is due to micron size bubbles trapped in the cracks of kidney stones. By systematically varying all of the Doppler output parameters, we have seen a parameter sensitivity which supports the trapped bubble theory. Additionally, by using an optimized set of parameters we are able to collect data in human scans that suggest an increased sensitivity of the TA for kidney stone detection. Future work involves continuing to collect data samples from more kidney stone patients and comparing the sensitivity of the new parameters to the default parameter set as well as further refinement of the parameters. Additionally, changing the wall-filter was not investigated in this study. Further research would involve using different filtering methods that could do a better job of removing motion artifact and blood flow from the estimation. Another improvement would to use a broadly focused Doppler beamforming method. This would increase the energy directed at the stone and enhance bubble activity. This would need to balance out with MITI limits as before. One final note on the subject of MITI, increasing the number of cycles at a given peak negative pressure could potentially increase risk of cavitation but current regulatory limits do not address this concern.
TABLE I.
Optimization Parameters
| Parameter: | Default Value: | Range: |
|---|---|---|
| # cycles/pulse | 3 | 0.5 – 7.5 cycles |
| #pulses/ensemble | 14 | 4 – 25 pulses |
| TX angle | 0 deg | −45deg – +45deg |
| PRF | 4000Hz | 500Hz – 4000Hz |
| Doppler TX Voltage: | 20Vp | 5Vp – 35Vp |
TABLE II.
Preliminary clinical results
| SNR | TA | B mode |
|---|---|---|
| Mean | 11.1 | 2.6 |
| Std. dev. | 11.4 | 0.3 |
| Min. | 2.11 | 2.3 |
| Max. | 29.4 | 3.1 |
Acknowledgments
This work was supported by NIH DK43881 and DK092197, and NSBRI through NASA NCC 9-58.
References
- 1.Stamatelou KK, Francis ME, Jones CA, et al. Time trends in reported prevalence of kidney stones in the United States. 1976–1994 Kidney International. 2003 May;63(5):1817–23. doi: 10.1046/j.1523-1755.2003.00917.x. [DOI] [PubMed] [Google Scholar]
- 2.Uribarri J, Oh MS, Carroll HJ. The first kidney stone. Ann Intern Med. 1989 Dec 15;111(12):1006–9. doi: 10.7326/0003-4819-111-12-1006. [DOI] [PubMed] [Google Scholar]
- 3.Varma G, Nair N, Salim A, et al. Investigations for Recognizing Urinary Stone. Urol Res. 2009;37(6):349–52. doi: 10.1007/s00240-009-0219-z. http://www.ncbi.nlm.nih.gov/pubmed/19826802. [DOI] [PubMed] [Google Scholar]
- 4.Middleton WD, Dodds WJ, Lawson TL, et al. Renal calculi: sensitivity for detection with US. Radiology. 1988;167(1):239–44. doi: 10.1148/radiology.167.1.3279456. http://www.ncbi.nlm.nih.gov/pubmed/3279456. [DOI] [PubMed] [Google Scholar]
- 5.Sorensen, et al. B-mode Ultrasound Versus Color Doppler Twinkling Artifact in Detecting Kidney Stones. J Endourol Feb. 2013;27(2):149–153. doi: 10.1089/end.2012.0430. [DOI] [PMC free article] [PubMed] [Google Scholar]
- 6.Lu, et al. Evidence for Trapped Surface Bubbles as the Cause for the Twinkling Artifact in Ultrasound Imaging. Ultrasound in medicine & biology. 2013 Apr; doi: 10.1016/j.ultrasmedbio.2013.01.011. [DOI] [PMC free article] [PubMed] [Google Scholar]
- 7.IEC 60601-2-37 ed2.0 2007-08


