

Abstract
Cerebral amyloid angiopathy (CAA) is a vascular lesion associated with Alzheimer’s disease (AD) present in up to 95% of AD patients and produces MRI-detectable microbleeds in many of these patients. It is possible that CAA-related microbleeding is a source of pathological iron in the AD brain. Because the homeostasis of copper, iron, and zinc are so intimately linked, we determined whether CAA contributes to changes in the brain levels of these metals. We obtained brain tissue from AD patients with severe CAA to compare to AD patients without evidence of vascular amyloid-β. Patients with severe CAA had significantly higher non-heme iron levels. Histologically, iron was deposited in the walls of large CAA-affected vessels. Zinc levels were significantly elevated in grey matter in both the CAA and non-CAA AD tissue, but no vascular staining was noted in CAA cases. Copper levels were decreased in both CAA and non-CAA AD tissues and copper was found to be prominently deposited on the vasculature in CAA. Together, these findings demonstrate that CAA is a significant variable affecting transition metals in AD.
Keywords: Atomic absorption, coppersensor 1 (CS1), ferrous, non-heme iron
INTRODUCTION
There is considerable interest in understanding transition metal homeostasis in the brain, particularly in Alzheimer’s disease (AD) research. The AD neocortex is frequently stated to contain increased iron levels at the tissue level. Numerous review articles have suggested that AD brain contains two to five fold more iron than control tissue [1–4]. Remarkably, most quantitative measurements of brain iron failed to show any increase in neocortical iron in AD [5–14]. Nevertheless, increases in iron levels in deep grey matter structures of the brain in patients with AD have been clearly demonstrated and other disturbances in iron levels and distribution may be more easily detected in qualitative studies [8, 9, 12]. However, despite extensive investigation, the source of this abnormal iron remains a matter of debate; it may represent a metabolic derangement, abnormal deposition or clearance, or perhaps some other explanation.
Cerebral amyloid angiopathy (CAA) is a vascular manifestation of AD which is present in as many as 95% of AD patients and can produce MRI-detectable microbleeds even in patients with only mild cognitive impairment [15–17]. Vascular amyloid-β (Aβ) deposition results in loss of vascular smooth muscle cells (particularly in arterioles), and thickening of the vessel wall with congophilic material. These changes result in fragility of the microvascular system, although the exact mechanism which undermines its stability is not known [18, 19]. Several studies have demonstrated that iron-rich deposits staining positive for Aβ are preferentially distributed near vascular elements, which may suggest that microbleeding could be a catalyst for the formation of AD-like pathologic lesions [20–22]. Because of the near-ubiquitous presence of CAA in the context of AD, it is possible that CAA-related microbleeding is a significant source of pathological iron in AD brain. In this study we assessed this hypothesis by determining the levels of various metals by both analytical and qualitative techniques in groups of cases with severe AD and either severe or negligible CAA.
MATERIALS AND METHODS
Tissue selection
Postmortem tissue was obtained from the Alzheimer’s Disease Research Center Brain Bank at the University of California, Los Angeles. All patients and/or their surrogates had consented to participate in research protocols prior to tissue donation. The research was approved by the Institutional Review Board of Loma Linda University Medical Center (approval #54174). Both frozen tissue specimens and fixed tissues were available for study. Neuropathologic examination at the time of autopsy included Braak and Braak staging of AD and Vonsattel grading of CAA pathology [23–25]. Vonsattel staging describes the severity of CAA as follows: stage 1) Aβ deposition limited to the basement membrane of arterioles and primarily involving leptomeningeal vessels; stage 2) Aβ deposited between vascular smooth muscle cells and pathology extends to penetrating arterioles and stage 3) Aβ largely replaces vascular smooth muscle in arterioles. Microaneurysms and microhemorrhages often occur with Vonsattel stage 3 CAA.
Frozen tissue was isolated from the superior or middle temporal lobe gyrus for three groups of patients; six samples were obtained for an aged neurological control group, along with eight AD samples without evidence of significant CAA (Vonsattel grades 0–1) and eight AD samples with severe CAA (grade 3). Patient demographics are listed in Table 1.
Table 1.
Patient demographics and neuropathological findings
| Patient group | Number of cases | Age | Gender | Neuropathological characterization |
|---|---|---|---|---|
| Aged control (neurologically normal) | 6 | 76 ± 12 | 5 M 1 F |
Normal (age-related changes only) |
| Alzheimer’s disease w/o significant cerebral amyloid angiopathy | 8 | 86 ± 6 | 1 M 7 F |
Braak and Braak stages V–VI Vonsattel grade 0–1 |
| Alzheimer’s disease w/severe cerebral amyloid angiopathy | 8 | 82 ± 7 | 4 M 4 F |
Braak and Braak stages V–VI Vonsattel grade 3–3+ |
Atomic absorption spectrometry
Metal measurements were conducted as previously described [26]. Blocks of grey matter and white matter weighing between 30 and 60 mg were cut from the donated specimens. For total iron, copper, zinc, and aluminum determination, tissue was prepared by nitric acid ashing. Brain tissue was covered in concentrated nitric acid (300 μL) overnight, and then incubated in a water bath at 80°C for 20 min. The solution was allowed to cool to room temperature for 10 min. Hydrogen peroxide (300 μL of 10 M solution) was then added to dissolve the lipid components and allowed to incubate at room temperature for 30 min. The mixture was then incubated at 70°C in the water bath for 15 min. The resulting solution was allowed to cool to room temperature for 10 min, thoroughly vortexed, and then frozen until needed.
For non-heme iron extraction, 260 μL of 500 μM EDTA was added to brain regions which were then homogenized. One hundred microliters of trichloroacetic acid (20% solution in 500 μM EDTA) was added and thoroughly vortexed before incubating at 90°C for 30 min. Finally, 700 μL of the EDTA solution was added and thoroughly vortexed. The resulting suspension was centrifuged at 13,000g for 10 min and the supernatant was collected as the non-heme iron sample.
Atomic absorption spectra were measured with a Varian SpectrAA 220Z graphite furnace atomic absorption spectrometer and processed with Spec-trAA software v.4.1 (Varian Inc., California). Standard curves were produced from 25, 50, 75, and 100 parts per billion solutions of standard iron, copper, or aluminum in nitric acid (Arcos Organics, New Jersey). Standard curve for zinc was produced from 250, 500, 750, and 1000 parts per billion solutions of standard zinc in nitric acid (Solutions Plus Inc., Missouri). The spectrometer was zeroed to a maximum of 0.005 mean absorbance. For total iron measurements, samples were diluted 1 : 40; for non-heme iron, samples were diluted 1 : 20; for zinc measurements, samples were diluted 1 : 10; for copper, samples were diluted 1 : 20; and for aluminum, samples were diluted 1 : 5. All sample values presented in Table 2 are the mean of six measurements.
Table 2.
Temporal lobe metal concentrations
| Metal | Aged control | Alzheimer’s disease w/o significiant cerebral amyloid angiopathy | Alzheimer’s disease w/ severe cerebral amyloid angiopathy |
|---|---|---|---|
| Total iron, white matter | 58.89 ± 7.68 | 53.40 ± 9.68 | 70.20 ± 17.98Ψ |
| Total iron, grey matter | 46.22 ± 14.60 | 46.04 ± 9.48 | 52.44 ± 12.90 |
| Non-heme iron, white matter | 50.16 ± 25.47 | 51.52 ± 13.71 | 72.31 ± 20.66Ψ |
| Non-heme iron, grey matter | 34.19 ± 9.47 | 40.88 ± 13.33 | 53.49 ± 15.59* |
| Zinc, white matter | 26.49 ± 5.65 | 28.98 ± 5.70 | 25.68 ± 7.33 |
| Zinc, grey matter | 16.05 ± 3.75 | 23.66 ± 5.99* | 24.28 ± 4.50** |
| Copper, white matter | 6.00 ± 1.10 | 4.28 ± 1.30* | 4.41 ± 1.28* |
| Copper, grey matter | 5.72 ± 1.20 | 3.74 ± 1.07** | 3.94 ± 1.02* |
| Aluminum, white matter | 1.82 ± 0.86 | 3.50 ± 1.91 | 2.63 ± 2.24 |
| Aluminum, grey matter | 2.94 ± 2.12 | 4.24 ± 3.82 | 2.45 ± 1.69 |
Data presented as μg metal/g wet tissue ± standard deviation.
p < 0.05 compared to Alzheimer’s disease w/o significant cerebral amyloid angiopathy.
p < 0.05,
p < 0.01 compared to control.
Histology
Frozen sections were prepared for four of the patients from each group for histology; case selection was random from each group and was conducted prior to atomic absorption studies. Histological slides were prepared on a Leica cryostat with either 14 or 20 μm thick sections of brain tissue containing both an intact portion of the cortical ribbon and adjacent white matter. Iron staining was accomplished with modified Prussian Blue and Turnbull’s blue methods on the 20 μm thick sections. Prolonged incubation times were employed to increase the sensitivity of the techniques [21, 22, 27]. Ideal incubation times for aged brain to balance signal to background-noise ratio were optimized to 48 h. Frozen sections were allowed to dry at room temperature for 10 min and then briefly fixed for 10 min in absolute methanol. While staining of never-fixed tissue is preferred to limit the possibility of leaching metals from the tissue, unfixed brain tissue was not stable throughout the long staining procedure. Methanol-fixation has been shown in a study using hepatocytes to preserve iron levels far better than formalin-containing fixatives [28]. Staining solutions for each probe were prepared as 5% potassium ferrocyanide (for Prussian Blue labeling of ferric iron) or 5% potassium ferricyanide (for Turnbull’s blue labeling of ferrous iron) dissolved in an aqueous solution with 10% hydrochloric acid. After 24 h exposure, the staining solution was replaced with fresh solution for a further 24 h. The sections were then washed in distilled deionized water, dehydrated through 100% ethanol, cleared in xylene and mounted in a resinous medium (Permount, Fisher Scientific). The slides were imaged on a Leica DM50 light microscope (Leica Microsystems, Illinois), at least five fields containing arterioles and five of capillaries were captured from each slide.
Zinc was visualized using a fluorescein-conjugated probe, ZP4, as follows. Frozen, 14 micron sections were allowed to dry at room temperature for 10 min and were then placed in PBS for 30 min. A 2 μM solution of the zinc probe in PBS was prepared and gently pipetted over the section. After 10-min incubation, the sections were washed three times in PBS for 10 min each. Care was taken to minimize agitation to prevent damage to the unfixed tissue section. A thin paraffin spacer was placed on the slide and the section was coverslipped with aqueous mounting medium containing DAPI. The slide was then immediately imaged on an Olympus confocal microscope (Olympus America Inc., Pennsylvania).
Copper was imaged using a turn-on probe with a BODIPY fluorophore, copper sensor 1 (CS1). The fluorescent yield from this probe has been reported to increase 10 fold upon binding to monovalent copper [29–31]. Sections were allowed to dry for 10 min, per-meabilized in Triton-X in PBS for 10 min and finally washed gently in PBS for an additional 10 min. A 2 μM solution of the CS1 probe was prepared and pipetted over the section. After 10 min, the excess probe was tapped off the slide which was then mounted with a thin paraffin spacer in aqueous mounting medium containing DAPI (Vector Labs, California). For colocalization of vascular copper deposits with Aβ, we added a 10-min incubation of the section in 1% Thioflavin-S solution followed by thorough washing to the procedure prior to the CS1 incubation.
For immunohistochemistry, fixed tissue from the same cases was embedded in paraffin in the usual fashion and 8 μm sections were prepared and mounted on slides. Sections were deparafinized in two exchanges of xylene and hydrated to water through descending concentrations of ethanol. For antigen recovery, sections were placed in a 10 mM borate buffer solution (pH 6.0) and heated in the microwave for 30 s. After cooling to room temperature, the sections were heated twice more. The borate buffer was then replaced with phosphate buffered saline (PBS). Endogenous peroxidases were blocked with a solution of 0.3% H2O2 in PBS for 15 min and slides were washed in PBS. The sections were then incubated with 10% normal goat serum in PBS for 2 h followed by primary antibody incubation overnight (rabbit monoclonal heme oxygenase-1 (HO-1) 1 : 500 and mouse monoclonal Blvd R B 1 : 200, both from Abcam, Massachusetts). The sections were then washed three times in PBS and incubated with an HRP conjugated secondary antibody (dilution 1 : 2000, Abcam) for 2 h. The sections were again washed three times in PBS. The sections were developed with a DAB containing kit (Vector-labs), washed again in PBS and lightly counterstained with hematoxylin. After a final wash, the sections were dehydrated through ascending concentrations of ethanol, cleared in xylene and mounted in a resinous mounting medium.
Electrophoresis
Protein levels of heme degradation enzymes were determined by denaturing SDS-PAGE and western blot. Briefly, tissue samples were isolated containing roughly equal proportions of white and grey matter from the temporal lobe. The tissue was homogenized in an ice cold sucrose buffer containing a protease inhibitor cocktail. The tissue was disrupted with seven strokes with a fitted Teflon pestle in a glass homogenization tube. Crude nuclear debris was cleared from the suspension by centrifugation at 1000g for 15 min. Total protein concentration was determined in the supernatant by the Bradford assay (Pierce Laboratories, Illinois). Samples were prepared for electrophoresis by adding 25% v/v loading buffer (Invitrogen, California) and 10% v/v beta-mercaptoethanol and heating at 95°C for 10 min. Fifteen micrograms of total protein were loaded into each lane of a 10% polyacrylamide gel and electrophoresed at 100 V in a MiniProtean Tetra System (BioRad Laboratories, California). The proteins were then transferred to a nitrocellulose membrane at 30 V for 4 h. The resulting blot was blocked in an albumin-based blocking buffer (Invitrogen) and probed with either mouse monoclonal β-actin (1 : 1000), rabbit monoclonal HO-1 (1 : 100), mouse monoclonal HO-2 (1 : 500), mouse monoclonal BLVD R A (1 : 200) or mouse monoclonal BLVD R B (1 : 200) antibodies (all from Abcam). After an overnight incubation at 4°C, the blots were thoroughly washed with TBS buffer containing 0.05% Tween-20 and a fluorescently labeled goat anti-mouse or rabbit secondary (IRDye, Licor) was applied. After 2-h incubation the blots were washed again and visualized on an Odyssey Infrared Imaging System (Licor Biosciences, Nebraska). Optical density was determined using Odyssey 2.0 software and data were collected as the relative intensity of the band of interest compared to the corresponding loading control band.
Clear native acrylamide electrophoresis was conducted to validate staining from the CS1 copper probe. Non-denaturing conditions were required to ensure proteins retained bound copper [32]. The homogenate was prepared as previously described except EDTA was omitted from the protease inhibitor cocktail to prevent metal chelation. To 500 μl of homogenate, 120 μl of 20% digitonin was added to solubilize the membrane components. Crude nuclear debris was then removed by centrifugation at 1000g. Finally, 20 μl of 50% glycerol and 0.1% Ponceau-S dye was added to the sample. Fifty micrograms of total protein were loaded into a gradient 4–13% acrylamide gel (prepared without SDS) and run on ice at 250 V overnight. Running buffer consisted of 50 mM Tris, and 7.5 mM imidazole; 0.05% deoxycholate and 0.05% Triton-X-100 were added to the cathode buffer.
The gel was probed with 2 mM CS1 solution for 10 min and copper-positive bands were detected by red fluorescence. Confirmation that fluorescent bands were in fact copper-positive was determined by incubating the gel with 1% BCS, a copper chelator, for 48 h and observing the reduction in fluorescence. Additionally, fluorescent bands were cut from the gel and analyzed for copper content as follows. The band of interest was carefully weighed and incubated with 600 μl concentrated nitric acid for 2 h. It was then heated to 80°C in a water bath for 10 min. The resulting sample was then analyzed by atomic absorption spectrometry as previously described.
All measurements are reported as mean ± standard deviation. Significance was assessed by the Students t test (two-tailed) with alpha of p = 0.05.
RESULTS
Twenty-two brain samples were obtained from the temporal lobes of elderly humans at autopsy. Cases included in the study were carefully chosen based upon their neuropathological findings. A group of cases with AD was assessed for the severity of vascular Aβ deposition. Eight cases demonstrating severe cerebral amyloid angiopathy were included in one group, eight with minimal to no cerebral amyloid angiopathy were included in another—all patients in both of these groups demonstrated severe parenchymal AD pathology. Additionally, six cases with no evident neuropathological abnormalities and matching age distribution were included as controls (Table 1). This study design was chosen to delineate pathologic changes associated with vascular degeneration from the effects of parenchymal AD pathology. The tissue was selected from the middle and superior temporal gyri, a region significant to AD, was preserved by flash freezing over liquid nitrogen at the time of autopsy, and was never exposed to fixative [33]. There was no significant difference in age between the groups.
The level of metals in the tissue was determined by atomic absorption spectrometry (Table 2). Total iron was measured because the majority of other measures of brain iron in AD reported in the literature have been performed by measuring total iron. However, because substantial blood remains trapped within the vasculature in this postmortem tissue, measurement of non-heme (chelatable) iron was considered a more-reliable measure of tissue iron content. Total iron was found to be significantly increased in the group with CAA, compared to the AD group without CAA, in white matter measurements (p = 0.036). Iron levels in the AD group without CAA were non-significantly lower than those in the control group. No significant differences were noted in the grey matter measurements between the groups. Non-heme iron measurements confirmed the significant increase in white matter iron in the CAA group compared to the AD-only group (p = 0.032). There was no difference in non-heme iron levels in the white matter between the AD-only group and the controls. In the grey matter, iron was again significantly increased in the group with CAA compared to the control group (p = 0.020) while the AD-only group was not significantly different from the controls. In the absence of vascular pathology, no alteration in brain iron content could be detected in AD brain compared to normal aged control brain.
Histologically, Prussian blue and Turnbull’s blue staining were used to determine the distribution of ferrous and ferric iron in these specimens. Turnbull’s blue preferentially reacts with divalent iron and brightly stained the walls of arterioles in the CAA group while this staining was absent from specimens from both of the other groups (Fig. 1). Prussian blue staining of ferric iron was not prominent and did not stain the vasculature in any group except in areas of obvious hemorrhage (not shown). To reinforce the hypothesis that iron deposition in AD is a result of microbleeding, we observed the levels of heme degradation enzymes (Fig. 2). The expression of several of these enzymes is inducible in the presence of extravascular heme and would therefore be expected to be elevated in the context of ongoing microbleeding. Two isoforms of HO are responsible for catalyzing the degradation of heme into biliverdin, carbon monoxide and free iron. HO-1 is the major inducible form, and HO-2 is generally constitutively expressed. HO-1 was significantly elevated in the group with CAA and was at comparable levels in both of the other groups. Histologically, this enzyme was found to be present in perivascular space in AD/CAA tissue, as well as occasional staining of senile plaques and neurofibrillary tangles in both AD groups (Fig. 3). HO-2 levels were not significantly different between groups. As HO is inducible by a variety of molecules, alterations in its levels are non-specific for microbleeding so we also studied the next enzymes in the heme degradation pathway, biliverdin reductases A and B. We found that while biliverdin reductase A levels were unchanged between groups, biliverdin reductase B levels were significantly increased in the CAA group over both the control and AD-only group, indeed more than three fold over the AD-only group. Histologically, little BLVD R B staining was observed in control and AD only tissue, but perivascular staining in AD/CAA cases was frequently observed and the staining extended into the parenchyma a considerable distance from the vessels.
Fig. 1.
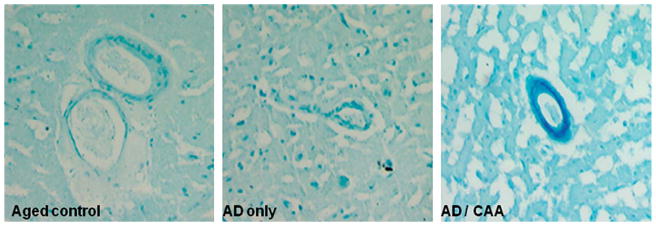
Iron is deposited on arterioles in cerebral amyloid angiopathic brain. Turnbull’s blue stain of control, AD brain without CAA and AD brain with CAA demonstrates deposition of ferrous iron in the wall of an arteriole affected by CAA.
Fig. 2.

Heme degradation enzymes are induced in cerebral amyloid angiopathic brain. Representative western blots for the major enzymes involved in heme degradation are shown at left above. One isoform each of heme oxygenase (HO-1) and biliverdin reductase (BLVD R B) are substantially elevated in tissue with severe CAA compared to both normal control tissue and AD tissue without CAA. There is no significant difference between AD without CAA and controls. These results support the hypothesis that increased iron in AD is primarily a result of microbleeding.
Fig. 3.
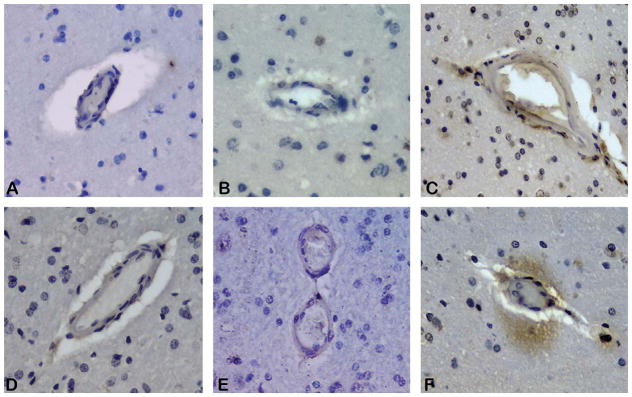
Heme degradation enzymes are increased on vessels and perivascular parenchyma in CAA brain. Immunohistochemistry of heme oxygenase 1 (HO-1) demonstrates perivascular staining is absent from control (image A) and AD only (B) cases, but present around arterioles affected by CAA (image C). Biliverdin reductase B (BLVD R B) immunoreactivity is similarly less prominent in control (D) and AD only cases (E) as compared to CAA affected tissue (F). Parenchymal reactivity for BLVD R B was observed around approximately half of CAA affected arterioles in the grey matter.
Zinc levels were also measured by atomic absorption spectrometry. No significant differences were noted among the groups in zinc measurements from the white matter. Both CAA and AD-only groups had significantly more zinc in the grey matter than the control group (p = 0.0035 and p = 0.019 respectively). Changes in zinc levels appear restricted to the grey matter. Histological analysis of zinc distribution with fluorescent probe ZP4 mirrored the findings of the atomic absorption with a moderate increase in staining of zinc in grey matter from the AD groups. No prominent labeling of the vasculature was noted in any of the groups(Fig. 4).
Fig. 4.
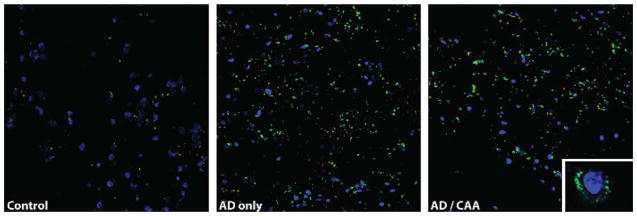
Increased non-synaptic zinc levels in grey matter in Alzheimer’s disease. Non-synaptic zinc was visualized using the green fluorescent ZP4 probe. Zinc is concentrated in the grey matter of both AD groups compared to normal control. Non-synaptic zinc is primarily distributed in a perinuclear pattern as shown in the inset of the image on the right. Zinc deposition on the vasculature was not prominent in any group.
Copper measurements by atomic absorption spectrometry demonstrated significant abnormalities. Both CAA and AD-only group had significantly lower levels of copper in the white matter than the controls (p = 0.023 and p = 0.031 respectively). Changes in the grey matter were even more dramatic with both the CAA and AD-only group again having less copper than the controls (p = 0.011 and p = 0.0069 respectively). To qualitatively assess the distribution of copper, we used a recently developed copper probe, copper sensor 1 or CS1 [29–31]. This probe is a BODIPY-conjugated turn-on probe whose fluorescent yield is reported to increase by tenfold upon binding to monovalent copper. Notably, the probe was reported to be selective for monovalent copper only. Because this probe had not been previously used in histological applications, we performed a number of control experiments to ensure that the fluorescent signal generated from this probe represented true copper binding (Fig. 5). Histological tissue sections were incubated with the CS1 probe, both with and without prior 48-h incubation of the gel with 1% BCS, a copper chelator. BCS copper chelation of the tissue section obliterated any red-fluorescent signal (Fig. 5A, B). We assessed the ability of the probe to detect protein-bound copper since virtually all copper in the brain is bound. To accomplish this, we electrophoresed brain protein homogenates under non-denaturing conditions (and without Coomassie dye which interferes with the fluorescent signal) and probed the resulting gel with CS1. Several bands were cut from the gel and analyzed by atomic absorption spectrometry, one band which was fluorescent contained considerably more copper that one that was not (Fig. 5C). To evaluate the selectivity of the probe for monovalent copper, we electrophoresed purified ceruloplasmin (Cp in Fig. 5C) which primarily binds divalent copper. A single band was found on Coomassie staining which was not fluorescent with CS1 staining, yet contained a relatively high level of copper. CS1 staining of tissue sections revealed discrete peri-nuclear puncta of intense red fluorescence in all three groups. This pattern of staining is consistent with the pattern of staining of key copper-binding proteins reported in other studies. Importantly, in the CAA group remarkable staining of the vasculature was observed in the grey matter. Both capillaries and arterioles were stained and the copper staining was noted to colocalize with the fluorescence from the thioflavin-S stain for Aβ. The CS1 probe did not strongly label thioflavin positive parenchymal Aβ plaques (although some minimal staining was seen).
Fig. 5.

Copper is concentrated in vascular elements in CAA. Images A and B show control brain cortex stained with CS1 probe; Image B was stained after the tissue was incubated in BCS, a selective copper chelator. BCS incubation reduces fluorescence from the CS1 probe, confirming that the bulk of the red signal is from copper binding. Image C shows a portion of a native protein electrophoresis of a brain homogenate. A band binding the CS1 probe was located. An adjacent protein band (determined by Coomassie staining) along with the positive band were analyzed by atomic absorption spectroscopy. The concentration of copper in the positive band was more than double that in the negative band. Additionally, purified ceruloplasmin (Cp in image C) which is known to bind divalent copper did not fluoresce upon CS1 incubation, confirming the valence selectivity of the probe. Images D, E, and F show CS1 and DAPI staining of control, AD only and AD with CAA brain, respectively; Monovalent copper is prominently deposited on vessels in the CAA case. Images G, H, I and J, K, L show thioflavin staining of amyloid-β (G and J) overlaid on CS1 stain for copper (H and K) in CAA-affected brain. Copper appears to strongly colocalize with thioflavin staining of amyloid-β in a CAA vessel, but only weakly in amyloid-β plaque.
Finally, because of historical interest in aluminum levels in AD brain, we also measured aluminum in these cases by atomic absorption spectroscopy. No significant difference was noted between groups, although the range of concentrations between cases was notably large.
DISCUSSION
The metabolism of iron in the brain and how it changes with aging has been studied in depth. Total iron levels increase throughout the brain with age under normal conditions, particularly in the putamen, reaching a relatively steady concentration by about the sixth decade of life [34, 35]. Elevated levels of tissue metals can cause neuronal injury through a number of mechanisms. Both iron and copper are redox active metals, capable of generating free-radicals as they cycle between valence states. Oxidative injury in the form of lipid peroxidation, protein crosslinking and DNA damage have been reported as early pathologic findings in the process of AD neurodegeneration, injuries which result from uncontrolled reactive oxygen species whose formation could be catalyzed by abnormal free iron or copper [36, 37]. Additionally, the Aβ plaques characteristic of AD have been described as a sort of “metals sink” because copper, zinc, and in particular iron, are thought to be concentrated at their cores which may serve as a tissue response to elevated levels of metals and/or oxidative stress in parenchymal tissues [20, 38]. While some Aβ plaques in human brain contain no more iron than normal brain tissue (one study found 30% had no detectable iron), some plaques have been shown to contain high concentrations of a reactive iron oxide, magnetite [39, 40]. Iron-binding appears to increase the toxicity of Aβ, when Aβ is incubated with a strong metal chelator prior to its application to neurons in vitro, its toxic effects are considerably ameliorated [41].
Pathologic accumulation of iron has been hypothesized to be a result of abnormal expression patterns of iron regulatory proteins (IRPs), the master regulators of brain iron [42]. The levels and activity of IRPs is directly affected by tissue iron levels and IRPs in turn alter the expression of numerous iron binding proteins, including storage molecules like ferritin, iron transport molecules like transferrin, transferrin-receptor, and divalent metal transporter 1, and certain key proteins related to AD, including amyloid-β protein precursor. IRPs bind to iron-response elements in untranslated regions (UTRs) of the effected genes, upregulating gene expression if they bind in a 5′ UTR, downregulating expression when binding is in a 3′ UTR [1, 43, 44]. Numerous studies have attempted to characterize various components of this system in AD. An early study found that while IRP1 did not change in AD brain, IRP2 levels were increased and associated with AD pathology. A subsequent study from our laboratory did not find any increase or change in distribution of IRP2 in mild, moderate or severe AD tissue compared to normal controls in either the frontal lobe or the hippocampus [14]. One final study reported that IRPs from AD cases were unable to interact with IREs, but this abnormality was observed in only two of six AD cases studied [45]. Ferritin levels are reportedly unchanged in AD compared to aged controls (although changes individual isoforms have been reported) [46–48]. Transferrin levels were reported to decrease in white matter underlying the motor cortex and in occipital white matter, but were unchanged in grey matter and temporal lobe white matter [46]. Another study found that transferrin levels were unchanged in the putamen, globus pallidus, caudate and substantia nigra, but were increased in frontal cortex [49]. Two studies have found that transferrin-receptor levels are decreased in AD hippocampus, while another study reports an increase in transferrin-receptors [50–52]. While these studies report varying findings, no consistent picture of a major alteration in this iron regulatory system has emerged; therefore we chose to assess whether abnormal deposition of iron through microbleeding may account for the qualitative increases reported by various investigators. Significant induction of portions of the heme degradation pathway had been reported in AD which could be consistent with a microhemorrhagic pathology [53–55].
The novel component of the design of this study is the stratification of AD cases by the degree of vascular Aβ pathology to determine whether the increased iron often reported in AD is associated with, or the result of, parenchymal or vascular pathology. CAA pathology in AD exists as a spectrum ranging from nearly undetectable in some cases to the predominant neuropathologic abnormality in others [24]. For this reason, the stratification employed here is somewhat arbitrary, but it may help to explain some of the contradictory findings related to iron metabolism previously reported by studies of human AD brain.
The current study, in the context of previous work, strongly supports the hypothesis that a significant portion of iron deposition in AD is linked to microvascular bleeding or leakage. Iron levels were only increased in the CAA group and this increase was found to be associated with vascular accumulation of ferrous iron (the expected valence state of iron released during heme degradation). Moreover, the heme degradation enzymes HO-1 and biliverdin reductase B were significantly elevated in the CAA group over both the normal controls and the non-CAA AD cases. Increases in HO-1 in AD have been previously well-documented, but the finding of increased biliverdin reductase B is a new observation and quite interesting [53]. This reductase, in addition to its role in heme degradation, functions as both a dual specificity serine/threonine/tyrosine kinase and a leucine zipper-type transcription factor which promotes the expression of HO-1 among other targets [56, 57]. These features hint at a more prominent role for this molecule in the pathologies of AD than has previously been appreciated. Curiously, in a recent prospective study peptide fragments of both HO-1 and biliverdin reductase B were shown to be elevated in serum of subjects with mild cognitive impairment who subsequently progressed to late-onset dementia in comparison to subjects with equally severe mild cognitive impairment who remained cognitively stable over time [58]. We have now shown that both enzymes are directly involved in vascular AD pathology – that they are detectable in peripheral blood samples makes them potentially valuable as biomarkers of AD. CAA-related microbleeding is additionally often detectable by susceptibility weighted MRI at early stages of cognitive impairment [15, 16]. Iron modulation has been considered as a potential therapy for AD, and although initial clinical trials have not shown an improvement (or slowing of decline) in cognitive performance, some clinical benefit was observed [59, 60]. Because these biomarkers are available, future clinical trials of iron chelating agents may consider treating the subset of dementia patients with evidence of cerebral microbleeding who may be more likely to benefit from chelation, rather than treating all patients with clinical dementia of the Alzheimer’s type.
The significance of zinc levels in the neocortex of brain affected by AD has been debated for decades. Several studies have shown an increase in zinc in AD neocortex [7, 13, 61, 62] while others have found no significant increase [11, 63] and two have found a decrease in zinc [8, 64]. Our result demonstrates that zinc is increased in AD only in grey matter. Previous studies have examined tissue samples that included both grey and white matter together, so discrepancies may be due to differences in tissue sampling. While a previous study convincingly showed that zinc was deposited on the vasculature in an animal model of CAA, our results suggest that alterations in zinc may not be strongly associated with vascular Aβ in human CAA [65].
Copper levels are generally reported to decrease in AD [14, 61]. One study reported an increase in copper in AD amygdala, but this finding is likely artifactual due to tissue fixation, which has been shown to increase apparent tissue copper levels in AD [26, 38]. Our results demonstrate a significant decrease in copper in both white and grey matter across both AD groups studied. Monovalent copper was also noted to be deposited on vascular elements affected by CAA using a novel fluorescent probe. Curiously, minimal staining of copper was noted in Aβ plaques in these studies which may suggest that copper associated with plaques is primarily in the divalent form. The perinuclear punctate staining pattern of monovalent copper was observed in specimens from all three groups of cases and likely represents an endoplasmic reticular and trans-Golgi distribution [66]. A similar pattern of staining has been observed for several key neuronal copper binding proteins including ATP7A, ATOX1, and Steap2 which are associated with these subcellular structures [67–69].
The CS1 probe has enabled initial histological analysis of monovalent copper in AD and will hopefully lead to future studies clarifying the neurobiology and neuropathology of brain copper. Additionally, redox-active iron and copper were found to be deposited in the arteriolar tree in CAA which may be one factor contributing to the vascular fragility observed in this condition. Finally, this study has demonstrated that increases in total neocortical iron levels are associated with severe CAA which may have implications for patient selection in future clinical trials of iron-chelating drugs.
Acknowledgments
This research was funded by the National Institutes of Health (AG20948). Harry V. Vinters is supported in part by P01 AG12435, P50 AG16570 and the Daljit S. and Elaine Sarkaria Chair in Diagnostic Medicine. Christopher J. Chang is an investigator with the Howard Hughes Medical Institute and is funded through the NIH (GM79465).
Footnotes
None of the authors report conflicts of interest related to this material.
Authors’ disclosures available online (http://www.j-alz.com/disclosures/view.php?id=680).
References
- 1.Avramovich-Tirosh Y, Amit T, Bar-Am O, Weinreb O, Youdim M. Physiological and pathological aspects of Abeta in iron homeostasis via 5′UTR in the APP mRNA and the therapeutic use of iron-chelators. BMC Neurosci. 2008;9(suppl):S2. doi: 10.1186/1471-2202-9-S2-S2. [DOI] [PMC free article] [PubMed] [Google Scholar]
- 2.Bush A, Tanzi R. Therapeutics for Alzheimer’s disease based on the metal hypothesis. Neurotherapeutics. 2008;5:421–432. doi: 10.1016/j.nurt.2008.05.001. [DOI] [PMC free article] [PubMed] [Google Scholar]
- 3.Huang X, Moir R, Tanzi R, Bush A, Rogers J. Redox-active metals, oxidative stress and Alzheimer’s disease pathology. Ann N Y Acad Sci. 2004;1012:153–163. doi: 10.1196/annals.1306.012. [DOI] [PubMed] [Google Scholar]
- 4.Molina-Holgado F, Gaeta H, Williams R, Francis P. Metals ions and neurodegeneration. Biometals. 2007;20:639–654. doi: 10.1007/s10534-006-9033-z. [DOI] [PubMed] [Google Scholar]
- 5.Hallgren B, Sourander P. The non-haemin iron in the cerebral cortex of Alzheimer’s disease. J Neurochem. 1960;5:307–310. doi: 10.1111/j.1471-4159.1960.tb13369.x. [DOI] [PubMed] [Google Scholar]
- 6.Plantin L, Lying-Tunell U, Kristensson K. Trace elements in the human central nervous system studied with neutron activation analysis. Biol Trace Elem Res. 1987;13:69–75. doi: 10.1007/BF02796622. [DOI] [PubMed] [Google Scholar]
- 7.Ward N, Mason J. Neutron activation analysis techniques for identifying elemental status in Alzheimer’s disease. J Radioanal Nucl Chem. 1987;113:515–526. [Google Scholar]
- 8.Corrigan FM, Reynolds GP, Ward NI. Reductions of zinc and selenium in brain in Alzheimer’s disease. Trace Elem Med. 1991;8:1–5. [Google Scholar]
- 9.Griffiths P, Crossman A. Distribution of iron in the basal ganglia and neocortex in postmortem tissue in Parkinson’s disease and Alzheimer’s disease. Dementia. 1993;4:61–65. doi: 10.1159/000107298. [DOI] [PubMed] [Google Scholar]
- 10.Stedman J, Spyrou N. Elemental analysis of the frontal lobe of “normal” brain tissue and that affected by Alzheimer’s disease. J Radioanal Nucl Chem. 1997;217:163–166. [Google Scholar]
- 11.Andrasi E, Farkas E, Gawlik D, Rosick U, Bratter P. Brain iron and zinc contents of German patients with Alzheimer’s disease. J Alzheimers Dis. 2000;2:17–26. doi: 10.3233/jad-2000-2103. [DOI] [PubMed] [Google Scholar]
- 12.Panayi A, Spyrou N, Part P. Differences in trace element concentrations between Alzheimer and “normal” human brain tissue using instrumental neutron activation analysis. J Radioanal Nucl Chem. 2001;249:437–441. [Google Scholar]
- 13.Religa D, Strozyk D, Cherny R, Volitakis I, Haroutunian V, Winblad B, Naslund J, Bush AI. Elevated cortical zinc in Alzheimer’s disease. Neurology. 2006;67:69–75. doi: 10.1212/01.wnl.0000223644.08653.b5. [DOI] [PubMed] [Google Scholar]
- 14.Magaki S, Raghavan R, Mueller C, Oberg K, Vinters HV, Kirsch WM. Iron, copper and iron regulatory protein 2 in Alzheimer’s disease and related dementia. Neurosci Lett. 2007;418:72–76. doi: 10.1016/j.neulet.2007.02.077. [DOI] [PMC free article] [PubMed] [Google Scholar]
- 15.Kirsch W, McAuley G, Holshouser B, Petersen F, Ayaz M, Vinters HV, Dickson C, Haacke EM, Britt W, Larsen J, Kim I, Mueller C, Schrag M, Kido D. Serial susceptibility weighted MRI measures brain iron and microbleeds in dementia. J Alzheimers Dis. 2009;17:599–609. doi: 10.3233/JAD-2009-1073. [DOI] [PMC free article] [PubMed] [Google Scholar]
- 16.Schrag M, McAuley G, Pomakian J, Jiffry A, Tung S, Mueller C, Vinters HV, Haacke EM, Holshouser B, Kido D, Kirsch WM. Correlation of hypointesities in susceptibility-weighted images to tissue histology in dementia patients with cerebral amyloid angiopathy: a post-mortem MRI study. Acta Neuropathol. 2010;119:291–302. doi: 10.1007/s00401-009-0615-z. [DOI] [PMC free article] [PubMed] [Google Scholar]
- 17.Jellinger K. Prevalence and impact of cerebrovascular lesions in Alzheimer’s and Lewy Body diseases. Neurodegener Dis. 2010;7:112–115. doi: 10.1159/000285518. [DOI] [PubMed] [Google Scholar]
- 18.Vinters HV. Cerebral amyloid angiopathy: a critical review. Stroke. 1987;18:311–326. doi: 10.1161/01.str.18.2.311. [DOI] [PubMed] [Google Scholar]
- 19.Vinters HV, Wang Z, Secor D. Brain parenchymal and microvascular amyloid in Alzheimer’s disease. Brain Pathol. 1996;6:179–195. doi: 10.1111/j.1750-3639.1996.tb00799.x. [DOI] [PubMed] [Google Scholar]
- 20.Goodman L. Alzheimer’s disease; a clinico-pathologic analysis of 23 cases with a theory on pathogenesis. J Nerv Ment Dis. 1953;118:97–130. [PubMed] [Google Scholar]
- 21.Cullen K, Kocsi Z, Stone J. Pericappillary haem-rich deposits: evidence for microhemorrhages in aging human cerebral cortex. J Cereb Blood Flow Metab. 2005;25:1656–1667. doi: 10.1038/sj.jcbfm.9600155. [DOI] [PubMed] [Google Scholar]
- 22.Cullen K, Kocsi Z, Stone J. Microvascular pathology in the aging human brain: evidence that senile plaques are sites of microhemorrhages. Neurobiol Aging. 2006;27:1786–1796. doi: 10.1016/j.neurobiolaging.2005.10.016. [DOI] [PubMed] [Google Scholar]
- 23.Braak H, Braak E. Neuropathological stageing of Alzheimer-related changes. Acta Neuropathol. 1991;82:239–259. doi: 10.1007/BF00308809. [DOI] [PubMed] [Google Scholar]
- 24.Greenberg S, Vonsattel JP. Diagnosis of cerebral amy-loid angiopathy. Stroke. 1997;28:1418–1422. doi: 10.1161/01.str.28.7.1418. [DOI] [PubMed] [Google Scholar]
- 25.Vinters HV, Vonsattel JP. Neuropathologic features and grading of Alzheimer-related and sporadic CAA. In: Verbeek MM, de Wall RMW, Vinters HV, editors. Cerebral amyloid angiopathy in Alzheimer’s Disease and Related Disorders. Kluwer Academic; Dordrecht, The Netherlands: 2000. pp. 137–155. [Google Scholar]
- 26.Schrag M, Dickson A, Jiffry A, Kirsch D, Vinters HV, Kirsch WM. The effect of formalin fixation on the levels of brain transition metals in archived samples. BioMetals. 2010;23:1123–1127. doi: 10.1007/s10534-010-9359-4. [DOI] [PMC free article] [PubMed] [Google Scholar]
- 27.Smith MA, Harris P, Sayre L, Perry G. Iron accumulation in Alzheimer disease is a source of redox-generated free radicals. Proc Natl Acad Sci U S A. 1997;94:9866–9868. doi: 10.1073/pnas.94.18.9866. [DOI] [PMC free article] [PubMed] [Google Scholar]
- 28.Okon EE. Cytophotometric determination of non-heme iron in hepatocytes. II. Effect of fixation on the cell iron content. Tsitologiia. 1998;40:520–523. [PubMed] [Google Scholar]
- 29.Miller E, Zeng L, Domaille D, Chang C. Preparation and use of coppersensor-1, a synthetic fluorophore for Live-cell copper imaging. Nat Protoc. 2006;1:824–827. doi: 10.1038/nprot.2006.140. [DOI] [PubMed] [Google Scholar]
- 30.Zeng L, Miller E, Pralle A, Isacoff E, Chang CJ. A selective turn-on fluorescent sensor for imaging copper in living cells. J Am Chem Soc. 2006;128:10–11. doi: 10.1021/ja055064u. [DOI] [PMC free article] [PubMed] [Google Scholar]
- 31.Domaille D, Que E, Chang CJ. Synthetic fluorescent sensors for studying the cell biology of metals. Nature Chem Biol. 2008;4:168–175. doi: 10.1038/nchembio.69. [DOI] [PubMed] [Google Scholar]
- 32.Finney L, Chishti Y, Khare T, Giometti C, Levina A, Lay PA, Vogt S. Imaging metals in proteins by combining electrophoresis with rapid X-ray fluorescence mapping. ACS Chem Biol. 2010;5:577–587. doi: 10.1021/cb1000263. [DOI] [PubMed] [Google Scholar]
- 33.Burton E, Barber R, Mukaetova-Ladinska E, Robson J, Perry R, Jaros E, Kalaria R, O’Brien J. Medial temporal lobe atrophy on MRI differentiates Alzheimer’s disease from dementia with Lewy bodies and vascular cognitive impairment: a prospective study with pathological verification of diagnosis. Brain. 2009;132:195–203. doi: 10.1093/brain/awn298. [DOI] [PubMed] [Google Scholar]
- 34.Hallgren B, Sourander P. The effect of age on the non-haemin iron in the human brain. J Neurochem. 1958;3:41–51. doi: 10.1111/j.1471-4159.1958.tb12607.x. [DOI] [PubMed] [Google Scholar]
- 35.Markesbery W. Brain trace elements concentrations in aging. Neurobiol Aging. 1984;5:19–28. doi: 10.1016/0197-4580(84)90081-2. [DOI] [PubMed] [Google Scholar]
- 36.Smith DG, Cappai R, Barnham KJ. The redox chemistry of the Alzheimer’s disease amyloid beta peptide. Biochim Biophys Acta. 2007;1768:1976–1990. doi: 10.1016/j.bbamem.2007.02.002. [DOI] [PubMed] [Google Scholar]
- 37.Markesbery W. The role of oxidative stress in Alzheimer disease. Arch Neurol. 1999;56:1449–1452. doi: 10.1001/archneur.56.12.1449. [DOI] [PubMed] [Google Scholar]
- 38.Lovell M, Robertson J, Teesdale W, Campbell J, Markesbery W. Copper, iron and zinc in Alzheimer’s disease senile plaques. J Neurol Sci. 1998;158:47–52. doi: 10.1016/s0022-510x(98)00092-6. [DOI] [PubMed] [Google Scholar]
- 39.Dhenain M, Privat N, Duyckaerts C, Jacob R. Senile plaques do not induce susceptibility effects in T2*-weighted MR microscopic images. NMR Biomed. 2002;15:197–203. doi: 10.1002/nbm.760. [DOI] [PubMed] [Google Scholar]
- 40.Collingwood J, Chong R, Kasama T, Cervera-Gontard L, Dunin-Borkowski RE, Perry G, Posfai M, Siedlak SL, Simpson ET, Smith MA, Dobson J. Three-dimensional tomographic imaging and characterization of iron compounds within Alzheimer’s plaque core material. J Alzheimers Dis. 2008;14:235–245. doi: 10.3233/jad-2008-14211. [DOI] [PubMed] [Google Scholar]
- 41.Rottkamp C, Raina A, Zhu X, Gaier E, Bush AI, Atwood CS, Chevion M, Perry G, Smith MA. Redox-active iron mediates amyloid-beta toxicity. Free Radic Biol Med. 2001;30:447–450. doi: 10.1016/s0891-5849(00)00494-9. [DOI] [PubMed] [Google Scholar]
- 42.Smith MA, Wehr K, Harris P, Siedlak S, Connor JR, Perry G. Abnormal localization of iron regulatory protein in Alzheimer’s disease. Brain Res. 1998;788:232–236. doi: 10.1016/s0006-8993(98)00002-x. [DOI] [PubMed] [Google Scholar]
- 43.Leipuviene R, Theil E. The family of iron responsive RNA structures regulated by changes in cellular iron and oxygen. Cell Mol Life Sci. 2007;64:2945–2955. doi: 10.1007/s00018-007-7198-4. [DOI] [PMC free article] [PubMed] [Google Scholar]
- 44.Rogers JT, Bush AI, Cho HH, Smith DH, Thomson AM, Friedlich AL, Lahiri DK, Leddman PJ, Huang X, Cahill CH. Iron and the translation of the amyloid precursor protein (APP) and ferritin mRNAs: riboregulation against neurol oxidative damage in Alzheimer’s disease. Biochem Soc Trans. 2008;36 (Pt6):1282–1287. doi: 10.1042/BST0361282. [DOI] [PMC free article] [PubMed] [Google Scholar]
- 45.Pinero DJ, Hu J, Connor JR. Alterations in the interaction between iron regulatory proteins and their responsive element in normal and Alzheimer’s diseased brains. Cell Mol Biol. 2000;46:761–776. [PubMed] [Google Scholar]
- 46.Connor JR, Snyder BS, Beard J, Fine R, Mufson E. Regional distribution of iron and iron-regulatory proteins in the brain in aging and Alzheimer’s disease. J Neurosci Res. 1992;31 :327–335. doi: 10.1002/jnr.490310214. [DOI] [PubMed] [Google Scholar]
- 47.Connor JR, Snyder BS, Arosio P, Loeffler DA, LeWitt P. A quantitative analysis of isoferritins in select regions of aged, parkinsonian and Alzheimer’s diseased brains. J Neurochem. 1995;65:717–724. doi: 10.1046/j.1471-4159.1995.65020717.x. [DOI] [PubMed] [Google Scholar]
- 48.Dedman DJ, Treffry A, Candy JM, Taylor GA, Morris CM, Bloxham CA, Perry RH, Edwardson JA, Harrison PM. Iron and aluminum in relation to brain ferritin in normal individuals and Alzheimer’s disease and chronic renal dialysios patients. Biochem J. 1992;287:509–514. doi: 10.1042/bj2870509. [DOI] [PMC free article] [PubMed] [Google Scholar]
- 49.Loeffler D, Connor J, Juneau P, Snyder B, Kanaley L, DeMaggio A, Nguyen H, Brickman B, LeWitt P. Trans-ferrin and iron in normal, Alzheimer’s disease and Parkinson’s disease brain regions. J Neurochem. 1995;65:710–716. doi: 10.1046/j.1471-4159.1995.65020710.x. [DOI] [PubMed] [Google Scholar]
- 50.Kalaria RN, Kroon SN. Transferrin receptors of rat and human brain and cerebral microvessels and their status in Alzheimer’s disease. Brain Res. 1992;585:87–93. doi: 10.1016/0006-8993(92)91193-i. [DOI] [PubMed] [Google Scholar]
- 51.Morris CM, Candy JM, Kerwin JM, Edwardson JA. Transferrin receptors in the normal human hippocampus and in Alzheimer’s disease. Neuropathol Appl Neurobiol. 1994;20:473–477. doi: 10.1111/j.1365-2990.1994.tb00998.x. [DOI] [PubMed] [Google Scholar]
- 52.Jefferies WA, Food MR, Gabathuler R, Rothenberger S, Yamada O, McGeer PL. Reactive microglia specifically associated with amyloid plaques in Alzheimer’s disease brain tissue express melanotransferrin. Brain Res. 1996;712:122–126. doi: 10.1016/0006-8993(95)01407-1. [DOI] [PubMed] [Google Scholar]
- 53.Schipper HM, Cisse S, Stopa EG. Expression of heme oxygenase-1 in the senescent and Alzheimer’s diseased brain. Ann Neurol. 1995;37:758–768. doi: 10.1002/ana.410370609. [DOI] [PubMed] [Google Scholar]
- 54.Schipper HM, Song W, Zukor H, Hascalovici JR, Zeligman D. Heme oxygenase-1 and neurodegeneration; expanding frontiers of engagement. J Neurochem. 2009;110:469–485. doi: 10.1111/j.1471-4159.2009.06160.x. [DOI] [PubMed] [Google Scholar]
- 55.Zukor H, Song W, Liberman A, Mui J, Vali H, Fillebeen C, Pantopoulos K, Wu TD, Guerquin-Kern JL, Schipper HM. HO-1 mediated macroautophagy: a mechanism for unregulated iron deposition in aging and degenerating neural tissues. J Neurochem. 2009;109:776–791. doi: 10.1111/j.1471-4159.2009.06007.x. [DOI] [PubMed] [Google Scholar]
- 56.Lerner-Marmarosh N, Shen J, Torno M, Kravets A, Hu Z, Maines M. Human biliverdin reductase: a member of the insulin receptor substrate family with serine/threonine/tyrosine kinase activity. Proc Natl Acad Sci U S A. 2005;102:7109–7114. doi: 10.1073/pnas.0502173102. [DOI] [PMC free article] [PubMed] [Google Scholar]
- 57.Florczyk U, Jozkowicz A, Dulak J. Biliverdin reductase: new features of an old enzyme and its potential therapeutic significance. Pharm Reports. 2008;60:38–48. [PMC free article] [PubMed] [Google Scholar]
- 58.Mueller C, Zhou W, VanMeter A, Heiby M, Magaki S, Ross M, Espina V, Schrag M, Dickson C, Liotta L, Kirsch W. The heme degradation pathway is a promising serum biomarker source for the early detection of Alzheimer’s disease. J Alzheimers Dis. 2010;19:1081–1091. doi: 10.3233/JAD-2010-1303. [DOI] [PMC free article] [PubMed] [Google Scholar]
- 59.Crapper McLachlan DR, Dalton AJ, Kruck TP, Bell MY, Smith WL, Kalow W, Andrews DF. Intramusclar des-ferrioxamine in patients with Alzheimer’s disease. Lancet. 1991;337:1304–1308. doi: 10.1016/0140-6736(91)92978-b. [DOI] [PubMed] [Google Scholar]
- 60.Lannfelt L, Blennow K, Zetterberg H, Batsman S, Ames D, Harrison J, Masters CL, Targum S, Bush AI, Murdoch R, Wilson J, Ritchie CW PBT2-201-EURO Study Group. Safety, efficacy and biomarker findings of PBT2 in targeting Abeta as a modifying therapy for Alzheimer’s disease; a phase IIa, double blind randomized placebo controlled trial. Lancet Neurol. 2008;7:779–786. doi: 10.1016/S1474-4422(08)70167-4. [DOI] [PubMed] [Google Scholar]
- 61.Deibel M, Ehmann W, Markesbery W. Copper, iron and zinc imbalances in severely degenerated brain regions in Alzheimer’s disease: possible relation to oxidative stress. J Neurol Sci. 1996;143:137–142. doi: 10.1016/s0022-510x(96)00203-1. [DOI] [PubMed] [Google Scholar]
- 62.Cornett C, Markesbery W, Ehmann W. Imbalances of trace elements related to oxidative damage in Alzheimer’s disease brain. Neurotoxicology. 1998;19:339–345. [PubMed] [Google Scholar]
- 63.Panayi A, Spyrou N, Iverson B, White M, Part P. Determination of cadmium and zinc in Alzheimer’s brain tissue using inductively coupled plasma mass spectrometry. J Neurol Sci. 2002;195:1–10. doi: 10.1016/s0022-510x(01)00672-4. [DOI] [PubMed] [Google Scholar]
- 64.Corrigan FM, Reynolds GP, Ward NI. Hippocampal tin, aluminum and zinc in Alzheimer’s disease. Biometals. 1993;6:149–154. doi: 10.1007/BF00205853. [DOI] [PubMed] [Google Scholar]
- 65.Friedlich A, Lee J, van Groen T, Cherny RA, Volitakis I, Cole TB, Palmiter RD, Koh JY, Bush AI. Neuronal zinc exchange with the blood vessel wall promotes cerebral amyloid angiopathy in an animal model of Alzheimer’s disease. J Neurosci. 2004;24:3453–3459. doi: 10.1523/JNEUROSCI.0297-04.2004. [DOI] [PMC free article] [PubMed] [Google Scholar]
- 66.Yang L, McRae R, Henary MM, Patel T, Lai B, Vogt S, Fahrni CJ. Imaging of the intracellular topography of copper with a fluorescent sensor and by synchrotron x-ray fluorescence microscopy. Proc Natl Acad Sci U S A. 2005;102:11179–11184. doi: 10.1073/pnas.0406547102. [DOI] [PMC free article] [PubMed] [Google Scholar]
- 67.Tokuda E, Okawa E, Ono S. Dysregulation of intra-cellular copper trafficking pathway in a mouse model of mutant copper/zinc superoxide dismutase-linked familial amyotrophic lateral sclerosis. J Neurochem. 2009;111:181–91. doi: 10.1111/j.1471-4159.2009.06310.x. [DOI] [PubMed] [Google Scholar]
- 68.El Meskini R, Crabtree KL, Cline LB, Mains RE, Eipper BA, Ronnett GV. ATP7A (Menkes protein) functions in axonal targeting and synaptogenesis. Mol Cell Neurosci. 2007;34:409–421. doi: 10.1016/j.mcn.2006.11.018. [DOI] [PMC free article] [PubMed] [Google Scholar]
- 69.Prohaska J, Gybina A. Intracellular copper transport in mammals. J Nutrition. 2004;134:1003–1006. doi: 10.1093/jn/134.5.1003. [DOI] [PubMed] [Google Scholar]