Abstract
Purpose
To evaluate optimal contrast kinetics thresholds for measuring functional tumor volume (FTV) by breast magnetic resonance imaging (MRI) for assessment of recurrence-free survival (RFS).
Materials and Methods
In this Institutional Review Board (IRB)-approved retrospective study of 64 patients (ages 29–72, median age of 48.6) undergoing neoadjuvant chemotherapy (NACT) for breast cancer, all patients underwent pre-MRI1 and postchemotherapy MRI4 of the breast. Tumor was defined as voxels meeting thresholds for early percent enhancement (PEthresh) and early-to-late signal enhancement ratio (SERthresh); and FTV (PEthresh, SERthresh) by summing all voxels meeting threshold criteria and minimum connectivity requirements. Ranges of PEthresh from 50% to 220% and SERthresh from 0.0 to 2.0 were evaluated. A Cox proportional hazard model determined associations between change in FTV over treatment and RFS at different PE and SER thresholds.
Results
The plot of hazard ratios for change in FTV from MRI1 to MRI4 showed a broad peak with the maximum hazard ratio and highest significance occurring at PE threshold of 70% and SER threshold of 1.0 (hazard ratio = 8.71, 95% confidence interval 2.86–25.5, P < 0.00015), indicating optimal model fit.
Conclusion
Enhancement thresholds affect the ability of MRI tumor volume to predict RFS. The value is robust over a wide range of thresholds, supporting the use of FTV as a biomarker.
Keywords: SER/PE thresholds, MRI breast functional tumor volume, neoadjuvant chemotherapy
SYSTEMIC CHEMOTHERAPY for locally advanced breast cancer has become the mainstay of treatment because of its correlation with improved survival and reduced overall morbidity (1). Although preoperative, neoadjuvant, compared to postoperative chemotherapy does not result in a survival benefit, it does confer the advantage of increasing the possibility for breast-conserving surgery (2). Neoadjuvant chemotherapy (NACT) provides the further advantage of allowing the primary tumor response to be monitored during treatment. Multiple clinical trials have demonstrated that the response of the primary tumor to NACT correlates with patient survival (3–5), suggesting that tumor response may be an important prognostic indicator. Tumor response is most accurately determined by assessing the presence or stratifying the degree of residual cancer that remains in the breast at the completion of neoadjuvant therapy and at the time of definitive surgical resection (6).
Several noninvasive methods for assessing response to NACT have been evaluated, including clinical exam, mammography, and ultrasound. In the past, clinical exam was most commonly used to assess response during NACT. However, in recent decades primary breast tumor response to NACT has been shown to be more accurately assessed by dynamic contrast-enhanced magnetic resonance imaging (DCE-MRI) as compared with clinical exam, mammography, or ultrasound (7,8). MRI measurements have been strongly correlated with the standard of reference of histologic response (8). Only a moderate correlation between clinical exam, mammography, and ultras2ound has been shown with pathologic measurements of tumor after surgical resection (9). Limited literature has been published on sonography alone in assessing response to NACT; however, a recent study showed a lack of correlation of both sonographic 3D and unidimensional measurements of tumor with pathologic outcome (10). PET (positron emission tomography) has also been evaluated in the evaluation of response to neoadjuvant therapy, with changes in size, vascularity, and tumor metabolism highly correlated between 18F-FDG-PET (fluorodeoxyglucose-PET) and DCE-MRI (11). In addition, it has been demonstrated that changes in PET values in patients with locally advanced breast cancer is associated with outcome, with lack of decrease in SUV (standardized uptake value), the measurement of radiotracer uptake in patient’s tumors compared to background, from baseline to mid-treatment carrying an elevated mortality risk (12).
One technique that has been shown to accurately characterize functional tumor volume (FTV) uses quantitative breast MRI parameters, the signal enhancement ratio (SER) and percent enhancement (PE), that both can be measured from standard clinical breast MR images. Multiple studies have evaluated MRI as a marker of response, using predefined criteria as imaging predictors. A previous study published by our group (13) used a specific PE threshold of 70% to define tumor volume and found that when MRI was compared to clinical breast examination, tumor size at pathology, and number of positive lymph nodes, MRI tumor volume was the stronger predictor of recurrence-free survival (RFS). More recent work by Yi et al (14) in patients receiving NACT determined that smaller reduction in tumor size and smaller reduction in washout kinetics over the course of treatment was associated with worse RFS and overall survival. However, the group did not evaluate the effects of varying thresholds in their evaluation. Similarly, Heldahl et al (15) found that total enhancing volume as measured on pre-treatment MRIs in 32 patients undergoing NACT was associated with survival. However, percent enhancement thresholds were not varied in their study.
The specific aim of our study was to evaluate how enhancement thresholds influence the performance of functional volumetric tumor measurements and to determine the optimal PE and SER thresholds for predicting recurrence-free survival (RFS) in patients with breast cancer undergoing NACT, for whom 6–10 years of survival data was available. RFS was used as the endpoint to determine if patients had relapsed during the study period.
MATERIALS AND METHODS
Subject Enrollment
Approval for the study was granted by the Institutional Review Board (IRB) and informed consent was obtained from all participants. This study was a retrospective analysis of 68 women undergoing NACT between 1995 and 2002 at our institution for stage II or III locally advanced, biopsy-proven invasive breast cancer, diagnosed by a combination of physical exam findings, mammography, and/or ultrasound. Patients were included in the study if their tumors had not spread beyond the affected breast and regional lymph nodes and if they underwent subsequent surgery following chemotherapy. The preoperative chemotherapy regimen for all patients consisted of four cycles of doxorubicin and cyclophosphamide given every 3 weeks, followed by 12 weekly cycles of taxane in 12 of the 64 patients. Taxane was used in the group of 12 patients because during the time period the study was performed taxane became part of the standard of care. The adjuvant therapies the patients received was not monitored; however, the study time period largely preceded the use of Herceptin. The patients from our group’s previous study were part of our study population (12).
MR Image Acquisition
Patients were scheduled for up to four MRI exams during the study: prior to treatment (MRI1), after the first cycle of chemotherapy (MRI2), inter-regimen (MRI3, taxane receivers only), and at the completion of chemotherapy prior to surgery (MRI4). For this study we only analyzed the pretreatment and presurgery exams, MRI1 and MRI4. MRI4 was used rather than MRI2 as it was most representative of complete neoadjuvant treatment and provided the most clinically applicable analysis.
Breast MRI was performed on a 1.5 T field strength scanner (GE Healthcare, Milwaukee, WI) using a bilateral phased array breast coil. Prior to image acquisition, patients received intravenous catheters, inserted in the antecubital vein or hand, and were placed in the prone position. The MRI protocol included a localizer sequence and a dynamic contrast-enhanced (DCE) sequence consisting of one precontrast and two postcontrast acquisitions using a high spatial resolution, low temporal resolution T1-weighted pulse sequence developed for presurgical staging. For the DCE sequence, unilateral sagittal images of the affected breast were obtained using a fat-suppressed 3D fast gradient-recalled echo sequence with high spatial resolution (0.7 * 0.94 * 2.0 mm3). Imaging parameters consisted of: TR = 8 msec and TE = 4.2 msec, flip angle 20°, 18–20 cm field of view, acquisition matrix 256 × 192 × 60, and section thickness of 2 mm. Imaging time was ~5 minutes per acquisition, resulting in early and late postcontrast times of ~2.5 minutes and 7.5 minutes, respectively. Temporal sampling of the DCE method used in this study preceded the current ACR requirements for accreditation (16). For this study, a scan time of 5 minutes was used, with the scan and injection started simultaneously. Contrast injection was performed over 30 seconds using a power injector and injecting contrast agent over 15 seconds followed by a saline flush over 15 seconds. There was no patient motion during acquisition in our subset. Using standard k-space ordering, the resulting early temporal sampling occurred at 2 minutes. The contrast agent, gadopentate dimeglumine, was administered at a dose of 0.1 mmol per kg of body weight. Fat suppression was used to distinguish enhancing lesions from bright fat signal on the T1-weighted DCE images and was performed using a frequency-selective inversion recovery preparatory pulse to eliminate the fat signal.
Image Analysis and Tumor Volume Calculation
Images were analyzed to measure FTV using an in-house semiautomated software algorithm (17) and implemented in the IDL programming environment (ITT Visual information Solutions, Boulder, CO). For each study, a 3D volume of interest (VOI) fully enclosing all tissue enhancing above surrounding normal breast parenchyma was manually defined by a trained research associate by placing rectangular regions of interest (ROIS) on orthogonal maximum intensity projection (MIP) images created from the first postcontrast DCE scan. An example is demonstrated in Fig. 1. Intersection of the two projected ROIs was used to define the VOI. When necessary, obviously noncancerous regions of enhancement intruding on the VOI, such as vessels or the heart, were eliminated using a manually drawn irregular ROI. All succeeding steps in the analysis were fully automated.
Figure 1.
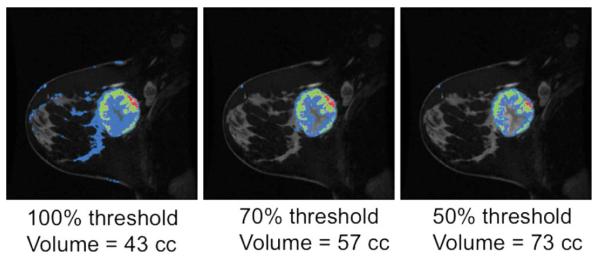
Example of quantification method and tumor volume measurements based on varying threshold.
The SER, a combined enhancement/washout measure, was calculated at each voxel from precontrast injection (S0), early postcontrast (SE), and late postcontrast (SL) images (Fig. 2). Tumor vascularity was characterized by the early percent enhancement, defined by PEearly = 100*(SE – S0)/(SL – S0) and reflecting contrast uptake in the tissue and SER, defined as the ratio of the early enhancement to the late enhancement, PEearly/PElate. A high value of SER is indicative of tissue with a strong washout characteristic.
Figure 2.
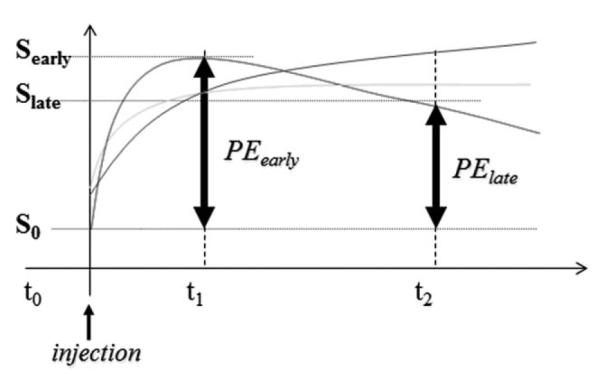
Diagrammatic representation of SER and PE calculations.
FTV was then calculated based on SER and PE maps with appropriate thresholds and filtering. A minimum early enhancement threshold, PEthresh, was applied to the PE map followed by a connectivity test to eliminate very small regions, to create a final enhancing tissue mask. SER was calculated for all voxels in the mask for each value of PEthresh. The FTV (PEthresh, SERthresh), was then calculated as the volume of all voxels for each PEthresh that exceeded a given SER value, SERthresh. For this optimization study, we investigated ranges of PEthresh from 50% to 220% in steps of 10% and SERthresh from 0.0 to 2.0 in steps of 0.2. This analysis was performed for the percent change in FTV between the pretreatment and presurgery MRI exam.
Clinical Evaluation and Assessment of Recurrence
RFS was assessed for each patient based on clinical examination and mammographic imaging at 6-month or 1-year intervals following surgery and recurrence categorized as local or distant. The length of RFS was defined as the time from initial surgery to local or distant recurrence or the time to last follow-up in patients without evidence of recurrence.
Statistical Analysis
Cox proportional hazard models were fitted based on the data from every combination of PE and SER threshold to determine the association of FTV measures with RFS. The predictor variable evaluated was percent change in FTV over treatment (Δ FTV). Hazard ratios per unit change of the predictor (1% change in Δ FTV), hazard ratio confidence intervals, and associated P-values were evaluated.
RESULTS
Patient Characteristics and RFS
Sixty-four patients met the inclusion criteria for the study. Of the initial 68 patients, four patients were excluded from the final analysis; two patients were excluded because they did not undergo surgery, one was excluded because of suboptimal MR images, and the fourth patient did not undergo a postneoadjuvant treatment MRI. Demographic and disease characteristics of the patient population are shown in Table 1. Mean age was 48.6 years (range 29–72). The median longest diameter for initial tumor size was 5.7 cm (1.1–11.0 cm). Patients with smaller tumors (<3.0 cm) had positive nodes and were considered eligible for neoadjuvant chemotherapy.
Table 1.
Demographic and Clinical Characteristics of Patient Population
| Parameter | Number of patients (%), n = 64 |
|---|---|
| Age at diagnosis | |
| Range 29–72, median 48.6 | |
| <50 | 37 (58) |
| Age 50 or above | 27 (42) |
| Longest diameter of initial tumor | |
| Range 1.1–11.0 cm, median 5.7 cm | |
| Histologic type | |
| IDC | 41 (64) |
| ILC | 12 (19) |
| Mucinous | 2 (3) |
| Mixed | 4 (6) |
| Inflammatory | 1 (2) |
| Adenocarcinoma NOS | 4 (6) |
| Relative size reduction after chemotherapy* | |
| Complete response | 10 (16) |
| Stable disease | 13 (20) |
| Partial response | 28 (44) |
| Progressive disease | 2 (0.3) |
| Surgery | |
| Mastectomy | 34 (53) |
| Lumpectomy | 30 (47) |
| Pathologic grade after surgery | |
| No residual disease | 7 (11) |
| Less than 1.0 cm disease | 5 (8) |
| 1.0–2.5 cm disease | 19 (30) |
| Greater than 2.5 cm disease | 33 (52) |
| Nodal status | |
| Positive | 42 (66) |
| Negative | 22 (34) |
| Recurrence | n = 25 |
| Local | 8 (32) |
| Metastatic | 17 (68) |
| Median time to recurrence = 110 weeks(n = 25) | |
| Median RFS time = 349 weeks(n = 39) |
Eleven patients not evaluated by physical exam after NACT. RFS, recurrence-free survival time.
Ten of the 64 patients (16%) had complete response with no evidence of disease on physical exam following treatment and before surgery, 28 (44%) had partial response, 13 (20%) had stable disease, and two (0.3%) had progressive disease. The remaining 11 patients were not evaluated by physical exam following NACT. Thirty-four patients (53%) underwent mastectomy and 30 (47%) underwent lumpectomy. The majority of patients (41/64) had invasive ductal carcinoma.
Based on pathology review at our institution following surgery, 7/64 (11%) patients had no residual disease, 5/64 (8%) had less than 1 cm of disease, 19/64 (30%) had between 1.0–2.5 cm of residual disease, and 33/64 (52%) had greater than 2.5 cm of residual disease in the affected breast (18). Forty-two patients (66%) had lymph node involvement on pathology. Of the 25 patients with recurrence, 17 (68%) had metastasis and 8 (32%) had locally recurrent disease.
The RFS curve is depicted in Fig. 3. Twenty-five patients recurred with median time to recurrence of 110 weeks (2.1 years). Thirty-nine patients did not recur and median RFS time in this group was 349 weeks (6.7 years).
Figure 3.
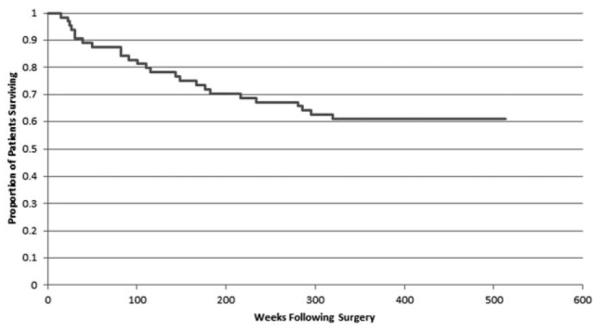
Recurrence-free survival. Graph demonstrating RFS in weeks.
Optimization of PE and SER Thresholds Over the Course of Treatment
In assessing PE and SER thresholds for percent change in FTV over treatment, the P-value for the proportional hazards model fit was found to be highly significant (P <0.01) for all PE thresholds of 60%–130% and SER thresholds of less than 1.0 (Fig. 4), supporting the ability of FTV measurement by MRI for predicting RFS. The highest hazards ratios were seen at PE thresholds of 60%–110%, SER thresholds 0.0–1.0, with hazards ratios dropping sharply towards 1.0 at higher thresholds. Figure 5 shows the plot of hazards ratios for a 100% change in the percent change in FTV from the pretreatment MRI1 to the postneoadjuvant MRI4, illustrating this broad peak in the region of high significance. The maximum hazard ratio (8.71, 95% confidence interval [CI] 2.86–25.5, P < 0.00015) is reached at a PE threshold of 70% and SER threshold of 1.0. The 100% change in percent change in FTV was chosen as it was representative of the difference between complete and nonresponders to treatment. However, because of the large change in FTV chosen, the proportional hazards ratio is also unusually high. To evaluate whether the model was sound, the Schoenfeld test was performed and was not statistically significant for any departure from proportionality, P = 0.27, indicating that the proportionality assumption is not violated. When the data was evaluated for typical changes expected during treatment, that is 10% change in percent change in FTV, the estimated hazard ratio is 1.243 with 95% CI (1.112-1.389).
Figure 4.
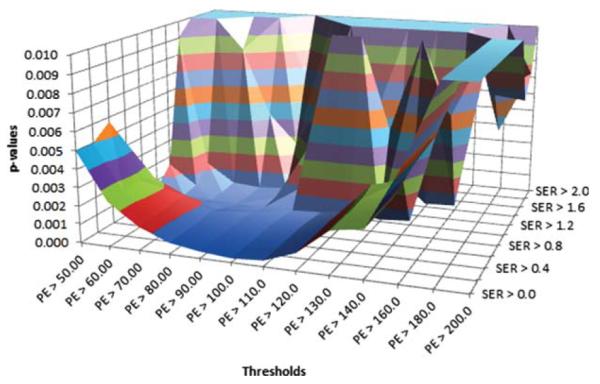
P-values for percent change in FTV over treatment. P-values for model fit are depicted for combined PE (x-axis) and SER (z-axis) thresholds.
Figure 5.
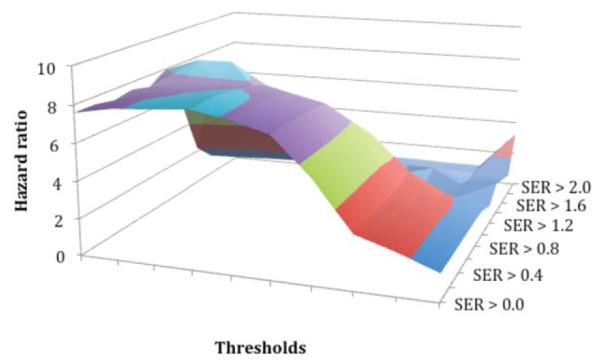
Hazard ratios for percent change in FTV over treatment. Hazard ratios are shown for combined PE (x-axis) and SER (z-axis) thresholds per unit change in percent change in FTV between the pretreatment MRI and presurgery MRI.
As demonstrated in Figs. 4 and 5, at higher PE and SER thresholds of 110% and 1.2, respectively, there are specious peaks due to the very small volume changes over treatment for one patient yielding large percent changes. When this patient was excluded from the analysis (graph not shown), the spurious peaks disappear while the primary results remain unchanged, indicating that the optimal threshold process is robust to outlying observations of this type.
DISCUSSION
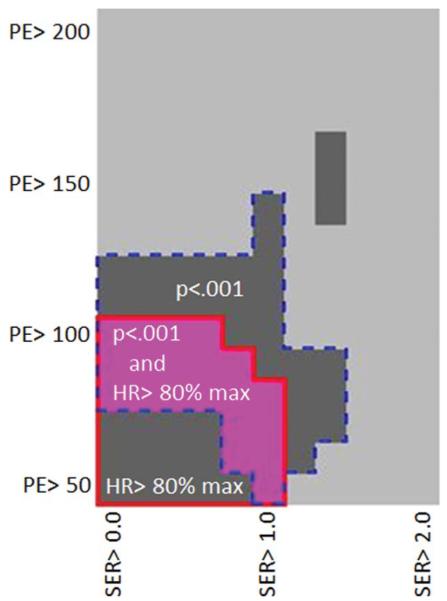
We found a peak in hazard ratio for functional tumor volume change over treatment at a PE threshold of 70% and an optimal range of thresholds of 60%–100% (Fig. 6). The best model fit and highest hazard ratio for predicting RFS occurred at a PE threshold of 70% combined with an SER threshold of ~1.0.
Figure 6.
2D plot demonstrating the optimal PE and SER thresholds. The pink area demonstrates the threshold ranges with the highest hazard ratios (HR >80% of maximum) and most significant P-values (P < 0.001). Of note, there is narrower range of SER (~0.8–1.0) that can be used at a wide range of lower PE thresholds (~60%–80%), which resulted in the highest hazard ratios.
MRI has been shown to be useful in evaluating breast cancer after NACT both clinically and prognostically. The ACRIN-6657 trial demonstrated the utility of MRI tumor volume measurements in prediction of pathologic outcomes, response, and residual cancer burden in the neoadjuvant setting (19). We have previously shown that the change in FTV as measured by MRI over the course of treatment is associated with RFS. Specifically, RFS was used in our study to capture the endpoint of relapse rather than overall survival, which includes death from all causes. In addition, overall survival data were not available for all patients. Previous work involving quantitative MRI parameters has set PE thresholds at 70%–80% (13) and used an SER measure of greater than 0.9 to distinguish between malignant and benign tissue, based on empirically determined levels established largely on the basis of visual inspection.
Based on using P-values as a metric, we determined that the PE cutoff for malignant tissue affects the RFS prediction value of MRI tumor volume measurements, with the optimal threshold depending on the parameter measured.
Variable methods of assessing tumor response by imaging have been used including uni- and bidimensional measurements, with the RECIST (Response Evaluation Criteria In Solid Tumors) criteria based on unidimensional measurements of a tumor’s longest diameter (20). In the multicenter ACRIN-6657 trial of assessing tumor response to NACT, FTV as measured by DCE-MRI was found to have greater sensitivity than linear measurements for capturing the early changes that predict treatment response (19). Previous work had shown that change in MRI 3D tumor volume, calculated by automated segmentation of MR images during NACT, was predictive of patient survival (13), which may be due to more accurate characterization of lesion extent compared with linear measurements, especially in cases of irregular tumor morphology or infiltrative disease (13). Multiple investigations have supported these data and expanded upon these findings to show that FTV as measured by high spatial resolution breast MRI can be used to accurately identify patients at high risk of recurrence (21), predict final clinical and pathologic outcome (22), and risk-stratify patients into responders and nonresponders (23).
In clinical practice, percent enhancement thresholds ranging from 50%–100% are used to distinguish benign from malignant tissue in initial patient evaluation (24). Varying PE thresholds based on the pathologic type of tumor may also be valuable, given the different enhancement patterns in DCIS versus invasive lesions (25). In the neoadjuvant setting, where clinical decisions of which treatment regimen to use can be highly influenced by MRI findings, threshold settings that aid in determining survival become important. Interestingly, the main findings from the I-SPY 1 TRIAL correlating molecular markers and RFS demonstrated that pathologic complete response was significantly correlated with RFS, but that prediction significantly improves with inclusion of tumor receptor subtypes. These findings suggest that there may be an opportunity for further improvement by optimizing MR volume thresholds by receptor subtypes.
Study Limitations
A limitation of our study is the small number of patients in our sample population and the disease heterogeneity in the group. Although the majority of patients had invasive ductal carcinoma, several patients had mixed tumor types for which identifying a 3D VOI of enhancing tissue added some operator dependence to our semiautomated method. Another limitation is the nature of our referral patient population, which may add a selection bias, in that our patients may have more aggressive disease, influencing our evaluation of RFS. Adjuvant therapies that the patients received was not monitored and although the study largely preceded the use of Herceptin, this may have influenced our results. In addition, we investigated only a single DCE scan timing, and it is expected that optimized threshold values will vary with different timings due to enhancement kinetics. The technique that was used in our study involved data acquired prior to the ACR recommended scan times for DCE-MRI (16). However, the three timepoint high spatial resolution technique we used allowed evaluation of SER measures which have been shown to be monotonically related to the pharmacokinetic parameter, kep (26), that is conventionally used with higher temporal methods. We are currently using shorter scan times and will continue to investigate the role of temporal resolution. Finally, the retrospective nature of our work is a major limitation.
In conclusion, the results of our study demonstrate that MRI FTV measurements over the course of neoadjuvant treatment are associated with recurrence-free survival in patients with locally advanced breast cancer. Our findings validate the PE threshold of 70% used in prior studies and that was prospectively tested in the ACRIN-6657 breast MRI trial (19). Combined with other prognostic factors, use of quantitative MRI parameters may provide insight into disease outcome and, in turn, influence treatment regimens. Future work will involve larger cohorts of patients and evaluation by receptor subtype.
Acknowledgments
Contract grant sponsor: National Cancer Institute (NCI) at the National Institutes of Health; Contract grant numbers: R01 CA 069587, R01 CA 132870.
REFERENCES
- 1.Hortobagyi GN. Progress in systemic chemotherapy of primary breast cancer: an overview. J Natl Cancer Inst Monogr. 2001:72–79. doi: 10.1093/oxfordjournals.jncimonographs.a003465. [DOI] [PubMed] [Google Scholar]
- 2.Wolmark N, Wang J, Mamounas E, Bryant J, Fisher B. Preoperative chemotherapy in patients with operable breast cancer: nine-year results from National Surgical Adjuvant Breast and Bowel Project B-18. J Natl Cancer Inst Monogr. 2001;30:96–102. doi: 10.1093/oxfordjournals.jncimonographs.a003469. [DOI] [PubMed] [Google Scholar]
- 3.Kuerer HM, Newman LA, Smith TL, et al. Clinical course of breast cancer patients with complete pathologic primary tumor and axillary lymph node response to doxorubicin-based neoadjuvant chemotherapy. J Clin Oncol. 1999;17:460–469. doi: 10.1200/JCO.1999.17.2.460. [DOI] [PubMed] [Google Scholar]
- 4.Fisher B, Bryant J, Wolmark N, et al. Effect of preoperative chemotherapy on the outcome of women with operable breast cancer. J Clin Oncol. 1998;16:2672–2685. doi: 10.1200/JCO.1998.16.8.2672. [DOI] [PubMed] [Google Scholar]
- 5.Bonadonna G, Valagussa P, Brambilla C, et al. Primary chemotherapy in operable breast cancer: eight-year experience at the Milan Cancer Institute. J Clin Oncol. 1998;16:93–100. doi: 10.1200/JCO.1998.16.1.93. [DOI] [PubMed] [Google Scholar]
- 6.Symmans WF, Peintinger F, Hatzis C, et al. Measurement of residual breast cancer burden to predict survival after neoadjuvant chemotherapy. J Clin Oncol. 2007;25:4414–4422. doi: 10.1200/JCO.2007.10.6823. [DOI] [PubMed] [Google Scholar]
- 7.Shin HJ, Kim HH, Ahn JH, et al. Comparison of mammography, sonography, MRI and clinical examination in patients with locally advanced or inflammatory breast cancer who underwent neoadjuvant chemotherapy. Br J Radiol. 2011;84:612–620. doi: 10.1259/bjr/74430952. [DOI] [PMC free article] [PubMed] [Google Scholar]
- 8.Esserman L, Hylton N, Yassa L, Barclay J, Frankel S, Sickles E. Utility of magnetic resonance imaging in the management of breast cancer: evidence for improved preoperative staging. J Clin Oncol. 1999;17:110–119. doi: 10.1200/JCO.1999.17.1.110. [DOI] [PubMed] [Google Scholar]
- 9.Chagpar AB, Middleton LP, Sahin AA, et al. Accuracy of physical examination, ultrasonography, and mammography in predicting residual pathologic tumor size in patients treated with neoadjuvant chemotherapy. Ann Surg. 2006;243:257–264. doi: 10.1097/01.sla.0000197714.14318.6f. [DOI] [PMC free article] [PubMed] [Google Scholar]
- 10.Gounaris I, Provenzano E, Vallier AL, et al. Accuracy of unidimensional and volumetric ultrasound measurements in predicting good pathological response to neoadjuvant chemotherapy in breast cancer patients. Breast Cancer Res Treat. 2011;127:459–469. doi: 10.1007/s10549-011-1454-x. [DOI] [PubMed] [Google Scholar]
- 11.Partridge SC, Vanantwerp RK, Doot RK, et al. Association between serial dynamic contrast-enhanced MRI and dynamic 18F-FDG PET measures in patients undergoing neoadjucant chemotherapy for locally advanced breast cancer. J Magn Reson Imaging. 2010;32:1124–1131. doi: 10.1002/jmri.22362. [DOI] [PMC free article] [PubMed] [Google Scholar]
- 12.Dunnwald LK, Gralow JR, Ellis GK, et al. Tumor metabolism and blood flow changes by positron emission tomography: relation to survival in patients treated with neoadjuvant chemotherapy for locally advanced breast cancer. J Clin Oncol. 2008;26:4449–4457. doi: 10.1200/JCO.2007.15.4385. [DOI] [PMC free article] [PubMed] [Google Scholar]
- 13.Partridge SC, Gibbs JE, Lu Y, et al. MRI measurements of breast tumor volume predict response to neoadjuvant chemotherapy and recurrence-free survival. AJR Am J Roentgenol. 2005;184:1774–1781. doi: 10.2214/ajr.184.6.01841774. [DOI] [PubMed] [Google Scholar]
- 14.Yi A, Cho N, Im S, et al. Survival outcomes of breast cancer patients who receive neoadjuvant chemotherapy: association with dynamic contrast-enhanced MR imaging with computer-aided evaluation. Radiology. 2013 doi: 10.1148/radiol.13121801. [Epub ahead of print] [DOI] [PubMed] [Google Scholar]
- 15.Heldahl MG, Bathen TF, Rydland J, et al. Prognostic value of pre-treatment dynamic contrast-enhanced MR imaging in breast cancer patients receiving neoadjuvant chemotherapy: overall survival predicted from combined time course and volume. Acta Radiol. 2010;51:604–612. doi: 10.3109/02841851003782059. [DOI] [PubMed] [Google Scholar]
- 16.ACR Breast Magnetic Resonance Imaging (MRI) Accreditation Program Requirements [Accessed February 12, 2013];2011 http://www.acr.org/~/media/ACR/Documents/Accreditation/BreastMRI/Requirements.
- 17.Partridge SC, Heumann EJ, Hylton NM. Semi-automated analysis for MRI of breast tumors. Stud Health Technol Inform. 1999;62:259–260. [PubMed] [Google Scholar]
- 18.Sahoo S, Lester SC. Pathology of breast carcinomas after neoadjuvant chemotherapy: an overview with recommendations on specimen processing and reporting. Arch Pathol Lab Med. 2009;133:633–642. doi: 10.5858/133.4.633. [DOI] [PubMed] [Google Scholar]
- 19.Hylton NM, Blume JD, Bernreuter WK, et al. Locally advanced breast cancer: MR imaging for prediction of response to neoadjuvant chemotherapy—results from ACRIN 6657/I-SPY trial. Radiology. 2012;263:663–672. doi: 10.1148/radiol.12110748. [DOI] [PMC free article] [PubMed] [Google Scholar]
- 20.Therasse P, Arbuck SG, Eisenhauer EA, et al. New guidelines to evaluate the response to treatment in solid tumors. European Organization for Research and Treatment of Cancer, National Cancer Institute of the United States, National Cancer Institute of Canada. J Natl Cancer Inst. 2000;92:205–216. doi: 10.1093/jnci/92.3.205. [DOI] [PubMed] [Google Scholar]
- 21.Li KL, Partridge SC, Joe BN, et al. Invasive breast cancer: predicting disease recurrence by using high-spatial-resolution signal enhancement ratio imaging. Radiology. 2008;248:79–87. doi: 10.1148/radiol.2481070846. [DOI] [PMC free article] [PubMed] [Google Scholar]
- 22.Ah-See ML, Makris A, Taylor NJ, et al. Early changes in functional dynamic magnetic resonance imaging predict for pathologic response to neoadjuvant chemotherapy in primary breast cancer. Clin Cancer Res. 2008;14:6580–6589. doi: 10.1158/1078-0432.CCR-07-4310. [DOI] [PubMed] [Google Scholar]
- 23.Pickles MD, Lowry M, Manton DJ, et al. Role of dynamic contrast enhanced MRI in monitoring early response of locally advanced breast cancer to neoadjuvant chemotherapy. Breast Cancer Res Treat. 2005;91:1–10. doi: 10.1007/s10549-004-5819-2. [DOI] [PubMed] [Google Scholar]
- 24.Wang LC, DeMartini WB, Partridge SC, et al. MRI-detected suspicious breast lesions: predictive values of kinetic features measured by computer-aided evaluation. AJR Am J Roentgenol. 2009;193:826–831. doi: 10.2214/AJR.08.1335. [DOI] [PubMed] [Google Scholar]
- 25.Partridge SC, Gibbs JE, Lu Y, et al. Accuracy of MR imaging for revealing residual breast cancer in patients who have undergone neoadjuvant chemotherapy. AJR Am J Roentgenol. 2002;179:1193–1199. doi: 10.2214/ajr.179.5.1791193. [DOI] [PubMed] [Google Scholar]
- 26.Li KL, Henry RG, Wilmes LJ, et al. Kinetic assessment of breast tumors using high spatial resolution signal enhancement ratio (SER) imaging. Magn Reson Med. 2007;58:572–581. doi: 10.1002/mrm.21361. [DOI] [PMC free article] [PubMed] [Google Scholar]


