

Abstract
Objective:
The aim of this study was to investigate trajectories of sleep quality and associations with mood in the perinatal period. Although it is commonly accepted that subjective sleep quality declines during pregnancy and the transition to parenthood, some women may follow qualitatively distinct trajectories.
Design, Setting, and Participants:
Sleep quality was assessed by the Pittsburgh Sleep Quality Index (PSQI). Data were collected from 293 women at four time points: during early pregnancy, at Time 1 (T1; < 22 w gestational age [GA]; late pregnancy, at Time 2 (T2; 32 w GA); during the postnatal period at Time 3 (T3; 3 mo postpartum); and Time 4 (T4; 6 mo postpartum). A group-based semiparametric mixture model was used to estimate patterns of sleep quality throughout the perinatal period.
Results:
Four trajectory groups were identified, including patterns defined by high sleep quality throughout (21.5%), mild decrease in sleep quality (59.5%), significant decrease in sleep quality (12.3%) and a group with poor sleep quality throughout (6.7%). Women who had the worst sleep quality at Time 1 and those who experienced significant increases in sleep problems throughout pregnancy were also the groups who reported the highest levels of anxiety and depressive symptoms in early pregnancy and the lowest levels of social support. After controlling for covariates, the groups with worst subjective sleep quality during pregnancy were also the most likely to experience high symptoms of depression in the postpartum period.
Conclusions:
Most of the women in our sample reported mild sleep disturbances through the perinatal period. A subgroup of women reported a significant decline in sleep quality from early to late pregnancy and another reported poor subjective sleep quality throughout pregnancy; these groups had the greatest risk of experiencing high symptoms of depression in the postpartum period.
Citation:
Tomfohr LM, Buliga E, Letourneau NL, Campbell TS, Giesbrecht GF. Trajectories of sleep quality and associations with mood during the perinatal period. SLEEP 2015;38(8):1237–1245.
Keywords: depression, postpartum, pregnancy, sleep, trajectories
INTRODUCTION
Worsening sleep quality and increasing sleep disturbances are well-documented complaints in the perinatal period, (e.g., during pregnancy and as long as 1 y postpartum).1–4 As pregnancy progresses, sleep quality decreases in many pregnant women and the percentage of women defined as poor sleepers (using the Pittsburgh Sleep Quality Index [PSQI] cutoff of 5) increases significantly.5,6 In the postpartum period, sleep problems often persist, peaking during the first postpartum month and remaining elevated, especially among first-time mothers.7–9 Disrupted sleep in pregnancy has been linked to negative obstetric outcomes, including preterm labor, longer labor, and increased risk of cesarean delivery.10 Maternal sleep patterns in pregnancy may also entrain infant sleep patterns, such that disrupted maternal sleep in pregnancy is associated with worse infant sleep, which can in turn lead to disrupted maternal postpartum sleep.11,12
Sleep and Depression
Emerging sleep problems have been shown to herald new episodes and relapses of major depressive disorder across multiple populations.13 Disturbed sleep has been associated with the emergence of new depressive symptoms in pregnancy such that sleep disturbances in early pregnancy predict depressive symptoms in late pregnancy, even after adjusting for baseline symptoms of depression.14 Sleep disturbances in late pregnancy assessed both objectively (i.e., actigraphy) and subjectively have also been shown to independently predict symptoms of post-partum depression.15 However, findings in this area have not been entirely consistent. In a study of pregnant, first-time mothers, sleep problems in late pregnancy were not associated with the emergence of postpartum depression (PPD).16 Paradoxically, in a group of women with a history of PPD followed from late pregnancy to 28 w postdelivery, lower PSQI scores (indicative of better sleep) in late pregnancy were predictive of increased risk for recurrence of PPD within 4 w of delivery.17 Following the same participants in the postpartum period, poor sleep quality in the postpartum period, as assessed by the PSQI, was associated with recurrence of PPD.18 Further muddying the waters, some researchers have failed to detect associations between sleep and depression in pregnancy.19,20 In a study of more than 2,000 women followed from 32 w of pregnancy to 8 w postpartum, there was no association between symptoms of insomnia and increases in symptoms of depression.20 Taken together, research into the relationship between sleep and depression in the perinatal period is unclear and there have been calls for greater exploration of factors that may influence the sleep and depression relationship.19
Trajectories of Sleep Quality in the Perinatal Period
The majority of sleep research in the perinatal period has focused on changes in mean sleep quality over time.6–8,21 This approach assumes that all women, or at least a majority, experience the same pattern of changes in sleep and runs the risk of obscuring potentially meaningful individual differences. Rather than assuming the same trajectory of sleep quality over the perinatal period, it may be advantageous to identify specific subgroups of women for whom changes in sleep quality follow distinct trajectories. Identifying women who are at high risk for experiencing perinatal sleep problems could aid in developing targeted treatment strategies and more nuanced explanatory frameworks related to perinatal sleep quality. Potentially, exploring specific trajectories of sleep in the perinatal period could also help shed light on the relationship between sleep disturbances and depression.
Discriminating Among Sleep Quality Trajectory Groups
If there are distinct sleep trajectory subgroups in the perinatal period, then it is important to differentiate the baseline characteristics that identify them, in order to assist in targeting and developing appropriate interventions. A number of factors could potentially predict changes in subjective sleep quality during the perinatal period. Among them, symptoms of depression and anxiety may be of particular importance. Depressive symptoms are highly comorbid with insomnia, and women suffering from depression in pregnancy also report significantly elevated sleep disturbances.11,22,23 Anxiety symptoms, which are highly comorbid with depression, have also been shown to explain a significant amount of variance in self-reported sleep disturbances.24,25 In contrast, there is a long history of research demonstrating the beneficial effects of social support in pregnancy and the postpartum period,26–28 suggesting that social support may serve a protective function with regard to sleep outcomes in the perinatal period. Finally, indices of socioeconomic status (SES) such as education and income have been linked to sleep quality outside of the perinatal period,29 such that lower SES is associated with worse subjective and objective sleep outcomes. This relationship has been recently replicated in pregnant women.30
Study Aims
The aims of this study were threefold. The first aim was to determine if decreases in subjective sleep quality during pregnancy characterize the majority of pregnant women, or if there are subgroups of women who experience unique sleep trajectories. We hypothesized that there would be identifiable subgroups of sleep quality trajectories over the course of pregnancy and the postpartum period.
The second aim was to examine how well symptoms of depression and anxiety, social support and SES, all assessed in early pregnancy, discriminate among sleep trajectory groups. We hypothesized that subgroups characterized by declining sleep quality would report baseline symptoms of depression and anxiety that were higher than the group average and social support that was lower than the group average.
The third aim was to determine if sleep trajectories were associated with significant changes in symptoms of depression over the course of the study. We hypothesized that women who experienced the greatest increases in sleep problems would be most likely to experience high depressive symptoms in the postpartum period.
METHOD
Participants
A subsample of 293 pregnant women who were enrolled in an ongoing longitudinal study of mental health and nutrition during pregnancy (see http://www.apronstudy.ca for further details) were recruited for and participated in this study. Women were excluded from the longitudinal study if they were younger than 16 y, > 27 w gestation, were unable to answer questions in English, or planned on moving. Women were excluded from the sub study if they self-reported any of the following: (1) taking a steroid medication; (2) smoking; (3) consuming alcohol or ‘street’ drugs; (4) known pregnancy or fetal complications (e.g., preeclampsia, fetal genetic anomalies), or (5) illness during data collection (e.g., fever)—these exclusionary criteria were based on collection of biomarkers not reported here. Gestational age (GA) at each assessment was determined based on last reported menstrual period and confirmed by at least one ultrasound. Prior to data collection, participants provided informed consent to the procedures. Questionnaires were mailed to participants prior to scheduled laboratory visits and either returned at those visits or by mail. The study procedures were approved by the University of Calgary Conjoint Health Research Ethics Board.
At initial data collection, womens' average age was 30.9 y (standard deviation [SD] = 3.79) and 21.9% had graduate school education, 47.7% of participants had completed a university degree, 19.4% received a trade or technical certificate, and 11% completed high school education or less. More than half of participants (54.8%) reported an annual household income of $100,000 (Canadian) or more, 24.4% reported an annual income between $70,000 and $99,999, 12% reported an annual income between $40,000 and $69,999 and 8.8% of participants reported an annual income of less than $40,000. In the sample, 79.6% identified as Caucasian, 11.7 % as Asian, 3.9% as Latin American, and 4.8% as other ethnic groups such as Black, Jamaican, Arab, and Filipino. Approximately 98% of the sample reported being married or cohabitating. Half of the sample (50.2%) reported being pregnant with their first child, 36.9% percent were pregnant with their second child, and 12.9% were pregnant for the third or more time.
Procedures
At four separate time points, participants completed questionnaires that assessed subjective sleep quality, symptoms of depression and perceived quality of social support. Questionnaires were completed during pregnancy, at T1 (< 22 w GA; mean GA = 15.04, SD = 3.55), and T2 (32 w GA; mean GA = 32.44, SD = 0.99), and during the postnatal period at T3 (3 mo postpartum; mean infant age, weeks = 12.7, SD = 1.4) and T4 (6 mo postpartum; mean infant age = 25.2, SD = 2.6).
Measures
Pittsburgh Sleep Quality Index
Subjective sleep quality was assessed using the 19-item self-administered PSQI. The PSQI assesses seven components of sleep: subjective sleep quality, sleep latency, sleep duration, habitual sleep efficiency, sleep disturbances, use of sleeping medication, and daytime dysfunction. Summing each sub-scale creates a global PSQI score. Scores range from 0 to 21, with higher scores indicating lower sleep quality and a more severe sleep disturbance.5 The total PSQI has demonstrated good psychometric properties in pregnancy.22 In our study, the PSQI Cronbach αs were T1 = 0.70, T2 = 0.70, T3 = 0.69, and T4 = 0.69, respectively, which are considered acceptable.31
Edinburgh Postnatal Depression Scale (EPDS)
Symptoms of depression were assessed using the 10-item, self-report EPDS.32,33 Items were rated on a four-point scale to produce a summative score ranging from 0 to 30, with higher scores indicating more depressive symptoms. The EPDS has been validated against interview schedules and other self-report instruments.34 Created to counter the limitations of other well-established depression scales in the perinatal period, the EPDS has been validated by standardized psychiatric interviews with large samples and has well-documented reliability and validity both in the prenatal and postnatal periods.35 In our study, the EPDS Cronbach α was good, T1 = 0.79, T2 = 0.78, T3 = 0.78, and T4 = 0.79, respectively.31
The EPDS includes one sleep question. We were concerned that including this sleep item may artificially inflate the associations between the EPDS and sleep trajectory groups; therefore, we removed the sleep item from the EPDS prior to testing Aim 2 (associations between sleep trajectory group and baseline depressive symptoms). For the purposes of Aim 3, we retained all questions on the EPDS in order to assign women to the category of “high” or “low” depressive symptoms based on an established cutoff of 12.36,37
Social Support Effectiveness (SSE)
This is defined as a 35-item measure of perceived emotional, informational, task, and negative support received over the previous 3 mo. The SSE can be used to assess support received from a romantic or non-romantic partner. Women in this study who reported being in a romantic relationship (98%) were asked to complete the questionnaire with regard to their romantic partner. Participants who reported that they were not in a romantic relationship (n = 6) were asked to answer all the questions in reference to the person they turn to most often for support. Within each domain, women were asked to rate: (1) how well the quantity of support received from her partner matched the amount she wanted; (2) whether she wished the support had differed somehow; (3) how skilled her partner was at providing support; (4) how often it was difficult to solicit support; and (5) if her partner offered support without being asked. Ten items assess negative support, or the extent to which a respondent perceived her partner's support as negatively infringing on her own efficacy/self-esteem. Total scores of the scale can range from 0 to 80, with higher scores indicating more effective support. Internal consistency of the SSE is strong (Cronbach α = 0.87) and it has previously been used to distinguish levels of social support in samples of pregnant women.38,39
Pregnancy -Related Anxiety
This 10-item instrument was used to examine the extent to which women were worried about their own and baby's health, labor, delivery, and caring for a new baby. Items were rated on a scale ranging from 1 (never or not at all) to 4 (a lot of the time or very much). This scale has good internal reliability (Cronbach α = 0.81).39,40
Statistical Analyses
Missing data patterns were explored using a logistic regression approach, which consisted of creating a “Missingness” indicator variable, such that data (e.g., PSQI global score) was coded “0” if not missing and “1” if missing at a particular time point. A new binary variable indicating “Previous Measurement” was also created, describing the existence or not of data on the variable of interest on a previous data collection time point. A binary logistic regression model was fitted with the “Missingness” indicator as the outcome and “Previous Measurement” as the predictor. The rationale for the analysis was to determine whether the probability of a measurement being missing depended on the values already observed. If “previous measurement” was not significant in the logistic regression, then the missing data were considered “Missing Completely at Random” (MCAR).41
To address the first aim of the study, we used semipara-metric group-based mixed modeling.42 Models were estimated using SAS ProcTraj Version 9.2 (SAS Institute, Inc, Cary, NC).43 Semiparametric group-based mixed modeling assumes that the population is composed of groups with different trajectories and seeks to identify those groups as they change over time.42 Using semiparametric group-based mixed modeling, the optimal shape of the trajectory, number of groups, and proportion of the sample belonging to each group are identified.42 Although individual trajectories may not perfectly overlap with the group trajectory, individuals are classified into identified patterns of change and are assumed to follow approximately the same course as other individuals in their group.44,45 In our analyses, parameters defining the shape of the trajectory were left free to vary across groups, and these coefficients were then used to calculate each individual's probability of group membership (posterior probability). Models were estimated with intercept, linear, quadratic, and cubic coefficients, which were removed if analyses indicate they were not significant for particular groups. Cubic coefficients were removed for all analyses. The SAS ProcTraj procedure handles missing data using a maximum likelihood algorithm, which uses all available data. To determine the number of groups that best fit the data, we evaluated models with varying numbers of groups. Fit was determined using the Bayesian Information Criterion (BIC). BIC scores with greater (less negative) values indicate a better fit. A priori, we established that we would choose the number of groups, at which the BIC value was the largest, provided that the smallest groups consisted of at least 6% of the entire sample. We based this criterion on work using similarly sized samples.44,46 Individuals were assigned to the trajectory group with which their posterior probability was greatest.42 Models for aims two and three were analyzed using SPSS Version 20 (SPSS Inc., Chicago, Illinois). To address the second aim of the study, we assessed baseline differences between trajectory groups using one-way analysis of variance with psychosocial (symptoms of depression, pregnancy-related anxiety, and social support effectiveness) and demographics (age, parity) as the outcome variables. Nonparametric data (income and education) were analyzed by using the Kruskal-Wallis test statistic. In order to better understand group differences on baseline variables, significant tests were followed by multiple comparisons between the four groups.47
Finally, to address the third aim of the study, we investigated if sleep trajectory group was associated with an increase in depressive symptoms in the postpartum period. To test this question, we categorized women as experiencing either high depressive symptoms (defined as a score of ≥ 12 on the EPDS) or as low depressive symptoms (score of < 12 on the EPDS) in pregnancy and the postpartum period.33,37 Participants were included in the analysis if they had completed at least one assessment of depressive symptoms during pregnancy and one assessment in the postpartum (n = 274). Using logistic regression, we examined if sleep trajectory group was associated with high depressive symptoms in the postpartum period, controlling for covariates that differed between sleep trajectory groups (e.g., pregnancy-related anxiety, and SSE) and those that are established predictors of postpartum depression (e.g., depression in pregnancy, income, age, and parity).48
RESULTS
Analysis of Missing Data
Missing data for the PSQI at each time point was T1 = 2.4%, T2 = 14.7%, T3 = 17.4%, and T4 = 11.6%. The probability of missing PSQI data was not dependent on previous PSQI scores (P = 0.64). For the EPDS, missing data at each time point were T1 = 2.4%, T2 = 8.9%, T3 = 9.9%, and T4 = 15.7%. Similarly, the probability of missing EPDS data was not dependent on previous EPDS scores (P = 0.39). We concluded that data were MCAR and estimated trajectories using all available observations.
Identifying Sleep Trajectory Groups
First, we estimated models with one trajectory group to identify the common trajectory of PSQI scores across time. As expected, our results suggested the PSQI scores increased over the course of pregnancy, indicating a small but statistically significant increase in sleep problems among the entire group of participants. We then calculated BIC values for two groups to determine if a multitrajectory approach provided a better fit to the data. The BIC values increased from one-group (BIC = −2,599.98) to two-group (BIC = −2,502.26) models, indicating that the two-group trajectory provided a better fit to the data. We increased group number until the best fit was achieved. The BIC values increased from three groups (BIC = −2,498.41) to four groups (BIC = −2,492.52). In the four-group model, the smallest group size remained greater than 6% for each of the models estimated. The BIC values decreased for the five-group model (BIC = −2,504.12), indicating that the four-group model provided a better fit for the data.
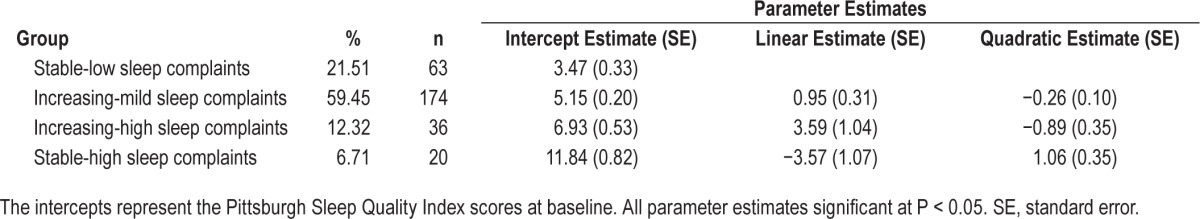
The final model consisted of four trajectory groups (see Figure 1). Table 1 shows parameter estimates and observed trajectories for the four-group model. The first group of women (“stable-low sleep complaints”) had PSQI scores that started low and remained stable over the course of the study. Among the groups with increases in the PSQI, the second group of women (“increasing-mild sleep complaints”) began with somewhat elevated PSQI scores (mean = 5.15 which is just above the PSQI cutoff score of 5) that increased slightly as pregnancy progressed and remained mildly elevated in the postpartum period. In the third group of women (“increasing-high sleep complaints”), scores on the PSQI began in a range that indicated they were experiencing poor sleep quality (mean = 6.71) and then increased in a linear fashion as pregnancy progressed, remaining elevated into the postpartum period. Finally, the fourth group of women (“stable-high sleep complaints”) had clearly elevated scores on the PSQI at baseline (mean = 12.32) that decreased slightly during late pregnancy and early postpartum and then increased to near baseline levels by 6 mo postpartum.
Figure 1.
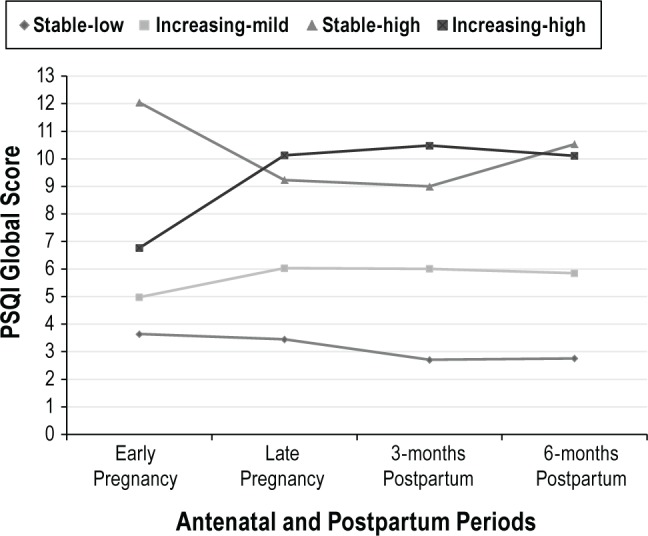
Trajectory of sleep quality over time: four-group model.
Table 1.
Sleep trajectory parameter estimates (n = 293).
Baseline Sleep Trajectory Group Differences
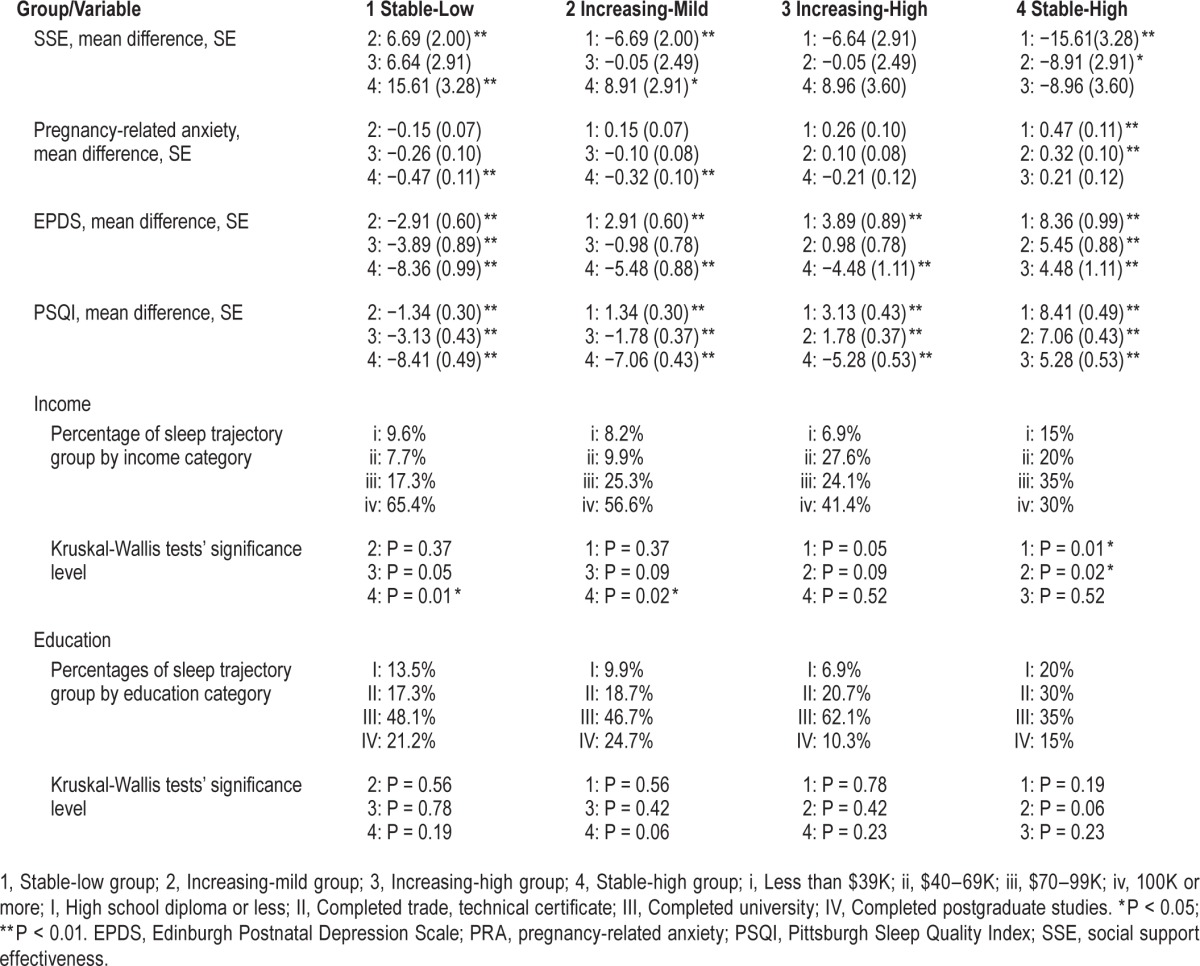
The second aim of this study was to examine which factors assessed at baseline differed among the four identified sleep trajectory groups (see Table 2). Age, parity, and education did not differ across sleep trajectory groups (P > 0.05); however, significant differences in income were observed between groups. Follow-up analysis showed that the “stable-high sleep complaints” group reported a lower income than the “stable-low sleep complaints” and “increasing-mild sleep complaints” groups (P < 0.05). Social support was higher in the “stable-low” and “increasing-mild” group compared to the “stable-high” group. EPDS scores also differed by group, with the “stable-low” group reporting the lowest scores, “stable-high” the highest and the “increasing-mild” and “increasing-high” falling in between (although not differing significantly from each other). All groups differed in terms of baseline sleep problems, with the “stable-low” group evidencing the lowest sleep problems and the “stable-high” reporting the highest sleep problems at baseline.
Table 2.
Multiple comparisons of baseline variables by sleep trajectory group.
Sleep and Depression
Finally, we examined whether sleep trajectory was associated with an increased risk of experiencing high depressive symptoms in the postpartum period, while controlling for variables known to influence the relationship between sleep and mood, including depression in pregnancy, parity, maternal age, anxiety, social support, and income. The reference group for these analyses was the “stable-low sleep complaints group.”
Age, parity, pregnancy-related anxiety, and social support were not associated with high depressive symptoms in the postpartum period (P > 0.05) (see Table 3). In contrast, high depressive symptoms in pregnancy, income, and sleep trajectory group were associated with an increased risk of experiencing high depressive symptoms in the postpartum period (P < 0.05).
Table 3.
Predictors of high depressive symptoms in the postpartum period by sleep trajectory group.
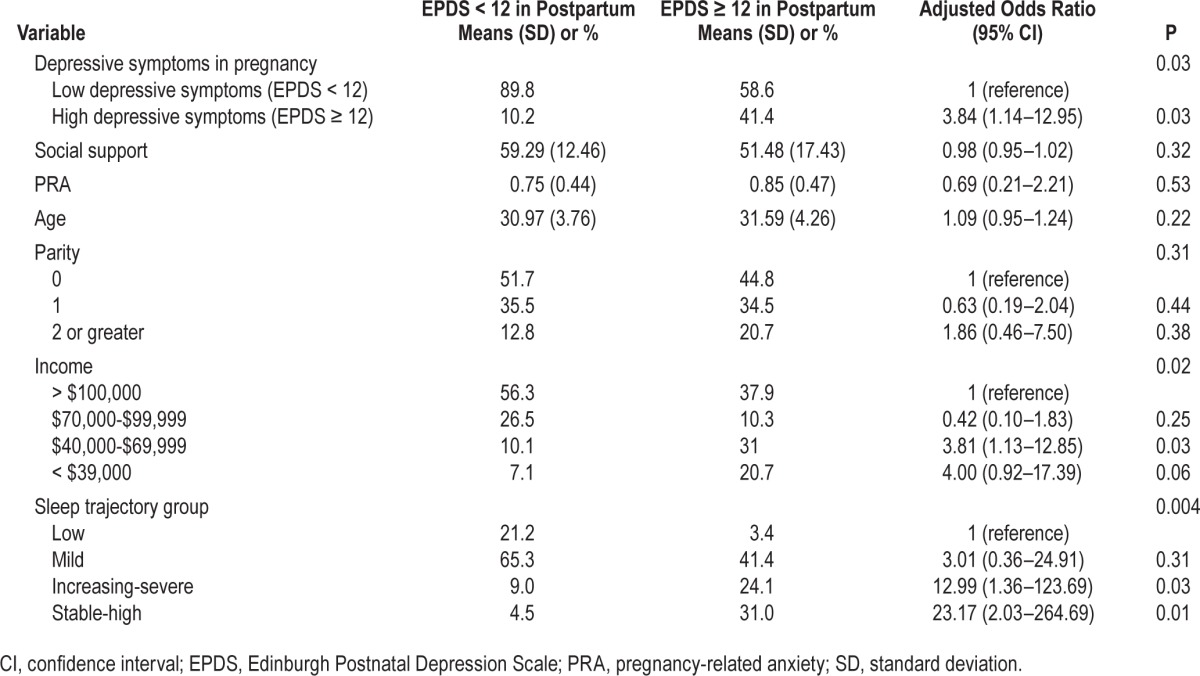
Women with a history of suspected depression in pregnancy were nearly four and half times more likely to experience high symptoms of depression in the postpartum (odds ratio [OR] = 4.43). The comparison group for income was > $100,000/y Women reporting household incomes of $70,000-$99,999 were not more likely to report high depressive symptoms in the postpartum period than those in the highest income group. Women in the $40,000-$69,999 and less than $39,999 income range were more likely to experience high depressive symptoms in the postpartum period (OR = 3.756 and 3.415, respectively). The comparison for sleep trajectory group was women classified as having “stable-low sleep complaints”; they did not differ significantly from women in the “increasing-mild sleep complaints group” on depressive symptoms (P = 0.30). Women in the “increasing high sleep complaints” group and the stable-high sleep complaints” group were significantly more likely to experience high depressive symptoms in the postpartum period (OR = 12.42 and 21.04, respectively).
DISCUSSION
In this nonclinical sample of women, followed from early pregnancy to 6 mo postpartum, we identified groups with distinct trajectories of subjective sleep quality. When we modeled the entire sample using a single linear trajectory we observed a small but significant decrease in subjective sleep quality during the perinatal period, as has been previously reported.6,14,49 Further analysis revealed four distinct sleep trajectories, suggesting that changes in sleep quality in the perinatal period are not unitary. These sets of trajectories included one group of women with relatively good and unchanging subjective sleep quality, approximately 21% of sample fit into this category. A second group of women reported a mild decrease in sleep quality from late pregnancy through the postpartum period. This group comprised the largest number of women (approximately 60%) and their trajectory appeared to be in line with other published reports that have investigated group means in PSQI trajectories over the perinatal period.6 In contrast, very poor subjective sleep quality was isolated within two trajectory groups. The third trajectory group was composed of women who reported high PSQI scores entering the study, which remained significantly elevated throughout pregnancy and the postpartum (approximately 6.7%). The fourth group of women entered the study with PSQI scores that were above the cutoff for sleep problems; they then experienced a significant increase in PSQI scores in late pregnancy and their self-reported sleep problems remained elevated throughout the postpartum period (approximately 12%). The groups with the highest PSQI scores in pregnancy were also most likely to experience high depressive symptoms in the postpartum period, even after controlling for depressive symptoms in pregnancy and other relevant covariates.
Trajectory groups differed on multiple psychosocial measures. Groups tended to express relative vulnerabilities or strengths across domains of psychological functioning, rather than in one specific domain. At the extreme, the group with the lowest levels of perceived social support, the “stable-high sleep complaints” group, also expressed the highest levels of pregnancy-related anxiety and depressive symptoms. In contrast, the group with low PSQI scores throughout the study, the “stable-low sleep complaints” group, had the lowest levels of pregnancy-related anxiety and depressive symptoms and highest levels of social support. The other two groups reported symptoms of anxiety, depression and social support that fell between the extremes of sleep quality. Differences in income were observed between groups (P < 0.05), but this was only significant when comparing the “stable-high sleep complaints” group (who had the lowest income in the sample) and the “stable-low sleep complaints” and “increasing-mild sleep complaints” groups. These results are consistent with the findings from a previous study, where significant associations were found between sleep problems and measures of socioeconomic status such as household income and not being in paid employment, which are potentially a function of increased levels of financial stress.50 Education did not differ significantly between groups. The limited findings in this study between SES (e.g., indices of income and education) may have been due to a restriction of range in this relatively educated and financially stable sample.
Sleep trajectory group was associated with changes in self-reported symptoms of depression over time. Specifically, the groups with the worst sleep quality in pregnancy were most likely to experience high depressive symptoms in the post-partum period. This extends previous findings indicating that the emergence of sleep problems in the perinatal period is associated with increases in symptoms of depression.17,18 It also suggests that deteriorating sleep quality in pregnancy may be an important risk factor for the development of PPD. Although results from this paper cannot speak to causality, our findings replicate previous work showing that sleep problems in non-pregnant populations portend depression13 and show that the relationship also appears to exist in a pregnant population.
Potentially, there is a threshold of change in sleep quality that is necessary to predict new onset depression. For example, small changes in sleep quality in the perinatal period may be normative side effects of pregnancy that are not a risk factor for symptoms of depression, whereas large decreases in sleep quality may be a significant risk factor. Investigation of changes in averages across a group may increase the potential to miss subsets of women who are at particularly high risk.
Although the psychophysiological mechanisms linking sleep disturbances and depression remain unclear, one potential mediator is the impact of sleep disturbance on emotion regulation.13,51 Disruptions in circadian/ultradian rhythms have been linked to alterations in emotional reactivity and an increased likelihood to perceive ambiguous information as threatening, which may eventually lead to the emergence of depressed mood.54 Additionally, sleep deprivation/disturbance has been associated with an increase in systemic inflammation, which itself has been implicated in the experience of depression.52,53
Interestingly, the only baseline characteristic that distinguished between the “increasing-mild sleep complaints” and “increasing-high sleep complaints” groups was differences in baseline PSQI scores, indicating that poor subjective sleep quality in early pregnancy may be a unique risk factor for worsening sleep problems. Participants whose PSQI scores were significantly over the cutoff of 5 in early pregnancy were those whose sleep was chronically disturbed throughout the course of the study or who went on to develop more serious sleep disturbances through pregnancy and the postpartum period. Additionally, we did not observe spontaneous remission of sleep problems in any trajectory group, pointing to the potential need for screening of sleep disturbances and targeted intervention in pregnant women suffering from clinically significant sleep problems.
Entering pregnancy with elevated PSQI scores was associated with significantly worse sleep trajectories throughout the perinatal period. This is consistent with previous research suggesting stability in symptoms of poor sleep.54 It is notable, however, that the “increasing-high sleep complaints” trajectory group defied the trend of relative stability and showed increases in sleep difficulties in pregnancy, which remained elevated in the postpartum period. There are several reasons why this group of women could have experienced such dramatic decreases in sleep quality as pregnancy progressed. Potentially, disorders of sleep that commonly occur in pregnancy, such as obstructive sleep apnea or restless leg syndrome impacted this group; however, if this were the case, we would expect to see their sleep quality return to normal during the postpartum period.55,56 In contrast, this group of women continued to report elevated PSQI scores throughout the duration of the study. We also examined if elevation on the sleep disruption scale of the PSQI were driving the increase in PSQI global scores in the “increasing-high sleep complaints” groups and found that they were not (data not shown), suggesting that factors other than pregnancy-related discomfort or sleep disordered breathing were influencing this change. An alternative explanation is that this was a group of women who were already at high risk for the development of sleep problems, as indicated by elevated PSQI scores in early pregnancy. Pregnancy may have served as a trigger for negative cognitions about sleep (e.g., “I'll never be able to sleep with my new baby”) or behavior changes in sleep hygiene, resulting in continuous disruptions in sleep. Further investigation is necessary in order to better understand the predisposing features that lead this group to develop chronic antenatal sleep problems.
Limitations
Several limitations of this study should be noted. Our sample was relatively affluent and educated in comparison with Canadian norms. Specifically, the percentage of participants in our study with an annual household income greater than $100,000 (54.8%) was higher than the national percentage of couple families with the same range of income (38.38%).57 The percentage of women with a university degree (67.3%) was also significantly higher than the Canadian female population percentage with the same level of education (34.3%).58 With regard to other demographic characteristics such as age and ethnicity, our sample was similar with the Canadian norms.59,60 Although the sample did include a minority of women from lower SES strata, the majority were relatively affluent and well educated and it remains unclear the extent to which our findings are population representative. Additionally, the study was limited by lack of objective measures of sleep and standardized assessment of insomnia. Although some research suggests that subjective (versus objective) measure of disturbed sleep are better predictors of later depression,61,62 future research with objective sleep measures is needed to determine whether the trajectories we have identified and associations with new onset of suspected PPD are also related to objective sleep measures. We were also limited by self-reported depressive symptoms; although the EPDS is the gold-standard self-report questionnaire for depressive symptoms in the perinatal period, diagnostic interviews would add a layer of additional validity to our findings. Finally, we had limited information about factors that may have led to poor sleep, such as sleep cognitions and behavioral variables.
There are also several notable strengths of this study, including: a large sample that was followed over time, use of novel statistical techniques that allowed for the identification of unique trajectories of sleep quality, and the inclusion of multiple relevant covariates in the analyses examining relationships between sleep trajectories and postpartum depressive symptoms. In summary, these results suggest that there are unique trajectories of sleep quality from early pregnancy to 6 mo postpartum. Additionally, results point to trajectory groups that are at an increased high risk of developing symptoms of postpartum depression. These findings are in line with several reports suggesting observations between disrupted subjective sleep quality in pregnancy and increases in depressive symptoms.14,62–64 Given the consequences of poor sleep quality in pregnancy, it may be important to identify and intervene with groups who are at high risk for experiencing sleep problems in the perinatal period.65
DISCLOSURE STATEMENT
This was not an industry supported study. The authors have indicated no financial conflicts of interest. The analysis was performed at University of Calgary, Calgary, AB, Canada.
ACKNOWLEDGMENTS
This work was supported by the generous donors of the Alberta Children's Hospital Foundation (Dr. Tomfohr.), the Canadian Institutes of Health Research (Dr. Campbell., Dr. Letourneau, and Dr. Giesbrecht) and the Alberta Centre for Child, Family, and Community Research (Dr. Letourneau and Dr. Giesbrecht).
ABBREVIATIONS
- BIC
Bayesian Information Criterion
- EPDS
Edinburgh Postnatal Depression Scale
- GA
gestational age
- MCAR
missing completely at random
- PSQI
Pittsburgh Sleep Quality Index
- PPD
postpartum depression
- SD
standard deviation
- SES
socioeconomic status
- SSE
social support effectiveness
REFERENCES
- 1.Parry BL, Martinez LF, Maurer EL, Lopez AM, Sorenson D, Meliska CJ. Sleep, rhythms and women's mood. part I. menstrual cycle, pregnancy and postpartum. Sleep Med Rev. 2006;10:129–44. doi: 10.1016/j.smrv.2005.09.003. [DOI] [PubMed] [Google Scholar]
- 2.Dørheim SK, Bjorvatn B, Eberhard-Gran M. Insomnia and depressive symptoms in late pregnancy: a population-based study. Behav Sleep Med. 2012;10:152–66. doi: 10.1080/15402002.2012.660588. [DOI] [PubMed] [Google Scholar]
- 3.Kizilirmak A, Timur S, Kartal B. Insomnia in pregnancy and factors related to insomnia. Scientific World J. 2012;2012:197093. doi: 10.1100/2012/197093. [DOI] [PMC free article] [PubMed] [Google Scholar]
- 4.O'Hara MW, Wisner KL. Perinatal mental illness: definition, description and aetiology. Best practice and research. Clin Obstet Gynaecol. 2014;28:3–12. doi: 10.1016/j.bpobgyn.2013.09.002. [DOI] [PMC free article] [PubMed] [Google Scholar]
- 5.Buysse DJ, Reynolds CF, 3rd, Monk TH, Berman SR, Kupfer DJ. The Pittsburgh Sleep Quality Index: a new instrument for psychiatric practice and research. Psychiatry Res. 1989;28:193–213. doi: 10.1016/0165-1781(89)90047-4. [DOI] [PubMed] [Google Scholar]
- 6.Facco FL, Kramer J, Ho KH, Zee PC, Grobman WA. Sleep disturbances in pregnancy. Obstet Gynecol. 2010;115:77–83. doi: 10.1097/AOG.0b013e3181c4f8ec. [DOI] [PubMed] [Google Scholar]
- 7.Matsumoto K, Shinkoda H, Kang MJ, Seo YJ. Longitudinal study of mothers' sleep-wake behaviors and circadian time patterns from late pregnancy to postpartum–monitoring wrist actigraphy and sleep logs. Biol Rhythm Res. 2003;34:265–78. [Google Scholar]
- 8.Signal TL, Gander PH, Sangalli MR, Travier N, Firestone RT, Tuohy JF. Sleep duration and quality in healthy nulliparous and multiparous women across pregnancy and post-partum. Aust N Z J Obstet Gynaecol. 2007;47:16–22. doi: 10.1111/j.1479-828X.2006.00672.x. [DOI] [PubMed] [Google Scholar]
- 9.Lee KA, Zaffke ME, McEnany G. Parity and sleep patterns during and after pregnancy. Obstet Gynecol. 2000;95:14–8. doi: 10.1016/s0029-7844(99)00486-x. [DOI] [PubMed] [Google Scholar]
- 10.Chang JJ, Pien GW, Duntley SP, Macones GA. Sleep deprivation during pregnancy and maternal and fetal outcomes: is there a relationship? Sleep Med Rev. 2010;14:107–14. doi: 10.1016/j.smrv.2009.05.001. [DOI] [PMC free article] [PubMed] [Google Scholar]
- 11.Field T, Diego M, Hernandez-Reif M, Figueiredo B, Schanberg S, Kuhn C. Sleep disturbances in depressed pregnant women and their newborns. Infant Behav Dev. 2007;30:127–33. doi: 10.1016/j.infbeh.2006.08.002. [DOI] [PubMed] [Google Scholar]
- 12.Hiscock H, Wake M. Randomised controlled trial of behavioural infant sleep intervention to improve infant sleep and maternal mood. Br Med J. 2002;324:1062–5. doi: 10.1136/bmj.324.7345.1062. [DOI] [PMC free article] [PubMed] [Google Scholar]
- 13.Baglioni C, Battagliese G, Feige B, et al. Insomnia as a predictor of depression: a meta-analytic evaluation of longitudinal epidemiological studies. J Affect Disord. 2011;135:10–9. doi: 10.1016/j.jad.2011.01.011. [DOI] [PubMed] [Google Scholar]
- 14.Skouteris H, Wertheim EH, Germano C, Paxton SJ, Milgrom J. Assessing sleep during pregnancy a study across two time points examining the Pittsburgh Sleep Quality Index and associations with depressive symptoms. Womens Health Issues. 2009;19:45–51. doi: 10.1016/j.whi.2008.10.004. [DOI] [PubMed] [Google Scholar]
- 15.Goyal D, Gay C, Lee K. Fragmented maternal sleep is more strongly correlated with depressive symptoms than infant temperament at three months postpartum. Arch Womens Ment Health. 2009;12:229–37. doi: 10.1007/s00737-009-0070-9. [DOI] [PMC free article] [PubMed] [Google Scholar]
- 16.Goyal D, Gay CL, Lee KA. Patterns of sleep disruption and depressive symptoms in new mothers. J Perinat Neonatal Nurs. 2007;21:123–9. doi: 10.1097/01.JPN.0000270629.58746.96. [DOI] [PubMed] [Google Scholar]
- 17.Okun ML, Hanusa BH, Hall M, Wisner KL. Sleep complaints in late pregnancy and the recurrence of postpartum depression. Behav Sleep Med. 2009;7:106–17. doi: 10.1080/15402000902762394. [DOI] [PMC free article] [PubMed] [Google Scholar]
- 18.Okun ML, Luther J, Prather AA, Perel JM, Wisniewski S, Wisner KL. Changes in sleep quality, but not hormones predict time to postpartum depression recurrence. J Affect Disord. 2011;130:378–84. doi: 10.1016/j.jad.2010.07.015. [DOI] [PMC free article] [PubMed] [Google Scholar]
- 19.Kamysheva E, Skouteris H, Wertheim EH, Paxton SJ, Milgrom J. A prospective investigation of the relationships among sleep quality, physical symptoms, and depressive symptoms during pregnancy. (clinical report) J Affect Disord. 2010;123:317–20. doi: 10.1016/j.jad.2009.09.015. [DOI] [PubMed] [Google Scholar]
- 20.Dørheim SK, Bjorvatn B, Eberhard-Gran M. Can insomnia in pregnancy predict postpartum depression? A longitudinal, population-based study. PLoS One. 2014;9:e94674. doi: 10.1371/journal.pone.0094674. [DOI] [PMC free article] [PubMed] [Google Scholar]
- 21.Kang MJ, Matsumoto K, Shinkoda H, Mishima M, Seo YJ. Longitudinal study for sleep-wake behaviours of mothers from pre-partum to post-partum using actigraph and sleep logs. Psychiatry Clin Neurosci. 2002;56:251–2. doi: 10.1046/j.1440-1819.2002.00992.x. [DOI] [PubMed] [Google Scholar]
- 22.Jomeen J, Martin CR. Assessment and relationship of sleep quality to depression in early pregnancy. J Reprod Infant Psychol. 2007;25:87–99. [Google Scholar]
- 23.Okun ML, Kiewra K, Luther JF, Wisniewski SR, Wisner KL. Sleep disturbances in depressed and nondepressed pregnant women. Depress Anxiety. 2011;28:676–85. doi: 10.1002/da.20828. [DOI] [PMC free article] [PubMed] [Google Scholar]
- 24.Heath AC, Eaves LJ, Kirk KM, Martin NG. Effects of lifestyle, personality, symptoms of anxiety and depression, and genetic predisposition on subjective sleep disturbance and sleep pattern. Twin Res. 1998;1:176–88. doi: 10.1375/136905298320566140. [DOI] [PubMed] [Google Scholar]
- 25.Swanson LM, Pickett SM, Flynn H, Armitage R. Relationships among depression, anxiety, and insomnia symptoms in perinatal women seeking mental health treatment. J Womens Health. 2011;20:553–8. doi: 10.1089/jwh.2010.2371. [DOI] [PubMed] [Google Scholar]
- 26.Lancaster CA, Gold KJ, Flynn HA, Yoo H, Marcus SM, Davis MM. Risk factors for depressive symptoms during pregnancy: a systematic review. Am J Obstet Gynecol. 2010;202:5–14. doi: 10.1016/j.ajog.2009.09.007. [DOI] [PMC free article] [PubMed] [Google Scholar]
- 27.Glazier RH, Elgar FJ, Goel V, Holzapfel S. Stress, social support, and emotional distress in a community sample of pregnant women. J Psychosom Obstet Gynaecol. 2004;25:247–55. doi: 10.1080/01674820400024406. [DOI] [PubMed] [Google Scholar]
- 28.Haga SM, Ulleberg På, Slinning K, Kraft På, Steen TB, Staff A. A longitudinal study of postpartum depressive symptoms: multilevel growth curve analyses of emotion regulation strategies, breastfeeding self-efficacy, and social support. Arch Womens Ment Health. 2012;15:175–84. doi: 10.1007/s00737-012-0274-2. [DOI] [PubMed] [Google Scholar]
- 29.Soltani M, Haytabakhsh M, Najman J, et al. Sleepless nights: the effect of socioeconomic status, physical activity, and lifestyle factors on sleep quality in a large cohort of australian women. Arch Womens Ment Health. 2012;15:237–47. doi: 10.1007/s00737-012-0281-3. [DOI] [PubMed] [Google Scholar]
- 30.Okun ML, Tolge M, Hall M. Low socioeconomic status negatively affects sleep in pregnant women. J Obstet Gynecol Neonatal Nurs. 2014;43:160–7. doi: 10.1111/1552-6909.12295. [DOI] [PMC free article] [PubMed] [Google Scholar]
- 31.Churchill GA, Peter JP. Research design effects on the reliability of rating scales: a meta-analysis. J Market Res. 1984;21:360–75. [Google Scholar]
- 32.Beck CT. Predictors of postpartum depression: an update. Nurs Res. 2001;50:275–85. doi: 10.1097/00006199-200109000-00004. [DOI] [PubMed] [Google Scholar]
- 33.Cox JL, Holden JM, Sagovsky R. Detection of postnatal depression: development of the 10-item Edinburgh Postnatal Depression Scale. Br J Psychiatry. 1987;150:782–6. doi: 10.1192/bjp.150.6.782. [DOI] [PubMed] [Google Scholar]
- 34.Bergink V, Kooistra L, Lambregtse-van den Berg, Mijke P, Wijnen H, Bunevicius R, van Baar A, et al. Validation of the Edinburgh Depression Scale during pregnancy. J Psychosom Res. 2011;70:385–9. doi: 10.1016/j.jpsychores.2010.07.008. [DOI] [PubMed] [Google Scholar]
- 35.Affonso DD, De AK, Horowitz JA, Mayberry LJ. An international study exploring levels of postpartum depressive symptomatology. J Psychosom Res. 2000;49:207–16. doi: 10.1016/s0022-3999(00)00176-8. [DOI] [PubMed] [Google Scholar]
- 36.Murray L, Carothers AD. The validation of the Edinburgh Post-natal Depression Scale on a community sample. Br J Psychiatry. 1990;157:288–90. doi: 10.1192/bjp.157.2.288. [DOI] [PubMed] [Google Scholar]
- 37.Milgrom J, Ericksen J, Negri L, Gemmill AW. Screening for postnatal depression in routine primary care: properties of the Edinburgh Postnatal Depression Scale in an Australian sample. Aust N Z J Psychiatry. 2005;39:833–9. doi: 10.1080/j.1440-1614.2005.01660.x. [DOI] [PubMed] [Google Scholar]
- 38.Rini C, Labay LE, Rowley S, et al. Effectiveness of partner social support predicts enduring psychological distress after hematopoietic stem cell transplantation. J Consult Clin Psychol. 2011;79:64–74. doi: 10.1037/a0022199. [DOI] [PMC free article] [PubMed] [Google Scholar]
- 39.Rini C, Schetter CD, Hobel CJ, Glynn LM, Sandman CA. Effective social support: antecedents and consequences of partner support during pregnancy. Pers Relationship. 2006;13:207–29. [Google Scholar]
- 40.Rini CK, Dunkel-Schetter C, Wadhwa PD, Sandman CA. Psychological adaptation and birth outcomes: the role of personal resources, stress, and sociocultural context in pregnancy. Health Psychol. 1999;18:333–45. doi: 10.1037//0278-6133.18.4.333. [DOI] [PubMed] [Google Scholar]
- 41.Little RJA, Rubin DB. New York: John Wiley; 1987. Statistical analysis with missing data. [Google Scholar]
- 42.Nagin DS. Analyzing developmental trajectories: a semiparametric, group-based approach. Psychol Methods. 1999;4:139–57. doi: 10.1037/1082-989x.6.1.18. [DOI] [PubMed] [Google Scholar]
- 43.Jones BL, Nagin DS, Roeder K. A SAS procedure based on mixture models for estimating development trajectories. Sociol Methods Res. 2001;29:374–93. [Google Scholar]
- 44.Kamp Dush CM, Taylor MG, Kroeger RA. Marital happiness and psychological well-being across the life course. Fam Relat. 2008;57:211–26. doi: 10.1111/j.1741-3729.2008.00495.x. [DOI] [PMC free article] [PubMed] [Google Scholar]
- 45.Nagin DS, Tremblay RE. Developmental trajectory groups: fact or a useful statistical fiction? Criminology. 2005;43:873–904. [Google Scholar]
- 46.Mora PA, Bennett IM, Elo IT, Mathew L, Coyne JC, Culhane JF. Distinct trajectories of perinatal depressive symptomatology: evidence from growth mixture modeling. Am J Epidemiol. 2009;169:24–32. doi: 10.1093/aje/kwn283. [DOI] [PMC free article] [PubMed] [Google Scholar]
- 47.Hollander M, Wolfe DA. New York: John Wiley; 1999. Nonparametric statistical methods. [Google Scholar]
- 48.Nielsen Forman D, Videbech P, Hedegaard M, Dalby Salvig J, Secher NJ. Postpartum depression: identification of women at risk. BJOG. 2000;107:1210–7. doi: 10.1111/j.1471-0528.2000.tb11609.x. [DOI] [PubMed] [Google Scholar]
- 49.Skouteris H, Germano C, Wertheim EH, Paxton SJ, Milgrom J. Sleep quality and depression during pregnancy: a prospective study. J Sleep Res. 2008;17:217–20. doi: 10.1111/j.1365-2869.2008.00655.x. [DOI] [PubMed] [Google Scholar]
- 50.Arber S, Bote M, Meadows R. Gender and socio-economic patterning of self-reported sleep problems in Britain. Soc Sci Med. 2009;68:281–9. doi: 10.1016/j.socscimed.2008.10.016. [DOI] [PubMed] [Google Scholar]
- 51.Goldstein AN, Walker MP. The role of sleep in emotional brain function. Annu Rev Clin Psychol. 2014;10:679–708. doi: 10.1146/annurev-clinpsy-032813-153716. [DOI] [PMC free article] [PubMed] [Google Scholar]
- 52.Okun ML, Coussons-Read M, Hall M. Disturbed sleep is associated with increased C-reactive protein in young women. Brain Behav Immun. 2009;23:351–4. doi: 10.1016/j.bbi.2008.10.008. [DOI] [PMC free article] [PubMed] [Google Scholar]
- 53.Motivala SJ, Sarfatti A, Olmos L, Irwin MR. Inflammatory markers and sleep disturbance in major depression. Psychosom Med. 2005;67:187–94. doi: 10.1097/01.psy.0000149259.72488.09. [DOI] [PubMed] [Google Scholar]
- 54.Morin CM, Bélanger L, Leblanc M, et al. The natural history of insomnia: a population-based 3-year longitudinal study. Arch Intern Med. 2009;169:447–53. doi: 10.1001/archinternmed.2008.610. [DOI] [PubMed] [Google Scholar]
- 55.Hübner A, Krafft A, Gadient S, Werth E, Zimmermann R, Bassetti CL. Characteristics and determinants of restless legs syndrome in pregnancy: a prospective study. Neurology. 2013;80:738–42. doi: 10.1212/WNL.0b013e318283baf3. [DOI] [PubMed] [Google Scholar]
- 56.Edwards N, Blyton DM, Hennessy A, Sullivan CE. Severity of sleep-disordered breathing improves following parturition. Sleep. 2005;28:737–41. doi: 10.1093/sleep/28.6.737. [DOI] [PubMed] [Google Scholar]
- 57.Statistics Canada. Ottawa (ON): Government of Canada; 2013. Jul 23, Table 111-0012. Family income, by family type (couple families) [Internet] [cited 2014 Nov 12]. Available from: http://www.statcan.gc.ca/tables-tableaux/sum-som/l01/cst01/famil106a-eng.htm. [Google Scholar]
- 58.Turcotte M. Ottawa (ON): Statistics Canada; 2011. Dec 14, Women and education. Women in Canada: A Gender-based Statistical Report. Sixth edition. [Internet] [cited 2014 Nov 11]. Report No.: 89–503-X. Available from: http://www.statcan.gc.ca/pub/89-503-x/2010001/article/11542-eng.htm. [Google Scholar]
- 59.Chui T, Maheux H. Ottawa (ON): Statistics Canada; 2011. Jul 26, Visible minority women. Women in Canada: A Gender-based Statistical Report. [Internet] [cited 2014 Nov 10]. Report No.: 89-503-X. Available from: www.statcan.gc.ca/pub/89-503-x/2010001/article/11527-eng.pdf. [Google Scholar]
- 60.Statistics Canada. Ottawa (ON): Government of Canada; 2013. Mar 19, Table 102-4504. Mean age of mother at time of delivery (live births), Canada, provinces and territories, annual (years) [Internet] [cited 2014 Nov 12]. Available from: http://www5.statcan.gc.ca/cansim/a26?lang=eng&id=1024504. [Google Scholar]
- 61.Maglione JE, Ancoli-Israel S, Peters KW, et al. Subjective and objective sleep disturbance and longitudinal risk of depression in a cohort of older women. Sleep. 2014;37:1179–87. doi: 10.5665/sleep.3834. [DOI] [PMC free article] [PubMed] [Google Scholar]
- 62.Park EM, Meltzer-Brody S, Stickgold R. Poor sleep maintenance and subjective sleep quality are associated with postpartum maternal depression symptom severity. Arch Womens Ment Health. 2013;16:539–47. doi: 10.1007/s00737-013-0356-9. [DOI] [PMC free article] [PubMed] [Google Scholar]
- 63.Asltoghiri M, Ghodsi Z. Study of the relation between sleep disorder and depression at late stage of pregnancy. Procedia Soc Behav Sci. 2011;28:430–4. [Google Scholar]
- 64.Skouteris H, Germano C, Wertheim EH, Paxton SJ, Milgrom J. Sleep quality and depression during pregnancy: a prospective study. J Sleep Res. 2008;17:217–20. doi: 10.1111/j.1365-2869.2008.00655.x. [DOI] [PubMed] [Google Scholar]
- 65.Sharkey KM. Time to treat problematic sleep disturbance in perinatal women. Behav Sleep Med. 2013;11:308–10. doi: 10.1080/15402002.2013.823789. [DOI] [PMC free article] [PubMed] [Google Scholar]