

Abstract
Study Objectives:
To evaluate the reliability of nocturnal sleep dynamics in the differential diagnosis of central disorders of hypersomnolence.
Design:
Cross-sectional.
Setting:
Sleep laboratory.
Patients:
One hundred seventy-five patients with hypocretin-deficient narcolepsy type 1 (NT1, n = 79), narcolepsy type 2 (NT2, n = 22), idiopathic hypersomnia (IH, n = 22), and “subjective” hypersomnolence (sHS, n = 52).
Interventions:
None.
Methods:
Polysomnographic (PSG) work-up included 48 h of continuous PSG recording. From nocturnal PSG conventional sleep macrostructure, occurrence of sleep onset rapid eye movement period (SOREMP), sleep stages distribution, and sleep stage transitions were calculated. Patient groups were compared, and receiver operating characteristic (ROC) curve analysis was used to test the diagnostic utility of nocturnal PSG data to identify NT1.
Results:
Sleep macrostructure was substantially stable in the 2 nights of each diagnostic group. NT1 and NT2 patients had lower latency to rapid eye movement (REM) sleep, and NT1 patients showed the highest number of awakenings, sleep stage transitions, and more time spent in N1 sleep, as well as most SOREMPs at daytime PSG and at multiple sleep latency test (MSLT) than all other groups. ROC curve analysis showed that nocturnal SOREMP (area under the curve of 0.724 ± 0.041, P < 0.0001), percent of total sleep time spent in N1 (0.896 ± 0.023, P < 0.0001), and the wakefulness-sleep transition index (0.796 ± 0.034, P < 0.0001) had a good sensitivity and specificity profile to identify NT1 sleep, especially when used in combination (0.903 ± 0.023, P < 0.0001), similarly to SOREMP number at continuous daytime PSG (0.899 ± 0.026, P < 0.0001) and at MSLT (0.956 ± 0.015, P < 0.0001).
Conclusions:
Sleep macrostructure (i.e. SOREMP, N1 timing) including stage transitions reliably identifies hypocretin-deficient narcolepsy type 1 among central disorders of hypersomnolence.
Citation:
Pizza F, Vandi S, Iloti M, Franceschini C, Liguori R, Mignot E, Plazzi G. Nocturnal sleep dynamics identify narcolepsy type 1. SLEEP 2015;38(8):1277–1284.
Keywords: narcolepsy, polysomnography, sleep macrostructure, sleep stage transitions
INTRODUCTION
Central disorders of hypersomnolence (CDH) are chronic and disabling disorders characterized by chronic sleepiness not explained by underlying breathing or motor disturbances during sleep. Albeit this nosographic category includes hypersomnias due to a medical disorder, to a medication or substance, associated with a psychiatric disorder and the insufficient sleep syndrome, the disorders of actual central origin (not due to comorbidities or behavior) are those related to a complete or possibly partial neurotransmission defect such as hypocretin deficiency (narcolepsy type 1, NT1, or narcolepsy type 2, NT2, respectively) or are of still unknown origin (idiopathic hypersomnia, IH).1
The diagnostic confirmation of clinically suspected CDH requires the objective assessment of nocturnal sleep and of daytime sleep propensity with the multiple sleep latency test (MSLT). This serves to exclude underlying night-sleep alterations and document diurnal high sleep propensity (short mean sleep latency) with or without increased tendency to rapidly enter into rapid eye movement (REM) sleep, a finding typical of narcolepsy.1–3 The aforementioned procedures are highly time and cost consuming, requiring an equipped sleep laboratory and trained personnel to consecutively monitor patients during nighttime and daytime. Unfortunately, long waiting lists from clinical evaluation to polysomnographic (PSG) recordings prevent many patients from rapidly receiving proper diagnosis and treatment. Moreover, Longstreth et al.,4 upon reviewing epidemiological evidence on narcolepsy, highlighted how most of the current knowledge on narcolepsy prevalence is based on large questionnaire-based studies or national registries, with few data confirmed by clinical assessment and/or sleep studies, the latter performed only in a subset of previously screened subjects.4 Considering that the clinical definition of cataplexy (pathognomonic for narcolepsy with cataplexy, now NT1)1,5 as a self-reported symptom remains vulnerable to malingering and inadequate history collection (especially by questionnaire assessment), it is possible that the prevalence rates of narcolepsy with cataplexy falling between 25 and 50 per 100,000 people are only the top of a underdiagnosed disease “iceberg” with variable severity levels.4
Several studies addressed nocturnal sleep in CDH and particularly in NT1 with the aim of describing sleep related comorbidities and also peculiarities in terms of sleep macrostructure and microstructure, quantitative electroencephalographic (EEG) analyses, as well as muscle tone or periodicity of leg movements detected by chin and bilateral leg electromyography (EMG).6 Conversely, few data addressed the diagnostic value of conventional sleep macrostructure and showed that the occurrence of REM sleep within the sleep onset period (SOREMP) during nocturnal sleep distinguished narcolepsy.7 Indeed, nocturnal SOREMP has been now been reintroduced in the actual diagnostic criteria for narcolepsy together with the MSLT.1 However, approximately 50% of NT1 patients do not show a nocturnal SOREMP, thus limiting the use of nocturnal sleep as exclusive neurophysiological disease marker.7 Other studies addressed the sequential occurrence of sleep stages at sleep onset either at the MSLT or at nocturnal PSG (nPSG) and further showed that SOREMPs identify narcolepsy from other CDH (namely IH and insufficient sleep syndrome),8–10 and that the direct transition from non REM sleep stage 1 or wakefulness to SOREMP was more specific of NT1 and associated with overall higher narcolepsy severity.9
Although the qualitative analysis of the sleep onset period can provide additional useful information, conventional sleep parameters provide only a static picture of sleep, thus missing its complex and dynamic unfolding over time. Indeed, sleep is a nonlinear process with different representations of stages from the beginning to the end of the night and is characterized by significant fluctuations, as evidenced, for example, by the analysis of the cyclic alternating pattern.11 In addition to the analysis of sleep microstructure, promising data arose from the study of transitions between sleep stages (different states of being), an approach that quantifies sleep continuity and has the intriguing potential of inferring on the underlying neuronal activity by using simple visual scoring data. A single study addressed sleep stage transitions in patients with narcolepsy and disclosed that higher nocturnal fluctuations between sleep and wakefulness were associated with biochemical and clinical evidence of hypocretin deficiency and cataplexy.12 More in-depth spectral EEG analysis with high temporal resolution (state space technique) also proved that orexin knockout mice have less distinct states and spend more time in transitional conditions, thus definitively proving behavioral instability in experimental NT1.13
With this study we aimed at assessing the diagnostic utility of parameters directly derived by the analysis of nocturnal sleep macrostructure (including the sleep onset profile and state transitions across nighttime) versus the benchmark of daytime PSG markers (SOREMP occurrence at continuous recording and at the gold standard MSLT) to identify hypocretin-deficient NT1. To search for the best NT1 marker our study has the following advantages compared to previous researches: (1) state transitions were calculated also in a new way (considering non-rapid eye movement (NREM) sleep stage 1 as a different state); (2) the time continuously spent in each state across the night was considered as counterpart of state transitions; and (3) for the first time the potential of all these measurements was evaluated in parallel in the arena of the CDH differential diagnosis.
MATERIAL AND METHODS
Patients
Subjects were consecutive drug-naive patients evaluated for complaints of chronic sleepiness (lasting at least 3 mo) from June 2006 to June 2012 at the Outpatient Clinic for Narcolepsy of the Sleep Disorders Center of the Department of Biomedical and Neuromotor Sciences (DIBINEM) of the University of Bologna, and who received a final diagnosis of CDH fulfilling current international diagnostic criteria.1 For the purpose of the study we applied the following additional inclusion criteria: (1) availability of hypocretin-1 measurement for NT1 diagnosis; (2) evidence of high sleep efficiency (supportive criterion) in the second nocturnal recording for IH diagnosis; (3) exclusion of familial, genetic (e.g., narcolepsy secondary to methylopathies),14 and secondary forms (e.g., brain malformations,15 psychiatric or significant medical comorbidity) for all CDH diagnoses. Finally, subjects whose sleepiness complaint was not confirmed by pathological sleep propensity at the MSLT and who had “normal” sleep (i.e., without breathing or motor abnormalities such as sleep apneas or periodic limb movements) were also included as reference group, and are here named “subjective HS” (sHS).
Procedures
All patients underwent the following standardized procedures: (1) clinical evaluation by the same expert in sleep medicine (G.P.); (2) subjective sleepiness assessments using the Epworth Sleepiness Scale (ESS)16; (3) 48-h continuous PSG followed by (4) a clinical MSLT with five nap opportunities3; and (5) lumbar puncture and blood drawn whenever possible to assess cerebrospinal hypocretin-1 levels and human leukocyte antigen (HLA) typing. Our standardized diagnostic algorithm has been previously detailed and included repeated clinical evaluations coupled with extension of nocturnal sleep and nocturnal cardiorespiratory monitoring to rule out psychiatric comorbidity, sleep deprivation, and sleep disordered breathing, respectively, while confirming sleepiness complaint before hospitalization.17
The 48-h PSG performed with an ambulatory device included conventional EEG, bilateral electrooculogram (EOG), submentalis and bilateral anterior tibialis EMG, respiratory parameters, and electrocardiogram.18 During daytime, patients were allowed to sleep whenever they wanted in unscheduled free-running conditions, and a sleep diary was used to subjectively assess daytime napping behavior and lights off/on during the night to identify the major nocturnal sleep period. Reliability of diary reports were also checked by reviewing the continuous video recording in patients' room by the board-certified polysomnographic technician (S.V.) before scoring the PSG and the MSLT.18 The study was approved by the local Institutional Review Board and all patients gave written informed consent.
Data Classification and Sleep Macrostructure Analysis
Neurophysiological data recorded during the 48-h PSG were first dichotomized in daytime versus nocturnal recordings using sleep diaries and verifying lights off/on timing from the video recording in the patients' room.
The following conventional sleep data were analyzed in nocturnal recordings: sleep latency from lights off (SL) and REM sleep latency from the sleep onset (defined as the first epoch of any sleep stage; REML), total sleep time (TST), sleep period (time from sleep onset to lights on; SP), wakefulness after sleep onset (WASO), sleep efficiency (SE), number of awakenings (Awk), shift stage index (defined as the number of shifts between sleep stages per hour of sleep period; SSI), absolute time spans and percentages of TST spent in NREM sleep stage 1 (N1), 2 (N2), slow wave sleep (N3), and in REM sleep (REM).
For the sleep onset period, absolute latencies from lights-off to the occurrence of the first epoch of all sleep stages were calculated to identify SOREMP (REM sleep occurring within 15 min from the sleep onset) and the sequential occurrence of sleep stages up to the first REM sleep episode. The sleep stage sequences were then classified according to the following categories: 1, N1 – N2 – N3 – REM; 2, N1 – N2 – REM; and 3, N1 or wakefulness (W) – REM.
The raw scoring of each night was then exported in an Excel file in order to obtain further dynamic information from sleep macrostructure. First, the absolute number of transitions between and within all stages were counted (W, N1, N2, N3, REM). Second, the time continuously spent in each condition was calculated, defined as the number of epochs of each stage that were followed by analogous condition, and then converted in minutes. Third, the transition counts were recoded according to the following conceptual frameworks: 1, wakefulness and sleep (N1, N2, N3, and REM together); 2, wakefulness, NREM (N1, N2, N3), and REM sleep; and 3, wakefulness, N1, NREM (N2 and N3), and REM sleep. Finally, these counts of transitions between “states” were divided by the time in bed (in hours) leading to the following transition indexes: 1, transition index between wakefulness and sleep (tW-Si); 2, transition index between wakefulness, NREM and REM sleep (tW-NR-Ri); and 3, transition index between wakefulness, NREM sleep stage 1 (N1), NREM sleep (N2, N3), and REM sleep (tN1-NR-Ri).
From daytime PSG (of the second recording day) we extracted the following parameters for each spontaneous nap: TST, absolute time in each sleep stage, as well as in REM sleep and NREM sleep, and the occurrence of SOREMP (defined as previously stated). We then calculated the number of naps, TST, time spent in each sleep stage, and the number of SOREMPs for the entire daytime period.
MSLT recordings were scored and interpreted (mean sleep latency, number of SOREMPs) as recommended.3
Statistical Analysis
Continuous and categorical data have been explored using descriptive statistics, i.e., mean ± standard deviation (SD) and frequency, respectively.
Sleep data pertaining to the first night have been contrasted with those of the second night in each diagnostic category by means of Mann-Whitney and chi-square tests to assess inter-night variability of each parameter.
The sleep data of the second night were selected for the subsequent analyses aimed at comparing the four diagnostic groups among them including overall (Kruskall-Wallis and chi-square tests, followed by multiple comparison correction) and post hoc analyses (Mann-Whitney U and chi-square tests).
Finally, the potential diagnostic value of the nocturnal sleep parameters best differentiating NT1 from all other groups (P < 0.0005 at overall comparison and significant P values at post hoc analyses versus NT1) and showing low internight variability was gathered using receiver operating characteristics (ROC) curves analysis in comparison with the best neurophysiological diagnostic markers, namely the number of SOREMPs at the MSLT (diagnostic gold standard)1 and at daytime PSG.17 Finally, we combined the nocturnal markers with the best sensitivity and specificity cutoffs to identify NT1 by converting them in positive items (0–1) and summing them into a nPSG score to be further tested with ROC curves analysis.
A value of P < 0.05 was considered statistically significant.
RESULTS
Patients
The clinical data of the studied population are reported in Table 1. It included 79 NT1, 22 NT2, 22 IH, and 52 sHS patients. Patient subgroups showed comparable sex distribution and age at both observation and at onset of the first symptom (the latter after correction for multiple comparisons).
Table 1.
Clinical data of the different patient groups.
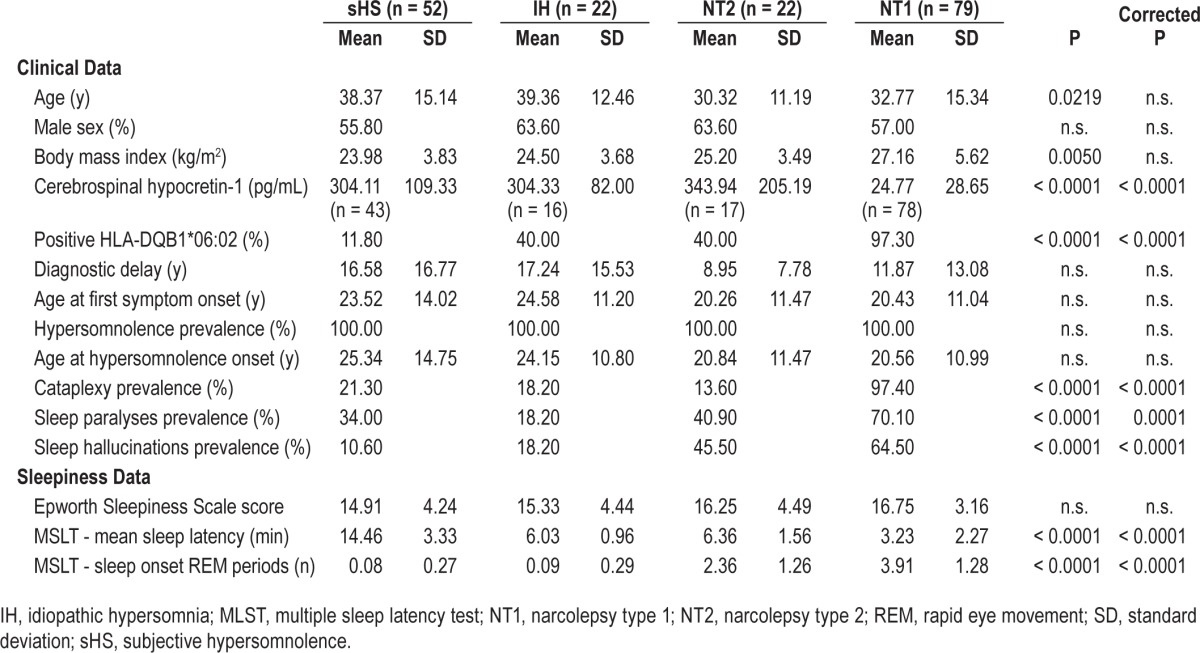
Per inclusion criteria all patients complained chronic sleepiness. Although subjective sleepiness at the ESS was comparable among groups, they differed for objective sleep propensity and number of SOREMPs at the MSLT as for diagnostic criteria.
Cataplexy was mostly represented in NT1, ranging from facial weakness with jaw opening to falls to the ground triggered by strong emotions. Of interest, although only two NT1 patients did not report cataplexy, several cases belonging to the other patient groups reported sudden weakness phenomena reminiscent of cataplexy. Sleep paralyses and hallucinations were also more prevalent in NT1 patients, who complained more frequent and disabling symptomatology.
NT1 patients most frequently carried the HLA-DQB1*06:02 allele, with two patients who were HLA negative.19 As for inclusion criteria, all the 79 NT1 patients had cerebrospinal hypocretin-1 below 110 pg/mL, with 23 undetectable, 36 below 40 pg/mL, and 20 above 40 pg/mL.
Nocturnal Sleep Data
Internight variability
The PSG data of the two nocturnal recordings in each diagnostic group are reported in Table S1 (supplemental material) together with internight statistical comparisons. Overall, the parameters explored showed low internight variability in each nosographic category, with only mild differences for SP and SOREMP occurrence in sHS, and for TST, SP, and absolute time spent in N2 in NT1 patients. Accordingly, all sleep parameters were explored, but SOREMP, TST, SP, and time spent in N2 appeared to be reliable objective disease markers for subsequent ROC curve analyses.
Macrostuctural and Dynamic Differences of Nocturnal Sleep Among Patients' Groups
The PSG data of the second nocturnal recording in each diagnostic group are reported in Table 2 together with statistical comparisons among groups followed by correction for multiple testing (39 variables * 4 groups = 156) and post hoc comparisons.
Table 2.
Polysomnographic data of second nocturnal recording of each diagnostic group and statistical comparisons.
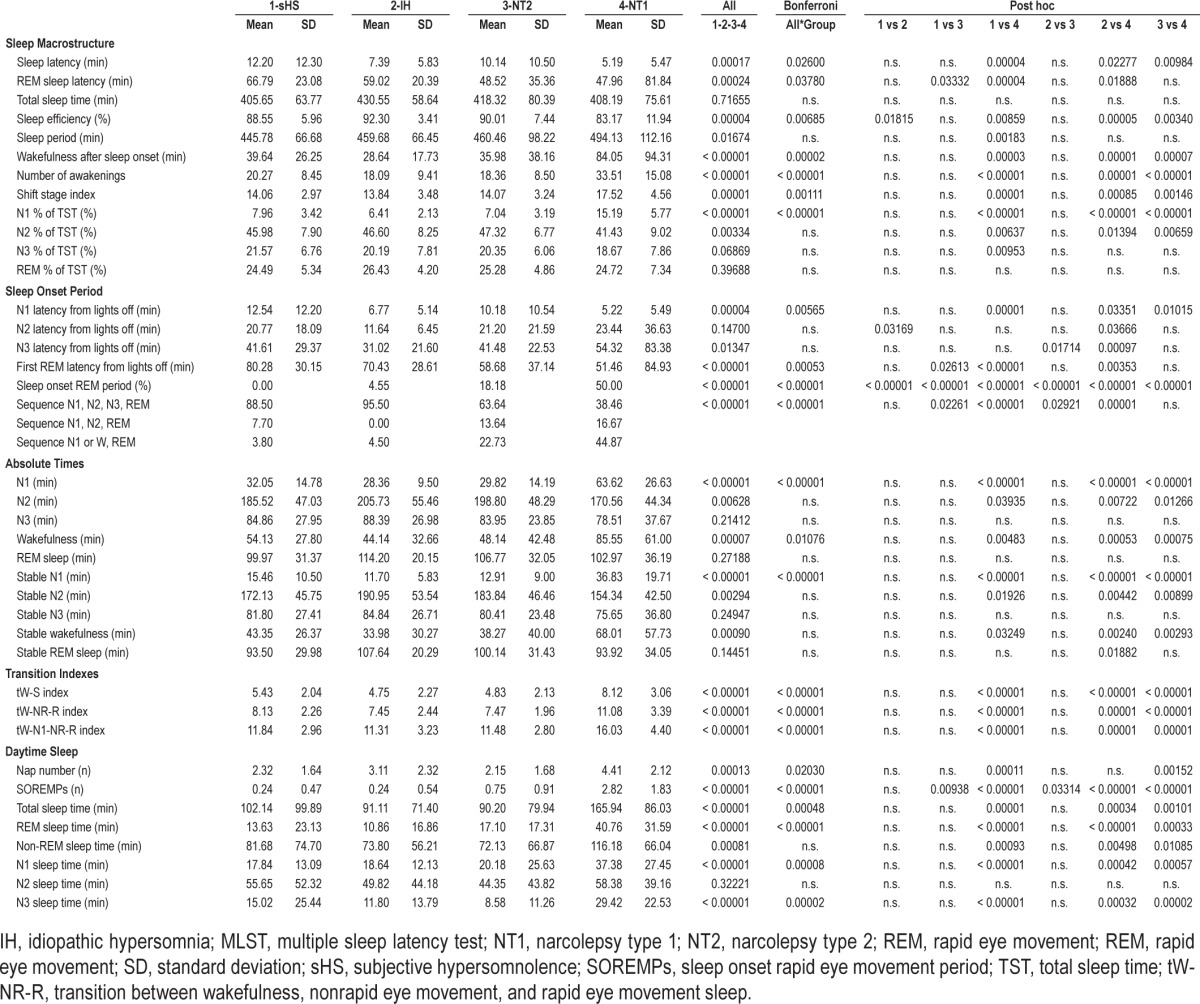
Conventional sleep macrostructure showed the following differences among groups: (1) NT1 patients had the shortest sleep latency; (2) REM latency was shorter in NT1 and NT2 than in sHS and IH, without significant differences between IH and NT2, whereas SOREMP occurrence was increasingly more frequent in sHS, IH, NT2 and NT1; (3) WASO and Awk were higher in NT1 than in the other groups, whereas SE was lower in NT1 versus the other groups and higher in IH versus sHS (per inclusion criteria); (4) the SSI and the percentage of TST spent in N1 were highest in NT1 (Figure 1), and 5) NT1 spent most absolute time in N1 and in wakefulness than all other groups.
Figure 1.
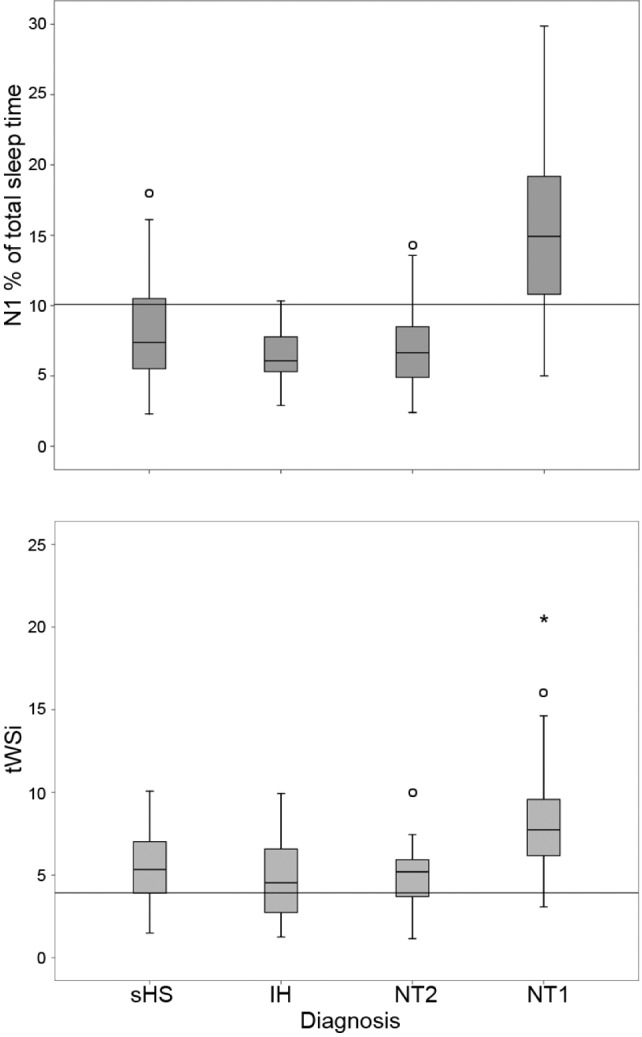
Boxplot of the percentage of total sleep time spent in N1 sleep (upper panel) and of the transitional index between wakefulness and sleep (tWSi, lower panel) in the different diagnostic groups. The bottom and top of the box represent the first and third quartiles, the band inside the box is the median, ends of the whiskers are the minimum and maximum, and the vertical line the cutoff used for the nocturnal polysomnographic score. IH, idiopathic hypersomnia; NT1, narcolepsy type 1; NT2, narcolepsy type 2; sHS, subjective hypersomnolence; tWSi, transitional index between wakefulness and sleep.
The sleep onset period disclosed the following differences among groups: (1) NT1 had shortest absolute latencies to N1; (2) NT1 had shorter absolute latencies to REM than sHS and IH, and NT2 had shorter absolute latency to REM than sHS, without any significant difference between NT1 and NT2; and (3) the sleep stage sequence N1 or W-REM was more represented in NT1, without differing from NT2.
The sleep parameters expressing the dynamic fluctuations among states were the time spans spent continuously in each stage and the transitional rates. In terms of time continuously spent in each sleep stage, NT1 patients showed more N1 than all other groups. In parallel, all the transitional indexes were highest in NT1 (Figure 1).
The evaluation of daytime PSG data showed that: (1) NT1 had more naps than sHS and NT2; (2) the number of SOREMPs was highest in NT1, intermediate in NT2, and comparable between sHS and IH; and (3) TST, time spent in REM, N1, and N3 were highest in NT1.
Integrated PSG Marker for NT1: ROC Curve Analyses
ROC curve analyses were performed separately for nocturnal and daytime PSG data in order to compare the diagnostic reliability of nocturnal sleep parameters that showed low internight variability and best discriminated among groups versus well-established daytime PSG markers (i.e., SOREMPs at MSLT – gold standard, and daytime continuous PSG) to identify NT1. Nocturnal SOREMP occurrence was included despite its variability in sHS given previous evidences and current diagnostic criteria1,7; SE, WASO, and Awk were not included for the potential type 1 error (high SE for IH inclusion criteria).
ROC curve analysis on nPSG data included the occurrence of SOREMP (absence or presence, coded as 0 or 1, respectively), the percentage of TST spent in N1, the time spent in N1, the time continuously spent in N1, the SSI, and the transitional indexes (Table 3, top). All parameters showed significant areas under the ROC curves with the following progressive order: SOREMP, SSI, tW-NR-R index, tW-N1-NR-R index, tW-S index, Stable N1 (min), N1 (min), N1 % (of TST) (Table 3, Figure S1, supplemental material).
Table 3.
Receiver operating curve analysis results.
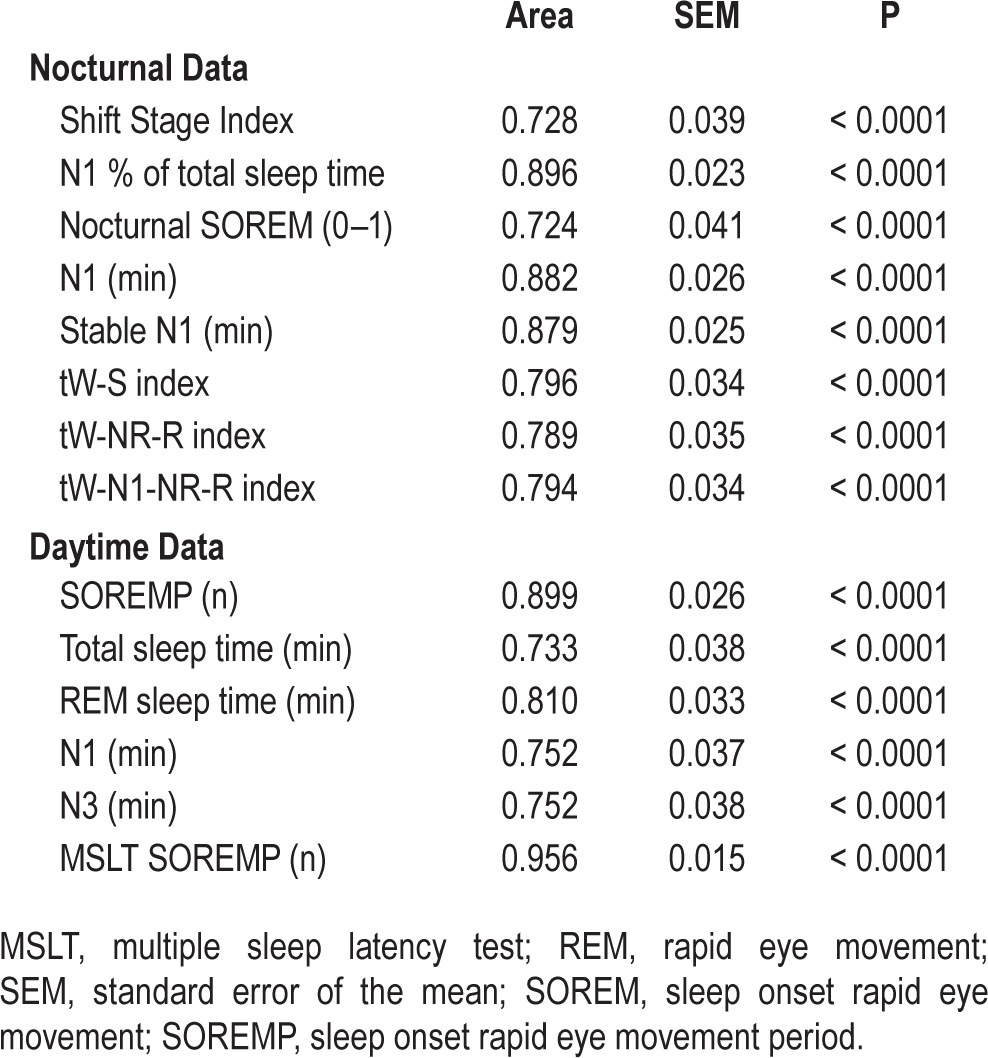
ROC curve analysis on daytime continuous PSG data included number of SOREMPs, TST (min), time spent in REM, in N1, in N3 (min) and number of SOREMPs at the MSLT (Table 3, bottom). As expected,17 the total number of SOREMPs at daytime continuous PSG recording (area of 0.899) and at the MSLT (area of 0.956) showed the best sensitivity/specificity profile to identify NT1 (Table 3, Figure S1).
Among nocturnal parameters we then selected the most significant in terms of timing spent in N1 (N1 % of TST) and of transitional indexes (tW-Si) to avoid redundant predictors of NT1, and we applied different cutoffs to increase the sensitivity/specificity profile of a combined nPSG score inclusive of SOREMP occurrence with ROC curve analyses. The combined score was obtained by adding a point for the following variables and cutoffs: N1 > 10.1 % of TST, sensitivity of 81% and specificity of 80%; tW-Si > 3.92, sensitivity of 96% and specificity of 31%; and SOREMP occurrence, sensitivity of 50% and specificity of 95%. The combined score thus ranged from 0 to 3, and showed improved diagnostic reliability compared to each single nocturnal sleep parameter and obtained an area under the curve of 0.903 (Figure 2). According to ROC curve analysis the combined nPSG score would have a sensitivity of 92% with a specificity of 80% with a cutoff ≥ 2 to identify NT1.
Figure 2.
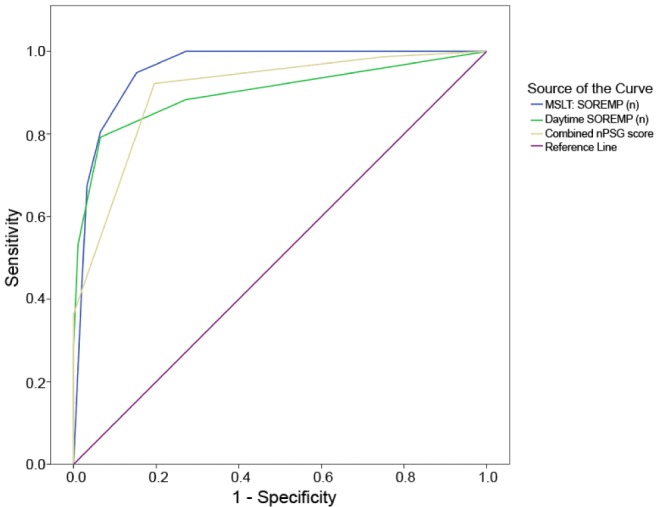
Receiving operating characteristic curves of the nocturnal polysomnographic (nPSG) score and sleep onset rapid eye movement periods (SOREMPs) at daytime polysomnography and at the multiple sleep latency test (MSLT) to identify narcolepsy type 1.
Finally, the combined score was also tested for the differential diagnosis between NT2 and NT1 and showed an area under the ROC curve of 0.894 (standard error of the mean = 0.039, P < 0.0001) and the cutoff ≥ 2 had a sensitivity of 92% with a specificity of 77% to identify NT1 versus NT2.
We additionally performed exploratory ROC curve analyses on the data of the first nPSG, and we confirmed that the combination of a transitional index (tW-Si, area of 0.809; tW-NR-Ri, area of 0.796; or tW-N1-NR-Ri, area of 0.780) with a measure of the time spent in N1 (N1 min, area of 0.880; stable N1 min, area of 0.875; or N1 % of TST, area of 0.546) and with the occurrence of SOREMP (area of 0.656) could lead to results overlapping those obtained from the second nocturnal recording.
DISCUSSION
We analyzed nocturnal sleep macrostructure together with parameters directly derived from conventional visual sleep scoring that express the dynamic fluctuations among behavioral states in our mixed CDH population and we obtained the following main results: (1) most of the sleep macrostructure and dynamics parameters were stable across the 2 nights in the different diagnostic groups; (2) NT1 was most strikingly distinguished by macrostuctural descriptors, especially SOREMP occurrence, and higher representation of N1; (3) the transitional rates among sleep states further differentiated CDH; and (4) we also found that the combined use of SOREMP occurrence, of the time spent in N1, and of a high transitional index between wakefulness and sleep is a reliable screening tool to identify NT1 with a diagnostic sensitivity/specificity profile close to SOREMPs count at the MSLT or at daytime PSG. Compared to previous studies, we evaluated sleep stage transitions and sleep onset profile in different groups of patients with CDH and implemented this approach by considering also the time spent continuously in each sleep stage.
We found a small night-to-night variability in most groups of patients with CDH. The first night effect is a well-established phenomenon reflecting the need for an adaptation to sleep in the laboratory setting leading to lower TST and SE in the first night, and is especially prominent in normal subjects and patients with insomnia.20 Scarce data are available in the field of CDH. Indeed, this finding allowed the subsequent use of sleep parameters not affected by internight variability and best identifying NT1 as potential diagnostic markers (ROC curve analysis). While confirming previous data on the reliability of nocturnal SOREMP occurrence as a good screening tool for NT1,7 we highlight that it also appeared stable across 2 nights in narcoleptic patients. We also confirm the previous observation on the most frequently represented direct transition from N1 or W to SOREMP in NT1 nocturnal sleep,10 a piece of evidence that, however, did not seem to add significant diagnostic confidence in the CDH populations we explored. Previous studies on sleep stage sequence analysis highlighted that the N1/W to REM sleep transition on the MSLT distinguished narcolepsy from insufficient sleep syndrome,8,9 a patient population that was not explored in our study, however. Acknowledging that in clinical practice most laboratories do not have the liberty of collecting 2 consecutive nights and with the aim of searching for a less time- and resource-intense protocol as screening tool compared to the standard PSG + MSLT approach, we also verified that data from the first (adaptation) night could provide comparable results.
We found increased transitional rates among states in NT1. Our findings are in line with the previous study that showed increased transitions among patients with narcolepsy in those with hypocretin-deficiency and/or cataplexy,12 and further extend the validity of this approach to CDH differential diagnosis out of the narcolepsy disease spectrum.21 High transitional rates of sleep instability have been also associated with “restless and light sleep” complaints in the general population.22 The high transitional rates of NT1 patients also support the frequent complaint of disturbed nocturnal sleep23 as a result of the disruption of hypocretin neurons. Current models of sleep regulation, indeed, suggest that hypocretin neurotransmission not only promotes wakefulness and suppresses REM sleep, but also stabilizes wakefulness or sleep after one of these states has been reached through a flip-flop switch.24 Previous studies showed an increased transitional rate also in patients with sleep disordered breathing,25,26 or with fibromyalgia independently from coexistent chronic fatigue syndrome.27 Albeit in our study significant sleep disordered breathing was ruled out thus not potentially affecting results, the parallel finding in fibromyalgia is of interest. Indeed, it has recently been shown that one third of NT1 patients versus 18% of controls suffer from chronic pain,28 and a common underlying pathophysiology may in part explain the similar high transitional rates found in both NT1 and fibromyalgia patients.
We also explored for the first time the stability of each state during the night, and NT1 patients showed more time continuously spent in N1. We believe that the high representation of stable N1 across the night fits with the conceptual framework of inefficient sleep switch in hypocretin-deficient patients,24 thus leading to longer periods spent in a condition between definite sleep and wakefulness.29
Finally, combining three highly discriminating PSG parameters (SOREMP occurrence, high tW-Si, and high percentage of TST spent in N1) into a single score further increased the potential of nPSG to identify NT1 to a level closer to daytime SOREMP counts at the MSLT and daytime continuous PSG monitoring.1–3,17 The use of a score including state transitions and a measure of time spent in N1 together with SOREMP occurrence can be of help in the field of sleep medicine to confirm NT1 that is clinically suspected, especially when a history of doubtful cataplexy is reported and cerebrospinal hypocretin-1 measurements are not available. Indeed, cataplexy mimicry has been documented also in NT1 and NT2 patients,30,31 and can become a diagnostic challenge when the clinical assessment yields ambiguous responses (such as in our clinical practice) or in cases of malingering.
Further studies on larger case series also including other sleep disorders are warranted to confirm the potential diagnostic value of this score and optimize its cutoffs. While acknowledging the poor test-retest reliability of the MSLT on several CDH diagnoses (IH, NT2, and sHS, the latter also showing higher inter-night SOREMP variability),32 we emphasize that it could not influence the goal of identifying hypocretin-deficient NT1 in our study design. In addition, in rare cases the change over time of MSLT features may reflect disease progression.33
CONCLUSIONS
nPSG contains a number of information of different complexity, ranging from sleep macrostructure and dynamics to sleep microstructure (e.g., cyclic alternating pattern), leg movement periodicity (e.g., periodicity index), and quantitative EEG and chin EMG features (e.g., spectral EEG analyses, atonia index). We showed that the combined use of parameters directly derived from sleep macrostructure and also assessing sleep dynamics showed good performance in identifying NT1. The combination of other more complex data may not only increase our disease knowledge, but could also improve diagnostic ability, leading to new perspectives useful in the epidemiological setting.4,21 This course of action will allow sleep medicine specialists and researchers to reach a higher number of data at the clinical and epidemiological levels, applying relatively simple measures commonly used in routine practice worldwide.
DISCLOSURE STATEMENT
This was not an industry supported study. Dr. Mignot has received research support from GSK, Jazz, and Sunovion; has consulted for ALPCO, Jazz, Novo Nordisk, Reset, Merck, INC, and ResMed; and is on the speakers' bureau for the Federal Trade Commission, Dr. Plazzi has consulted for UCB and Jazz. The other authors have indicated no financial conflicts of interest.
SUPPLEMENTAL MATERIAL
Receiving operating characteristic curves of the nocturnal (upper panel) and daytime (lower panel) polysomnographic parameters to identify narcolepsy type 1 (NT1). MSLT, multiple sleep latency test; REM, rapid eye movement; SOREMPs, sleep onset rapid eye movement periods; TST, total sleep time; tW-NR-Ri, transition index between wakefulness, nonrapid eye movement, and rapid eye movement sleep.
Polysomnographic data of the two nocturnal recordings of each diagnostic group and statistical comparison.
REFERENCES
- 1.American Academy of Sleep Medicine. International classification of sleep disorders. 3rd ed. Darien, IL: American Academy of Sleep Medicine; 2014. [Google Scholar]
- 2.Arand D, Bonnet M, Hurwitz T, Mitler M, Rosa R, Sangal RB. The clinical use of the MSLT and MWT. Sleep. 2005;28:123–44. doi: 10.1093/sleep/28.1.123. [DOI] [PubMed] [Google Scholar]
- 3.Littner MR, Kushida C, Wise M, et al. Practice parameters for clinical use of the multiple sleep latency test and the maintenance of wakefulness test. Sleep. 2005;28:113–21. doi: 10.1093/sleep/28.1.113. [DOI] [PubMed] [Google Scholar]
- 4.Longstreth WT, Jr, Koepsell TD, Ton TG, Hendrickson AF, van Belle G. The epidemiology of narcolepsy. Sleep. 2007;30:13–26. doi: 10.1093/sleep/30.1.13. [DOI] [PubMed] [Google Scholar]
- 5.Poli F, Overeem S, Lammers GJ, et al. Narcolepsy as an adverse event following immunization: case definition and guidelines for data collection, analysis and presentation. Vaccine. 2013;31:994–1007. doi: 10.1016/j.vaccine.2012.12.014. [DOI] [PubMed] [Google Scholar]
- 6.Plazzi G, Serra L, Ferri R. Nocturnal aspects of narcolepsy with cataplexy. Sleep Med Rev. 2008;12:109–28. doi: 10.1016/j.smrv.2007.08.010. [DOI] [PubMed] [Google Scholar]
- 7.Andlauer O, Moore H, Jouhier L, et al. Nocturnal rapid eye movement sleep latency for identifying patients with narcolepsy/hypocretin deficiency. JAMA Neurol. 2013;70:891–902. doi: 10.1001/jamaneurol.2013.1589. [DOI] [PMC free article] [PubMed] [Google Scholar]
- 8.Marti I, Valko PO, Khatami R, Bassetti CL, Baumann CR. Multiple sleep latency measures in narcolepsy and behaviourally induced insufficient sleep syndrome. Sleep Med. 2009;10:1146–50. doi: 10.1016/j.sleep.2009.03.008. [DOI] [PubMed] [Google Scholar]
- 9.Drakatos P, Suri A, Higgins SE, et al. Sleep stage sequence analysis of sleep onset REM periods in the hypersomnias. J Neurol Neurosurg Psychiatry. 2013;84:223–7. doi: 10.1136/jnnp-2012-303578. [DOI] [PubMed] [Google Scholar]
- 10.Drakatos P, Kosky CA, Higgins SE, Muza RT, Williams AJ, Leschziner GD. First rapid eye movement sleep periods and sleep-onset rapid eye movement periods in sleep-stage sequencing of hypersomnias. Sleep Med. 2013;14:897–901. doi: 10.1016/j.sleep.2013.03.021. [DOI] [PubMed] [Google Scholar]
- 11.Parrino L, Ferri R, Bruni O, Terzano MG. Cyclic alternating pattern (CAP): the marker of sleep instability. Sleep Med Rev. 2012;16:27–45. doi: 10.1016/j.smrv.2011.02.003. [DOI] [PubMed] [Google Scholar]
- 12.Sorensen GL, Knudsen S, Jennum P. Sleep transitions in hypocretindeficient narcolepsy. Sleep. 2013;36:1173–7. doi: 10.5665/sleep.2880. [DOI] [PMC free article] [PubMed] [Google Scholar]
- 13.Diniz Behn CG, Klerman EB, Mochizuki T, Lin SC, Scammell TE. Abnormal sleep/wake dynamics in orexin knockout mice. Sleep. 2010;33:297–306. doi: 10.1093/sleep/33.3.297. [DOI] [PMC free article] [PubMed] [Google Scholar]
- 14.Moghadam KK, Pizza F, La Morgia C, et al. Narcolepsy is a common phenotype in HSAN IE and ADCA-DN. Brain. 2014;137:1643–55. doi: 10.1093/brain/awu069. [DOI] [PubMed] [Google Scholar]
- 15.Plazzi G, Tonon C, Rubboli G, et al. Narcolepsy with cataplexy associated with holoprosencephaly misdiagnosed as epileptic drop attacks. Mov Disord. 2010;25:788–90. doi: 10.1002/mds.23008. [DOI] [PubMed] [Google Scholar]
- 16.Johns MW. A new method for measuring daytime sleepiness: the Epworth sleepiness scale. Sleep. 1991;14:540–5. doi: 10.1093/sleep/14.6.540. [DOI] [PubMed] [Google Scholar]
- 17.Pizza F, Moghadam KK, Vandi S, et al. Daytime continuous polysomnography predicts MSLT results in hypersomnias of central origin. J Sleep Res. 2013;22:32–40. doi: 10.1111/j.1365-2869.2012.01032.x. [DOI] [PubMed] [Google Scholar]
- 18.Iber C, Ancoli-Israel S, Chesson A, Quan SF for the American Academy of Sleep Medicine. Westchester, IL: American Academy of Sleep Medicine; 2007. The AASM Manual for the Scoring of Sleep and Associated Events: Rules, Terminology and Technical Specifications, 1st ed. [Google Scholar]
- 19.Han F, Lin L, Schormair B, et al. HLA DQB1*06:02 negative narcolepsy with hypocretin/orexin deficiency. Sleep. 2014;37:1601–8. doi: 10.5665/sleep.4066. [DOI] [PMC free article] [PubMed] [Google Scholar]
- 20.Newell J, Mairesse O, Verbanck P, Neu D. Is a one-night stay in the lab really enough to conclude? First-night effect and night-to-night variability in polysomnographic recordings among different clinical population samples. Psychiatry Res. 2012;200:795–801. doi: 10.1016/j.psychres.2012.07.045. [DOI] [PubMed] [Google Scholar]
- 21.Plazzi G, Pizza F. Sleep dynamics beyond traditional sleep macrostructure. Sleep. 2013;36:1123–4. doi: 10.5665/sleep.2864. [DOI] [PMC free article] [PubMed] [Google Scholar]
- 22.Laffan A, Caffo B, Swihart BJ, Punjabi NM. Utility of sleep stage transitions in assessing sleep continuity. Sleep. 2010;33:1681–6. doi: 10.1093/sleep/33.12.1681. [DOI] [PMC free article] [PubMed] [Google Scholar]
- 23.Dauvilliers Y, Arnulf I, Mignot E. Narcolepsy with cataplexy. Lancet. 2007;369:499–511. doi: 10.1016/S0140-6736(07)60237-2. [DOI] [PubMed] [Google Scholar]
- 24.Saper CB, Fuller PM, Pedersen NP, Lu J, Scammell TE. Sleep state switching. Neuron. 2010;68:1023–42. doi: 10.1016/j.neuron.2010.11.032. [DOI] [PMC free article] [PubMed] [Google Scholar]
- 25.Bianchi MT, Cash SS, Mietus J, Peng CK, Thomas R. Obstructive sleep apnea alters sleep stage transition dynamics. PLoS One. 2010;5:e11356. doi: 10.1371/journal.pone.0011356. [DOI] [PMC free article] [PubMed] [Google Scholar]
- 26.Swihart BJ, Caffo B, Bandeen-Roche K, Punjabi NM. Characterizing sleep structure using the hypnogram. J Clin Sleep Med. 2008;4:349–55. [PMC free article] [PubMed] [Google Scholar]
- 27.Kishi A, Natelson BH, Togo F, Struzik ZR, Rapoport DM, Yamamoto Y. Sleep-stage dynamics in patients with chronic fatigue syndrome with or without fibromyalgia. Sleep. 2011;34:1551–60. doi: 10.5665/sleep.1396. [DOI] [PMC free article] [PubMed] [Google Scholar]
- 28.Dauvilliers Y, Bayard S, Shneerson JM, Plazzi G, Myers AJ, Garcia-Borreguero D. High pain frequency in narcolepsy with cataplexy. Sleep Med. 2011;12:572–7. doi: 10.1016/j.sleep.2011.01.010. [DOI] [PubMed] [Google Scholar]
- 29.De Gennaro L, Ferrara M, Bertini M. The boundary between wakefulness and sleep: quantitative electroencephalographic changes during the sleep onset period. Neuroscience. 2001;107:1–11. doi: 10.1016/s0306-4522(01)00309-8. [DOI] [PubMed] [Google Scholar]
- 30.Plazzi G, Khatami R, Serra L, Pizza F, Bassetti CL. Pseudocataplexy in narcolepsy with cataplexy. Sleep Med. 2010;11:591–4. doi: 10.1016/j.sleep.2010.03.004. [DOI] [PubMed] [Google Scholar]
- 31.Pizza F, Vandi S, Poli F, et al. Narcolepsy with cataplexy mimicry: the strange case of two sisters. J Clin Sleep Med. 2013;9:611–2. doi: 10.5664/jcsm.2764. [DOI] [PMC free article] [PubMed] [Google Scholar]
- 32.Trotti LM, Staab BA, Rye DB. Test-retest reliability of the multiple sleep latency test in narcolepsy without cataplexy and idiopathic hypersomnia. J Clin Sleep Med. 2013;9:789–95. doi: 10.5664/jcsm.2922. [DOI] [PMC free article] [PubMed] [Google Scholar]
- 33.Pizza F, Vandi S, Liguori R, Parchi P, Avoni P, Mignot E, Plazzi G. Primary progressive narcolepsy type 1: the other side of the coin. Neurology. 2014;83:2189–90. doi: 10.1212/WNL.0000000000001051. [DOI] [PMC free article] [PubMed] [Google Scholar]
Associated Data
This section collects any data citations, data availability statements, or supplementary materials included in this article.
Supplementary Materials
Receiving operating characteristic curves of the nocturnal (upper panel) and daytime (lower panel) polysomnographic parameters to identify narcolepsy type 1 (NT1). MSLT, multiple sleep latency test; REM, rapid eye movement; SOREMPs, sleep onset rapid eye movement periods; TST, total sleep time; tW-NR-Ri, transition index between wakefulness, nonrapid eye movement, and rapid eye movement sleep.
Polysomnographic data of the two nocturnal recordings of each diagnostic group and statistical comparison.