

Abstract
Study Objectives:
Arousal intensity and heart rate (HR) response to arousal during polysomnography (PSG) vary considerably between patients with sleep disorders. Our objective was to determine the range of these arousal characteristics in healthy young adults and whether they are consistent on repeated testing.
Design:
Post hoc analysis of 56 preexisting PSG files recorded from 28 healthy adults on 2 consecutive nights.
Setting:
Academic medical center and Research and Development Laboratory (YRT Limited, Winnipeg, Manitoba, Canada).
Participants:
Twenty-eight healthy young adults.
Interventions:
None.
Measurements and Results:
Arousals were identified using an automatic system followed by manual editing. The intensity of arousals was scaled (between 0 and 9) using an automatic algorithm based on the change in the electroencephalography (EEG) signals' wavelet characteristics. 4,751 arousals in 28 pairs of PSGs (night 1 and night 2) were scaled. HR responses (ΔHR) to all arousals were determined and averaged at each arousal scale per file. Overall average arousal intensity ranged 3.0–7.1 in different subjects, and average ΔHR ranged 1.9–18.3 beats.min−1. Heart rate response at a given arousal intensity, expressed as ΔHR at a moderate arousal scale of 5.0 (ΔHR5), ranged 4.1–18.1 beats.min−1. There was a strong correlation between arousal intensity and ΔHR within each subject. More importantly, there were excellent intraclass correlations (ICC) between night 1 and night 2 results for all three variables (ICC = 0.72 for average intensity, 0.92 for average ΔHR4, and 0.91 for ΔHR5).
Conclusions:
Average arousal intensity and heart rate response to arousal are highly variable among healthy young adults and stable within individuals.
Citation:
Azarbarzin A, Ostrowski M, Younes M, Keenan BT, Pack AI, Staley B, Kuna ST. Arousal responses during overnight polysomnography and their reproducibility in healthy young adults. SLEEP 2015;38(8):1313–1321.
Keywords: arousal, EEG, heart rate, night-to-night
INTRODUCTION
Arousals from sleep are very common in patients with sleep disorders. Frequent arousals from sleep cause sleep fragmentation leading to impaired cognitive function1–4 and may also contribute to chronic hypertension in patients with obstructive sleep apnea (OSA).5–7 Arousals from sleep are also associated with a transient autonomic reflex activation that increases ventilation, blood pressure, and heart rate (HR).8–12
Arousals are conventionally scored according to the American Academy of Sleep Medicine (AASM) criteria, which require an abrupt shift in electroencephalography (EEG) to higher frequencies for at least 3 sec preceded by at least 10 sec of stable sleep.13,14 The visual appearance of cortical arousals meeting this definition varies considerably within and between subjects. We have recently developed an automatic scaling algorithm to score the intensity of arousals between 0 (no relative change in EEG characteristic) and 9 (the most intense arousal). The wavelet transform15,16 was used to quantify the change in EEG time and frequency characteristics due to arousal. We have shown that average arousal intensity, so quantified, varies considerably between subjects with sleep disorders. Furthermore, there was an excellent correlation between intensity of arousal and average HR response within each subject while the slope of relationship varied considerably between subjects.17 As indicated previously,17 these interindividual differences in average arousal intensity and in HR response to arousals may indicate different susceptibility to the development of cardiovascular complications of sleep disorders. Such a possibility is worthy of clinical investigation. However, before such studies can be undertaken, it is necessary to obtain additional information about the robustness of the automated analysis used previously17 and the methodological requirements for such studies.
Accordingly, the objectives of the current study were to determine whether the automated algorithms developed from data obtained in patients with sleep disorders continue to function adequately in another group of subjects; whether average arousal intensity and HR response to arousal are also variable among healthy young adults; the normal range of responses for use as a reference in future clinical studies; and whether these responses are consistent on repeated testing. All arousals that met AASM criteria14 were identified from two sets of polysomnography (PSG) files recorded from healthy young adults over 2 consecutive nights. The intensity of arousals, and HR response to different arousal intensities, were determined and compared between the 2 nights. The results show that average arousal intensity and average HR response to a given arousal intensity are highly variable among subjects and stable within individuals.
METHODS
PSG Files
The PSG files (56 in total from 28 subjects) used in this study were a subset of files generated in relation to a previous study on heritability of response to sleep deprivation.18 The original study was approved by the Institutional Review Boards at the University of Pennsylvania and the subcontracted sites, the University of Chicago and Virginia Commonwealth University. Written informed consent was obtained from each participant.
The PSGs examined in the current study were recorded at the University of Pennsylvania during 2 consecutive in-laboratory nights preceding the onset of a 36-h sleep deprivation protocol. They contained four EEG signals (C3M2, C4M1, O1M2, O2M1), bilateral electrooculogram, chin muscle electromyogram (EMG), and electrocardiogram (lead 1). Significant sleep pathology was excluded during a screening full PSG study performed at least 2 weeks prior to the sleep deprivation protocol (see Kuna et al.18 for details).
The files were scored for conventional sleep variables by the automatic system that has been developed at YRT Limited (Winnipeg, Manitoba, Canada) and validated in an independent multicenter study.19 As described previously,19 the software scans periods scored as rapid eye movement (REM) or nonrapid eye movement (NREM) sleep for alpha/sigma power, beta power, chin EMG, HR, and respiratory amplitude. A significant increase in alpha/sigma power and/or beta power relative to adjacent regions that lasts > 3 sec is scored as a potential arousal. The potential arousal is confirmed if (1) the increase in [normalized alpha/sigma * normalized beta] exceeds a threshold value, or (2) the potential arousal is associated with a significant increase in a product that combines normalized values of HR, chin EMG, and respiratory amplitude. For arousals in REM sleep an increase in chin EMG is also a requirement. In this fashion, and according to the 2007 AASM criteria,14 an increase in high-frequency power is essential but marginal increases in high-frequency power may or not be scored depending on the presence of other findings typically associated with arousals. The automatic scoring was manually edited by an experienced PSG technologist (MO). Incorrectly identified arousals were deleted while arousals that were missed by the automatic system were added. The exact onsets and ends of arousals were also adjusted, if necessary.
Analyses
Arousal Scaling
The automatic scaling of arousal intensity used the wavelet transform, as described in detail previously.17 Briefly, the EEG signals during and before each arousal in NREM sleep were decomposed into five new signals (wavelet coefficients) using Daubechies wavelet transform.15 Fourteen different characteristics were derived from these five coefficient series. Depending on the magnitude of changes (during arousal versus before arousal) in these 14 characteristics, a scale from 0 to 9 (most intense) was given to each arousal by reference to a training data set containing the same features for 271 arousals whose intensity was visually scaled by MY. The wavelet characteristics and the training set used in the present study were identical to the ones used in the earlier study.17
When the arousal scale differed in the two central electrodes, the higher of the two values was used. No signal other than the EEG was used in this automatic process.
HR Measurement
The HR response to a given arousal (ΔHR) was determined as the difference between maximum HR during arousal (i.e., from arousal onset to 8 sec after end of arousal) and maximum baseline HR. The electrocardiogram signal was visually inspected in the relevant regions and sections that contained ec-topic beats or significant artifacts that precluded HR analysis were not used. Beat-by-beat HR in the interval 2 to 12 sec preceding the arousal was used as baseline HR. The 2 sec preceding arousal were avoided in baseline determination due to the observation that arousal-associated tachycardia may begin up to 2 sec before arousal.10
Statistics
For each file, we determined the total number of arousals and report the mean (standard deviation [SD]) values of arousal scale, arousal duration, and ΔHR values for each subject and night. In addition, ΔHR values for all arousals at each arousal scale were averaged after ignoring arousal intensities with only one observation. This was done to take account of the considerable variability in HR in successive measurements separated by several seconds in the absence of arousal (sham arousals), as described previously.17 The relationship between arousal scale and average ΔHR values during each night was examined using several complementary methods. First, we examined Pearson linear correlations between average ΔHR values and corresponding arousal scales; similar correlations were seen using Spearman correlation and, thus, only results with Pearson correlations will be reported. Second, we derived subject-specific slope and intercept estimates from separate linear regression models of mean ΔHR values against arousal severity score. Third, we fit a linear mixed model with random slope and intercept terms with ΔHR as the outcome and arousal score as a predictor, using all individual data points and accounting for within-subject correlation. Using the fixed and random coefficients from this model, we then calculated subject-specific slope and intercept values, as in the linear regression models. To ensure reliable estimates of the ΔHR response to given arousal intensity scales (e.g., ΔHR4, ΔHR5), values were obtained from subject specific-regression equations, rather than from the average of actual ΔHR values at each scale. We used intraclass correlation coefficient (ICC) estimates to assess the reproducibility/reliability of values obtained during separate nights within the same participant, including: number of arousals, average arousal duration, average arousal intensity, overall average ΔHR, and model derived estimates of slope, intercept, ΔHR4 and ΔHR5. Comparisons between night 1 and night 2 values were done using paired t tests (when comparing average estimates) or with linear mixed model (using all data points); as expected, results were similar using either methodology.
RESULTS
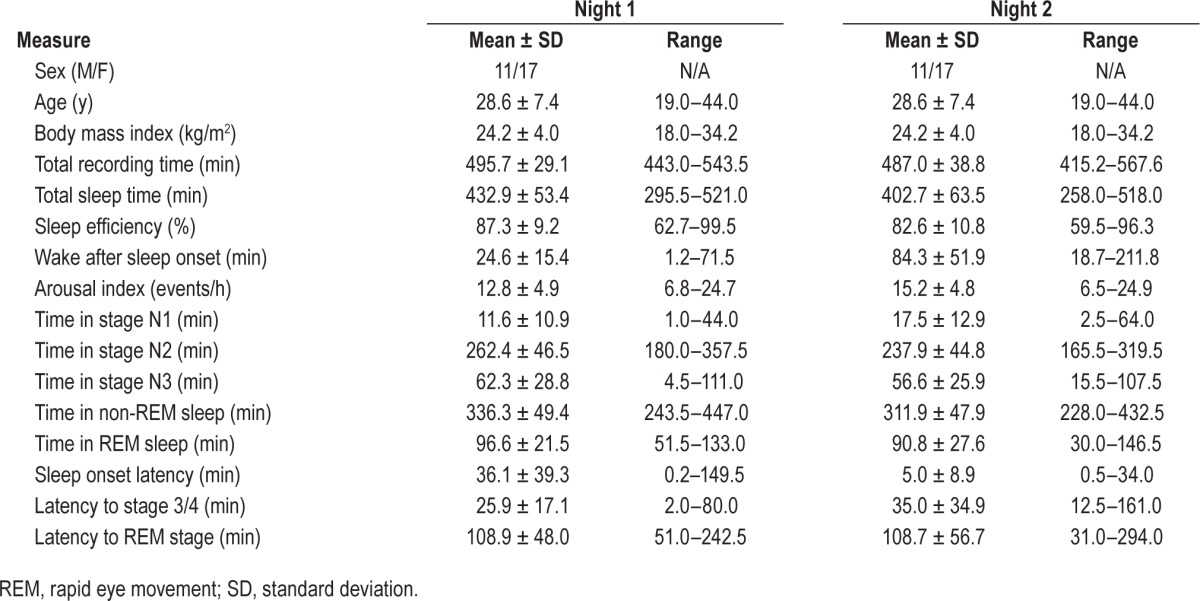
The participants were 17 female and 11 male adults with a body mass index of 24.2 ± 4.0 kg/m2 (range, 18–34). All of the participants had an apnea-hypopnea index and periodic limb movement index < 5 events/h on a full night diagnostic PSG that had been performed about 2 weeks previously. Table 1 shows the participants' characteristics and PSG results during nights 1 and 2.
Table 1.
Participant characteristics and polysomnogram results.
Characteristics of Arousals in Different Files
In total, 4,751 arousals were examined from which only three received a scale of 0. Figure 1 shows the relative frequency of different scales. There were two distinct peaks at scales 3 and 8, respectively. Scale 3 arousals were the most frequent, accounting for 26.5% of all arousals examined. Scale 1 arousals were the least frequent (excluding three arousals with scale 0), accounting for only 3.1% of all arousals.
Figure 1.
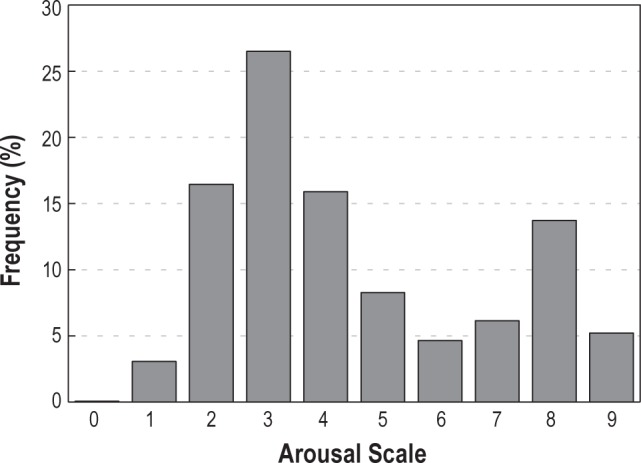
Frequency distribution of arousal intensity of all arousals examined.
Table 2 shows characteristics of arousals in individual files for nights 1 and 2. There were no significant differences (paired t test) between the two recordings in overall number of arousals (average difference [night 2 – night 1] = 2.1 arousals [SD = 22.5]; P = 0.637), average duration of arousals (mean difference = 0.06 sec [SD = 0.98]; P = 0.751), overall average HR response (mean difference = 0.46 beat.min−1 [SD = 1.82]; P = 0.190) or overall average arousal scale (mean difference = 0.14 [SD = 0.76]; P = 0.343).
Table 2.
Average duration and average intensity scale of arousals and average change in heart rate with arousal in night 1 and night 2.
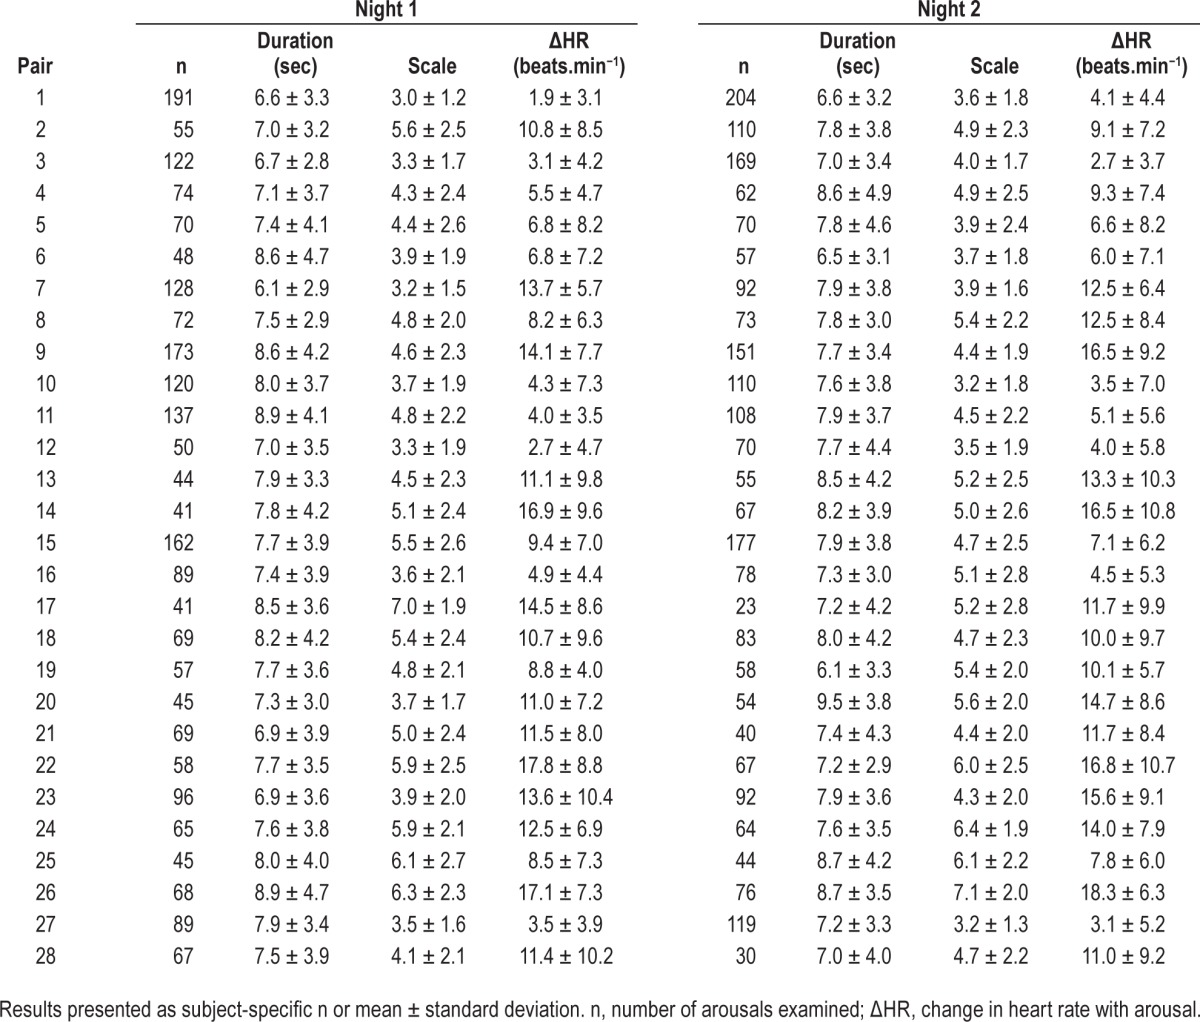
When comparing reproducibility of average measures between nights, we observed strong ICC values (ICC > 0.70) for all measures except arousal duration, indicating good reproducibility for our primary measures of interest. Specifically, there was good reproducibility in the number of arousals (range in different subjects: 23–204, ICC = 0.869), the average ΔHR (range, 1.9–18.3 beats.min−1, ICC = 0.922) and the average arousal intensity (range,: 3.0–7.1, ICC = 0.716). The observed ICC in the average arousal duration was only 0.099, although we note the range was relatively small (6.1 to 9.5 sec), and, as mentioned previously, there was not a statistically significant difference across nights (P = 0.751).
Reproducibility of the HR Response to Arousal
Figure 2 shows the HR response to arousal in a representative subject on night 1 (top panel) and night 2 (bottom panel). The solid line is the average response at different intensity scales and each dot is one or more arousals. For night 1, the relation between arousal scale and average ΔHR at the different scales in this subject was best fitted with a linear function: y = 1.5 × +1.1; r = 0.99. This was similar to the regression line for night 2: y = 1.6 × −0.6, r = 0.98. Table 3 shows the slope and intercept of regression lines fitted to the average responses for all pairs of recordings. There was a highly significant correlation between arousal scale and average HR responses in all files. Only one file in night 1 and six files in night 2 had a correlation coefficient of < 0.9, with the lowest coefficient being 0.76 (Table 3).
Figure 2.
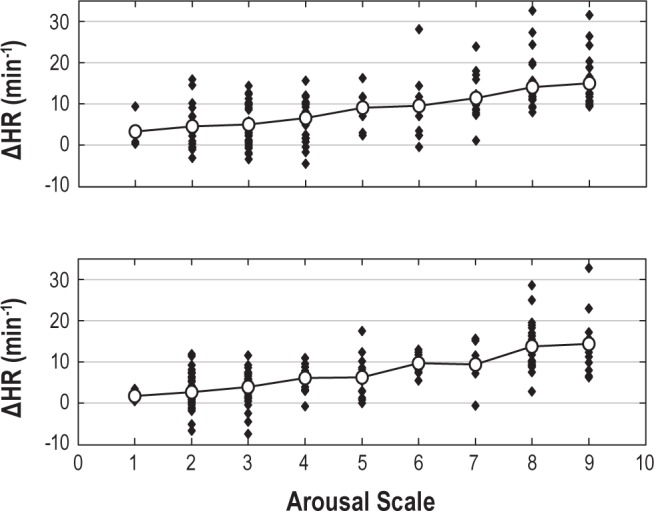
The change in heart rate (ΔHR) with arousals of different intensities in a representative subject. Top panel shows the HR response to arousal for recording made on day 1 and the bottom panel shows the HR response to arousal for recording made on day 2. Each solid dot is one or more arousals and the solid line shows the average HR response at each scale. The equations of best fitted regression lines to the average HR responses for 2 days are: Day 1: y = 1.5 × +1.1; r = 0.99; Day 2: y = 1.6 × −0.6, r = 0.98.
Table 3.
Subject-specific linear regression model of arousal severity predicting change in heart rate on night 1 and night 2.
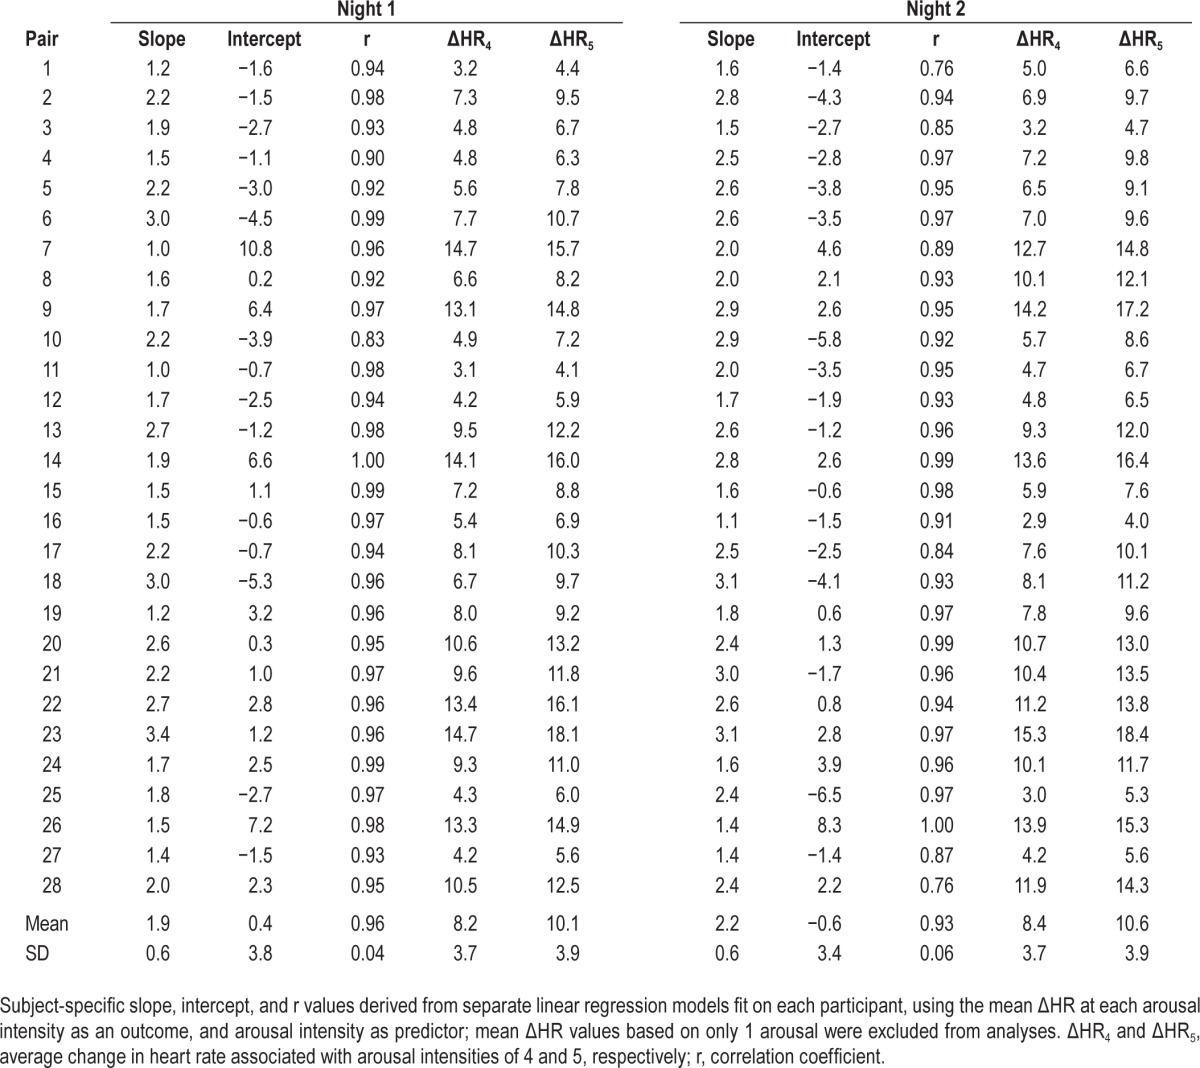
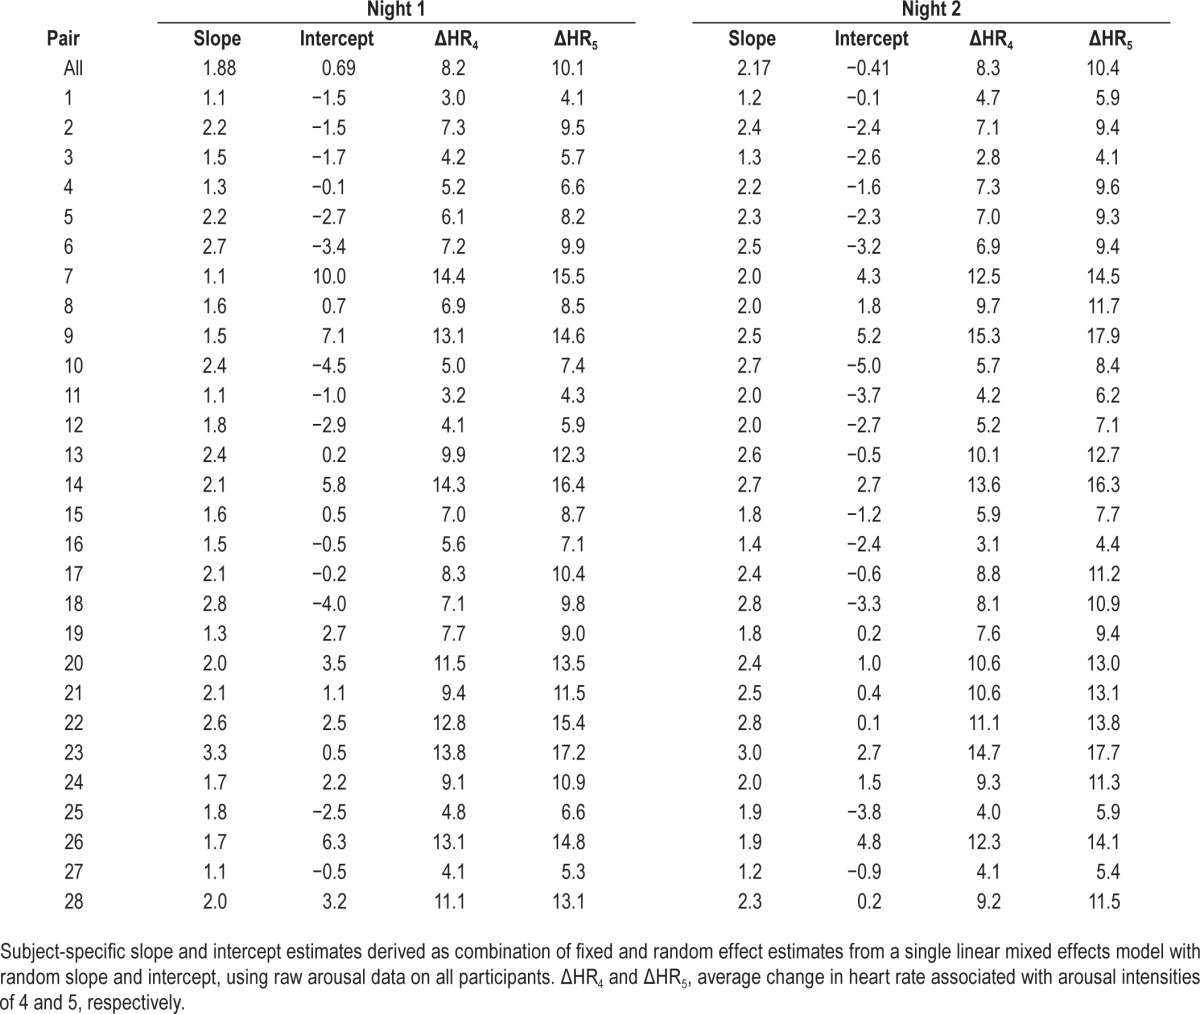
Table 4 shows the subject-specific slope and intercept values derived from our linear mixed regression model fit using all available arousals. We observed similar and significant associations between arousal intensity and ΔHR on both night 1 (β ± standard error = 1.88 ± 0.13, P < 0.0001) and night 2 (β ± standard error = 2.16 ± 0.12, P < 0.0001), such that for each one point increase in arousal intensity, we expect an average increase in ΔHR of approximately 2 beats/min. As expected, we observed similar subject specific estimates when using the linear mixed model to those obtained through the subject specific linear regression models (Table 3).
Table 4.
Subject-specific slope and intercept estimates from linear mixed model of arousal severity predicting change in heart rate on night 1 and night 2.
We subsequently examined the reproducibility of estimates derived based on our linear regression and mixed-model analyses. For linear regression models, we observed strong ICC values when examining the reproducibility of ΔHR4 (ICC = 0.93, Figure 3) and ΔHR5 (ICC = 0.91, Figure 3). Derived estimates of ΔHR were similarly reproducible based on the linear mixed models (ΔHR4 ICC = 0.93 and ΔHR5 ICC = 0.92). Estimates of the subject specific intercepts were similarly reproducible (ICC = 0.80 from linear model, ICC = 0.81 from mixed model) and slopes were moderately reliable from linear models (ICC = 0.59), but more reliable from linear mixed models (ICC = 0.67). Thus, subject-specific regression models and ΔHR estimates appear reproducible across multiple nights; the majority of variability observed in our estimates is due to between subject variability, rather than differences in repeated estimates within subjects.
Figure 3.

The reproducibility of heart rate (HR) response to arousals during 2 consecutive nights in 28 subjects. Top left panel: average arousal scale per file for night 1 versus night 2. Top right panel: average change in heart rate (ΔHR) per file for night 1 versus night 2. Bottom left panel: average ΔHR at scale 4 (ΔHR4) per file for night 1 versus night 2. Bottom right panel: average ΔHR at scale 5 (ΔHR5) per file for night 1 versus night 2. Each dot is one or more participants and the line is the best fitted regression line to the observations.
Figure 3 shows scatter plots of the different measures from night 1 and night 2. All correlations were highly significant (P < 0.00001).
DISCUSSION
The main findings from this study are: (1) similar to patients with sleep disorders,17 healthy young adults display a wide range of average arousal intensities and HR response to arousals; and (2) average arousal intensity and HR response to arousal are stable on repeat PSG testing.
Objective Measurement of Arousal Intensity and HR Response to Arousal
The current study provided an opportunity to validate the automated measurement of arousal intensity introduced by Azarbarzin et al.17 in a new data set. From a total of 4,751 arousals scored independently by an experienced certified technologist only three arousals (< 0.1% of arousals) were given a scale of 0. Furthermore, there was a strong and highly significant correlation between arousal scale and average HR response within each file (Table 3). These findings not only support the validity of the automated approach used but they also provide more evidence that HR response is related to arousal intensity. In addition, the wavelet features used and the training data set, remained unchanged in the current study and the results were in agreement with those of the original study,17 thereby suggesting that the original algorithm is insensitive to differences in recording techniques.
The change in HR from before to after the onset of arousal (ΔHR) incorporates the spontaneous variability in HR that is observed in the absence of arousal, which can be substantial. In our previous study17 we evaluated the effect of this spontaneous variability on ΔHR from the ΔHR observed in a number (10–14 per file) of sham arousals, where identical analysis was carried out on randomly selected periods during stable sleep. The SD of ΔHR was 2.6 ± 0.9 beats.min−1 with a range of 1.5 to 4.5 beats.min−1 among different files.17 Furthermore, we found that the range of ΔHR with these sham arousals was no different from the range observed with any arousal intensity.17 That the range of ΔHR observed at any arousal intensity is independent of arousal intensity, and reflects background HR variability, was also evident in the current study (e.g., note that the range of ΔHR at intensities 2 and 9 are similar in Figure 2). Thus, in order to measure the independent effect of arousal on HR it is necessary to obtain the average of a number of ΔHR values at each arousal intensity. With 16 observations at each intensity the average would be within 0.7 beats.min−1 of the true response, assuming an average SD of spontaneous ΔHR of 2.6 beats.min−1, and within 1.1 beats.min−1 of the true response, at the highest observed SD of 4.5 beats.min−1. Because it is often difficult to obtain such high numbers at several arousal intensities, an alternate approach is to report the ΔHR associated with a commonly observed arousal intensity (3, 4, or 5), where a large number of observations is almost always seen in a whole night study.
Arousal Intensity and HR Response to Arousals in Healthy Young Adults
The average intensity of arousals varied considerably among young, healthy adults (3 to 7, on a maximum scale of 9, Table 2). Likewise, the average HR response to a given arousal intensity varied over a wide range, from 4.1 to 18.1 beats.min−1, at an arousal intensity of 5 (ΔHR5, Table 3). The mechanism of these differences is not clear. Differences in average arousal intensity may be due to different intensity of arousal stimuli in different subjects or to different cortical response to the same arousal stimulus. Likewise, differences in HR response to a given arousal intensity may reflect differences in the magnitude of autonomic activation with arousal in different subjects or to different sensitivity of the heart's pacemaker to the same autonomic stimulus. Further studies are needed to clarify these mechanisms.
Reproducibility of Arousal Responses
Several previous studies have reported very little variability in the number of arousals and arousal index from night to night.20–24 In the current study we show that the average intensity of arousals and HR response to a given arousal intensity are also highly reproducible (Table 2 and Figure 3). This reproducibility and the very wide range of values among individuals (Tables 2, 3, and 4) clearly indicate that these responses represent a wide range of individual phenotypes. To the extent that average arousal intensity may contribute to development of cognitive complications related to arousal, and a greater HR response to a given arousal intensity may indicate a more la-bile cardiovascular system that is more susceptible to the development of hypertension, it may be useful to include these individual characteristics in studies that evaluate the mechanisms of various complications of sleep fragmentation. The demonstration that these responses are reproducible within subjects is reassuring in that it indicates that in such studies only one assessment is needed. Furthermore, considering the small night-to-night variability, fewer subjects would be needed in controlled studies that examine the effect of interventions (e.g. drugs, continuous positive airway pressure) on such arousal characteristics.
Arousal Characteristics in Normal Subjects Versus Patients with Sleep Disorders
Table 5 compares the demographic, clinical, and arousal features in the current normal subjects with those of the subjects of the previous study in which we used the same approach.17 There were relatively more females in the normal group (not significant). The current subjects were significantly younger, with a lower body mass index. Their sleep was of better quality as evidenced by higher sleep efficiency, less time in stage N1 and more time in stages N2 and N3, and a lower arousal index, and they were free of any sleep pathology.18 Despite these marked differences, the average arousal intensity was not significantly different (4.6 ± 1.1 versus 4.1 ± 0.7, P = 0.08). Furthermore, except for three normal subjects who had an average intensity between 6.0 and 7.0, the range of average intensity was remarkably similar, thereby suggesting that average arousal intensity is either not affected by any of the differences observed between the two groups (i.e., is a fixed property in each individual) or that these differences affect the average intensity in opposite directions. Further studies are needed to distinguish between these two possibilities.
Table 5.
Characteristics of normal subjects and subjects with sleep disorders.
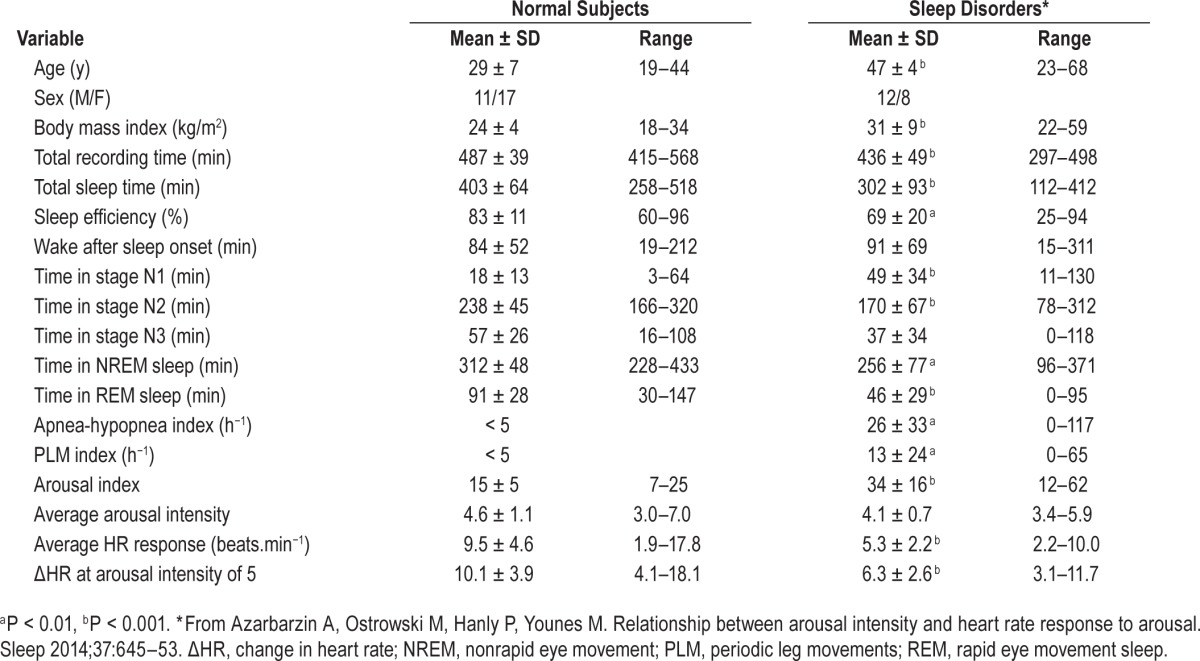
By contrast, whether expressed as average ΔHR or as HR response to a given arousal intensity, the HR response to arousal was significantly higher in the young healthy subjects. It is not clear whether this is a function of age difference in arousal responses25,26 or habituation to the more disturbed sleep in the patients with sleep disorders.
In summary, we found that both arousal intensity and HR response to arousal are quite variable between individuals, whether young and healthy or older and with sleep disorders. Furthermore, these arousal characteristics are reproducible on repeat testing. These findings suggest that arousal characteristics may represent a heritable trait. Further studies comparing the differences in responses between monozygotic and dizygotic twin pairs may help verify this possibility.
DISCLOSURE STATEMENT
This study was supported by YRT Limited, Winnipeg, Manitoba, Canada; NIH P50 HL060287; NIH 1P01-1HL094307. Dr. Younes is majority owner of YRT Ltd., and receives royalties from Covidien and Philips Respironics. Michele Ostrowski is part owner of YRT. Dr. Azarbarzin is currently employed by YRT. Dr Kuna has received grant support from Philips Respironics and has consulted for Vivus, Astra Zeneca, and Zephyr Sleep Technologies The other authors have indicated no financial conflicts of interest.
REFERENCES
- 1.Bonnet MH, Doghramji K, Roehrs T, et al. The scoring of arousal in sleep: reliability, validity, and alternatives. J Clin Sleep Med. 2007;3:133–45. [PubMed] [Google Scholar]
- 2.Colt HG, Haas H, Rich GB. Hypoxemia vs. sleep fragmentation as cause of excessive daytime sleepiness in obstructive sleep apnea. Chest J. 1991;100:1542–8. doi: 10.1378/chest.100.6.1542. [DOI] [PubMed] [Google Scholar]
- 3.Engleman HM, Kingshott RN, Martin SE, Douglas NJ. Cognitive function in the sleep apnea/hypopnea syndrome (SAHS) Sleep. 2000;23:S102–8. [PubMed] [Google Scholar]
- 4.Reynolds AC, Banks S. Total sleep deprivation, chronic sleep restriction and sleep disruption. Prog Brain Res. 2010;185:91–103. doi: 10.1016/B978-0-444-53702-7.00006-3. [DOI] [PubMed] [Google Scholar]
- 5.Davies CW, Crosby JH, Mullins RL, Barbour C, Davies RJ, Stradling JR. Case-control study of 24 hour ambulatory blood pres sure in patients with obstructive sleep apnoea and normal matched control subjects. Thorax. 2000;55:736–40. doi: 10.1136/thorax.55.9.736. [DOI] [PMC free article] [PubMed] [Google Scholar]
- 6.Nieto FJ, Young TB, Lind BK, et al. Association of sleep-dis ordered breathing, sleep apnea, and hypertension in a large community-based study. Sleep Heart Health Study. JAMA. 2000;283:1829–36. doi: 10.1001/jama.283.14.1829. [DOI] [PubMed] [Google Scholar]
- 7.Peppard PE, Young T, Palta M, Skatrud J. Prospective study of the association between sleep-disordered breathing and hyperten sion. N Engl J Med. 2000;342:1378–84. doi: 10.1056/NEJM200005113421901. [DOI] [PubMed] [Google Scholar]
- 8.Horner RL, Brooks D, Kozar LF, Tse S, Phillipson EA. Immediate effects of arousal from sleep on cardiac autonomic outflow in the absence of breathing in dogs. J Appl Physiol. 1995;79:151–62. doi: 10.1152/jappl.1995.79.1.151. [DOI] [PubMed] [Google Scholar]
- 9.Horner RL. Autonomic consequences of arousal from sleep: mechanisms and implications. Sleep. 1996;19:S193–5. doi: 10.1093/sleep/19.suppl_10.s193. [DOI] [PubMed] [Google Scholar]
- 10.Sforza E, Jouny C, Ibanez V. Cardiac activation during arousal in humans: further evidence for hierarchy in the arousal response. Clin Neurophysiol. 2000;111:1611–9. doi: 10.1016/s1388-2457(00)00363-1. [DOI] [PubMed] [Google Scholar]
- 11.Trinder J, Padula M, Berlowitz D, et al. Cardiac and respiratory activity at arousal from sleep under controlled ventilation conditions. J Appl Physiol. 2001;90:1455–63. doi: 10.1152/jappl.2001.90.4.1455. [DOI] [PubMed] [Google Scholar]
- 12.Trinder J, Allen N, Kleiman J, et al. On the nature of cardiovascular activation at an arousal from sleep. Sleep. 2003;26:543–51. [PubMed] [Google Scholar]
- 13.EEG arousals: scoring rules and examples: a preliminary report from the sleep disorders atlas task force of the American Sleep Disorders Association. Sleep. 1992;15:173–84. [PubMed] [Google Scholar]
- 14.Iber C, Ancoli-Israel S, Chesson AL, Jr, Quan SF. Westchester, IL: American Academy of Sleep Medicine; 2007. The AASM manual for the scoring of sleep and associated events. [Google Scholar]
- 15.Daubechies I. Philadelphia, PA: Society for Industrial and Applied Mathematics; 1992. Ten lectures on wavelets. [Google Scholar]
- 16.Grossmann A, Morlet J. Decomposition of Hardy functions into square integrable wavelets of constant shape. SIAM J Math Anal. 1984;15:723–36. [Google Scholar]
- 17.Azarbarzin A, Ostrowski M, Hanly P, Younes M. Relationship between arousal intensity and heart rate response to arousal. Sleep. 2014;37:645–53. doi: 10.5665/sleep.3560. [DOI] [PMC free article] [PubMed] [Google Scholar]
- 18.Kuna ST, Maislin G, Pack FM, et al. Heritability of performance deficit accumulation during acute sleep deprivation in twins. Sleep. 2012;35:1223–33. doi: 10.5665/sleep.2074. [DOI] [PMC free article] [PubMed] [Google Scholar]
- 19.Malhotra A, Younes M, Kuna ST, et al. Performance of an automated polysomnography scoring system versus computer-assisted manual scoring. Sleep. 2013;36:573–82. doi: 10.5665/sleep.2548. [DOI] [PMC free article] [PubMed] [Google Scholar]
- 20.Katz ES, Greene MG, Carson KA, et al. Night-to-night variability of polysomnography in children with suspected obstructive sleep apnea. J Pediatr. 2002;140:589–94. doi: 10.1067/mpd.2002.123290. [DOI] [PubMed] [Google Scholar]
- 21.Loredo JS, Clausen JL, Ancoli-Israel S, Dimsdale JE. Night-to-night arousal variability and interscorer reliability of arousal measurements. Sleep. 1999;22:916–20. doi: 10.1093/sleep/22.7.916. [DOI] [PubMed] [Google Scholar]
- 22.Milross MA, Piper AJ, Norman M, et al. Night-to-night variability in sleep in cystic fibrosis. Sleep Med. 2002;3:213–9. doi: 10.1016/s1389-9457(02)00030-8. [DOI] [PubMed] [Google Scholar]
- 23.Scholle S, Scholle HC, Kemper A, et al. First night effect in children and adolescents undergoing polysomnography for sleep-disordered breathing. Clin Neurophysiol. 2003;114:2138–45. doi: 10.1016/s1388-2457(03)00209-8. [DOI] [PubMed] [Google Scholar]
- 24.Sforza E, Chapotot F, Pigeau R, Buguet A. Time of night and first night effects on arousal response in healthy adults. Clin Neurophysiol. 2008;119:1590–9. doi: 10.1016/j.clinph.2008.03.010. [DOI] [PubMed] [Google Scholar]
- 25.Gosselin N, Michaud M, Carrier J, Lavigne G, Montplaisir J. Age difference in heart rate changes associated with micro-arousals in humans. Clin Neurophysiol. 2002;113:1517–21. doi: 10.1016/s1388-2457(02)00189-x. [DOI] [PubMed] [Google Scholar]
- 26.Goff EA, O'Driscoll DM, Simonds AK, Trinder J, Morrell MJ. The cardiovascular response to arousal from sleep decreases with age in healthy adults. Sleep. 2008;31:1009–17. [PMC free article] [PubMed] [Google Scholar]