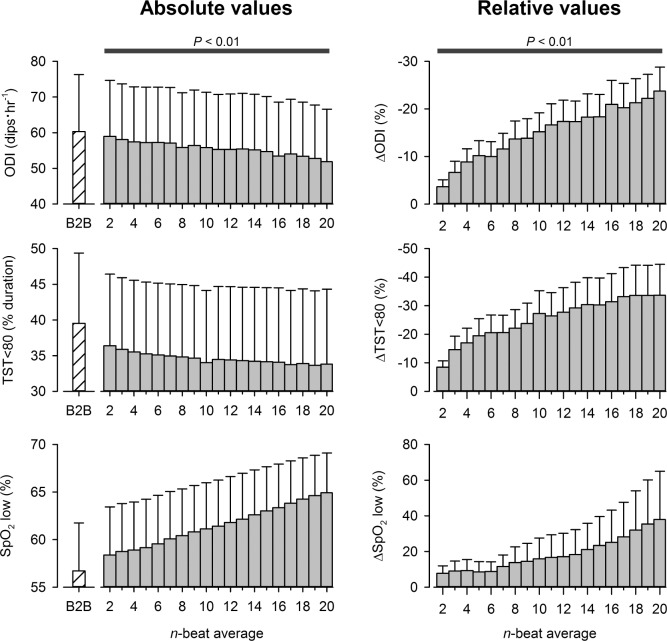
Figure 2.
The impact of averaging window-length on the “desaturation” indexes obtained during sleep at high-altitude. The black-bar denotes that all averaging windows ≥ 2 beats wide produced desaturation indexes that were significantly different from those obtained with the “artifact-free,” beat-to-beat SpO2 dataset, P < 0.01. ODI, oxygen desaturation index; TST < 80, total time spent below an arterial O2 saturation value of 80%; SpO2 low, the lowest SpO2 observed during sleep; B2B, beat-to-beat data; Δ, absolute change in value expressed relative (%) to B2B data.

