Abstract
Bone is a strong and tough material composed of apatite mineral, organic matter and water. Changes in composition and organization of these building blocks affect bone’s mechanical integrity. Skeletal disorders often affect bone’s mineral phase, either by variations in the collagen or directly altering mineralization. The aim of the current study was to explore the differences in the mineral of brittle and ductile cortical bone at the mineral (nm) and tissue (µm) levels using two mouse phenotypes. Osteogenesis imperfecta murine (oim−/−) mice were used to model brittle bone; PHOSPHO1 mutants (Phospho1−/−) had ductile bone. They were compared to their respective wild-type controls. Femora were defatted and ground to powder to measure average mineral crystal size using X-ray diffraction (XRD), and to monitor the bulk mineral to matrix ratio via thermogravimetric analysis (TGA). XRD scans were run after TGA for phase identification, to assess the fractions of hydroxyapatite and β-tricalcium phosphate. Tibiae were embedded to measure elastic properties with nanoindentation and the extent of mineralization with backscattered electron microscopy (qbSEM). Interestingly, the mineral of brittle oim−/− and ductile Phospho1−/− bones had many similar characteristics. Both pathology models had smaller apatite crystals, lower mineral to matrix ratio, and showed more thermal conversion to β-tricalcium phosphate than their wild-types, indicating deviations from stoichiometric hydroxyapatite in the original mineral. The degree of mineralization of the bone matrix was different for each strain: oim−/− were hypermineralized, while Phospho1−/− were hypomineralized. However, alterations in the mineral were associated with reduced tissue elastic moduli in both pathologies. Results revealed that despite having extremely different whole bone mechanics, the mineral of oim−/− and Phospho1−/− has several similar trends at smaller length scales. This indicates that alterations from normal crystal size, composition, and structure will reduce the mechanical integrity of bone.
Keywords: ANALYSIS/QUANTITATION OF BONE, Genetic animal models < ANIMAL MODELS, Matrix mineralization < BONE MATRIX, Osteogenesis imperfecta < DISEASES AND DISORDERS OF/RELATED TO BONE
1. INTRODUCTION
Cortical bone is a tough material; however, bone’s ability to resist fracture often deteriorates due to aging and/or skeletal diseases. The understanding of bone’s toughening mechanisms requires the interpretation of mechanical and structural properties at multiple scales (1–4). At the whole bone level (macro-scale), cortical bone is the dense bone in the diaphysis, and the hard outer shell of the epiphyses. At the tissue level (micro-scale), lamellar bone is built up of collagen fibers which are composed of collagen fibrils and mineral crystals (nano-scale). The constituent elements of bone material include apatite mineral, primarily impure forms of hydroxyapatite (HA);organic matter, composed of collagen and non-collagenous proteins; and water, which resides on the surface, within mineral crystals, and between collagen fibers.
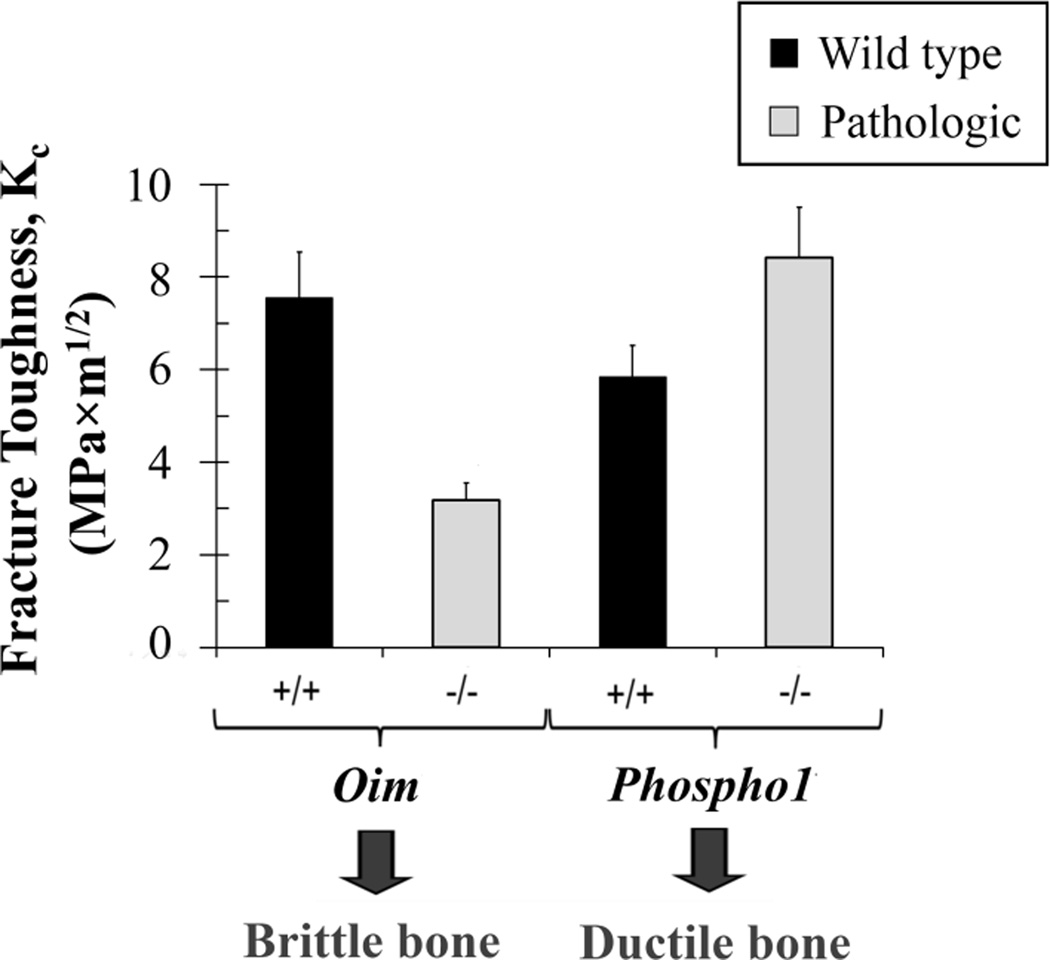
Due to this complex hierarchical structure, there are many determinants of fracture toughness. At the nano-scale, the composite nature of mineralized collagen fibrils, and thus the mineral and collagen as well as the interaction between them, contribute to bone toughening mechanisms (5,6). Although collagen is thought to play a major role in bone toughness (5–7), it is also known that bone mineral is altered in skeletal disorders which lead to bone brittleness (8–12).The objective of this study was to evaluate the mineral properties at the µm (tissue) and nm (mineral) length scales in brittle and ductile cortical bone. Two mouse phenotypes were chosen, based on known fracture toughness values (Fig. 1) to represent brittle and ductile bone (13,14).We used osteogenesis imperfecta murine (oim−/−) mice, which replicates the moderate to severe condition of osteogenesis imperfecta in humans. Osteogenesis imperfecta, also called brittle bone disease, is primarily caused by mutations in type 1 collagen genes, which lead to bone fragility (11,15,16). Oim−/− bone has decreased ultimate stress (11) and toughness (13,14) at the whole bone level, higher mineral density measured by backscattered techniques (11,17) and smaller and less arranged apatite crystals (8,11,17,18). For ductile bones we used PHOSPHO1 (Phospho1−/−). These mice lack a phosphatase, which is required for the generation of inorganic phosphate for bone mineralization (19–21). Phospho1−/− mice have more ductile bones at the macroscopic scale (13,19), and reduced mineral to matrix ratio as shown by Raman experiments (19).
Figure 1.
Values of fracture toughness (Kc) adapted from literature: oim+/+ from (14), the rest from (13).
We compared the mineral of brittle oim−/− and ductile Phospho1−/− mice using bulk techniques to measure overall differences at the nanoscale (instead of local measurements). After grinding the femur to powder, we used X-ray diffraction (XRD) to determine the average mineral crystal size and thermogravimetric analysis (TGA) to compare the bulk mineral to matrix ratio. TGA monitors the loss of bone mass with temperature from which the fractions of total mineral content and organic content can be calculated. This method was chosen over Raman or FTIR, because in spectroscopy certain peaks must be chosen to represent the mineral (Phosphate) and collagen (Amide I), which might not be the most representative peaks in pathologic bones where the composition is often altered. Changes in the composition were investigated with a second XRD analysis of the bone powder which had been previously heated during TGA. Heating the mineral increases its crystallinity (22), and thus differences in composition and structure become more apparent. The ramifications of the changes in mineral structure and composition were evaluated at the tissue level by analysing the mineralized matrix. The extent of mineralization of the bone matrix was calculated from quantitative backscattered scanning electron microscopy (qbSEM). Though density is often used as a correlate of elastic modulus, this is not always true in pathologic bone, since the organization and structure of the mineral also contribute to tissue modulus (11,23). We used nanoindentation to identify changes in elastic properties. Combining these techniques to analyse oim and Phospho1 bones within the same study can help identify the differences in the mineral of brittle and ductile bone.
2. MATERIALS AND METHODS
2.1. Specimens
Bones considered in this study belonged to two mouse strains that show the extremes of toughness (Fig. 1). At the whole bone level, bones of B6C3Fe-a/aCol1a2oim/oim (oim−/−) are brittle, while Phospho1-R74X null mutant (Phospho1−/−) mice have ductile bones (13,14). Both pathologic bones (oim−/− and Phospho1−/−) were compared to their corresponding wild-type controls - oim+/+ and Phospho1+/+. In total 24 male mice of 7 weeks-of-age were used (six per group). Femura were utilized to analyse the mineral (nano-scale), while tibiae were used to explore bone tissue (micro-scale) (Fig. 2).
Figure 2.
Schematic of materials and methods. Tibiae were used for micro-scale analysis and femora were utilized to determine properties at the nano-scale.
2.2. Mineral characterization
Right femora of six mice per group (total 24 femora) were used for XRD and TGA analysis. Bones were cleaned of soft tissue and bone marrow, and both epiphyses were cut off with a low speed diamond saw (Isomet, Buehler GmbH, Germany). Femora were then defatted using first a 2:1 and then a 1:2 chloroform/ethanol solution for 48 hrs each. The specimens were dehydrated in increasing concentrations of ethanol (70% to 100%) for 10 minutes each. Each bone was wet ground in acetone until a uniform and homogeneous powder was obtained and the vials were left under the fume hood until the evaporation of the acetone. The same femur powder was used for the subsequent XRD-TGA-XRD analysis of each sample.
X-ray Diffraction of bone powder (XRD)
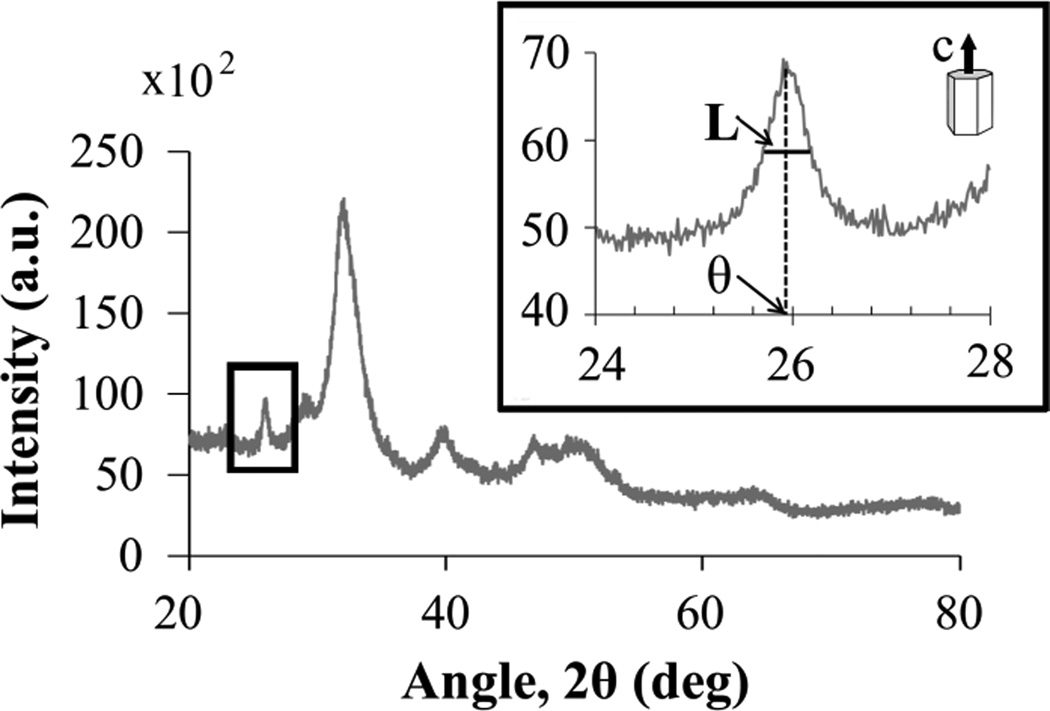
XRD patterns were obtained using a PANanalytical® XRD X’Pert Pro diffractometer operated at 40 kV and 40 mA with no spinning. The initial data collection was in the 2θ range of 20° to 80°, with a step size of 0.0334°/2θ (kept constant) and a count time at each step of 35 s. A set of slower scans was carried out from 24° to 28° with 250 sec/step in order to better capture the diffraction peak at 2θ = 26° (Fig. 3). This peak corresponds to the (0 0 2) c-axis and does not exhibit overlapping, which is why it was used to measure the average crystal size along the c-axis (24). The Scherrer equation was used with the FWHM method (full width at half maximum) to calculate the mean crystal size, B (25):
| [1] |
where k is the shape factor, λ is the wavelength of the X-ray, L is the peak width at half maximum and θ is the Bragg angle where the peak is located (Fig. 3). An in-built tool provided by PANalytical® X’Pert software was used for the calculations. The standard Bstd(2θ) = 0.14° was obtained measuring a Si substrate under the same conditions as the samples.
Figure 3.
Fast (20° < 2θ < 80°) and slow XRD pattern (24° < 2θ < 28°) of oim+/+. The peak at 26° is used to determine the average crystal size in the c-direction according to Eq. 8. Lis the peak width at half maximum and θ is the Bragg angle where the peak is located.
Thermogravimetric Analysis (TGA)
TGA was carried out on the Netzsch STA 449 C Jupiter ® simultaneous thermal analyser at a constant heating rate of 10°C/min in controlled air atmosphere. Femur powder, which weighted 8–12mg depending on the sample, was heated to the required temperature in a platinum crucible. In bone, the change in mass monitored by TGA is considered to be due to loss of water for temperatures up to 200°C, organic content from 200°C to 600°C, and carbonate content above 600°C (26–28). Three of the samples per group were heated from room temperature to 800°C, and the other three to 1200°C. Mineral to matrix ratio was calculated as the ratio between the percentages of mass remaining after heating to 600°C and the organic mass loss between 200°C and 600°C(27):
| [2] |
The percentage of mass at 600°Crepresents the weight percentage of mineral content and it depends on the amount of mass lost due to moisture, which might be altered in pathologic bones. In order to avoid this influence, the mass percentage at 600°C was translated to dry weight percentage for the calculation of the mineral to matrix ratio:
| [3] |
XRD after heat treatment
Heating the bone in TGA effectively results in sintering and increases the crystallinity of the mineral. Compositional differences become more apparent in the sintered product, which evolves mainly to hydroxyapatite (HA) and tricalcium phosphate (TCP).After TGA, XRD scans were collected with a time of 52 sec/step from 20° to 80°.PANalytical® Xpert High score software was employed to identify the phases present comparing peak positions against the International Centre for Diffraction Data (ICDD) powder diffraction reference patterns. Peaks corresponding to Hydroxyapatite (HA) were traced using Hydroxylapatite (reference code: 01-074-0566), while Calcium Phosphate (ref. code: 01-070-2065) was used to identify β-Tricalcium Phosphate (TCP) peaks. The mass fractions of the identified phases were estimated based on their Reference Intensity Ratios (RIR).The percentages of HA and TCP were used to estimate differences in calcium to phosphate (Ca/P) ratios, taking into account that Ca/P of stoichiometric HA is 1.67, whereas TCP has a ratio of 1.5. Thus, higher conversion to TCP is associated to lower Ca/P ratio.
2.3. Tissue characterization
Right tibiae of four mice per group (total 16 tibiae) were used for nanoindentation and qbSEM. Tibiae were cleaned of surrounding soft tissue and fixed in 70% ethanol for 48 hours. They were dehydrated in a series of increasing concentrations of ethanol (80, 90 and 100% for 24, 24 and 72 h respectively), and changed to a xylene solution (48 h).The samples were then infiltrated in pure methyl methacrylate (PMMA) mixed with α-azo-iso-butyronitrile under vacuum and polymerized at room temperature (chemicals bought from VRW, UK). Tibia blocks were cut transversally at the mid-diaphysis using a low speed diamond saw (Isomet, Buehler GmbH, Germany).The cross-sections were polished with graded silicon carbide papers (from P800 to P4000), and cleaned ultrasonically with distilled water between polishing steps.
Nanoindentation (NI)
Nanoindentation was performed on mid-diaphyseal medial cross-sections of the PMMA-embedded tibiae (Fig. 2) using a TI700 UBI system (Hysitron, Minneapolis, MN, USA). Indentation tests were carried out with the specimen in the dry condition using a 55 µm-radius sphere tip. A trapezoidal loading protocol was applied longitudinally to a maximum load of 8 mN with a rising time of 10 s and a holding of 30 s. Nine indents were made in each specimen with a minimum spacing of 15 µm between indents (Fig. 2). Viscoelastic analysis was used to evaluate elastic properties (29–31). The time-displacement data h(t) was fitted to the viscoelastic Boltzmann integral equation:
| [4] |
where R = 55 µm is the radius of the tip; P is the applied load; u is the dummy variable of integration for time; and J(t) is the material creep function. The creep function is defined as a function of the creep coefficients C0, Ci and the material time constants Ti:
| [5] |
The solution of Eq. 4 for the holding period of trapezoidal loading results in the following expression:
| [6] |
where the maximum applied load Pmax = 8 mN; and rising time tR = 10 s. The values of C0, Ci, Ti were obtained using a nonlinear least-square curve-fit function in MATLAB (Mathworks, Natick, MA) (32).
The instantaneous G0 and equilibrium G∞ shear modulus are calculated from the creep coefficients:
| [7] |
| [8] |
The ratio G∞ /G0 gives insight into the viscoelastic behaviour of the material: it ranges from 0, in perfectly viscous materials, to 1, in perfectly elastic materials. The instantaneous shear modulus was used to calculate the plane strain modulus, E’:
| [9] |
Young’s modulus E was computed assuming a Poison’s ratio of ν = 0.3 in cortical bone, following:
| [10] |
Backscattered electron microscopy (qbSEM)
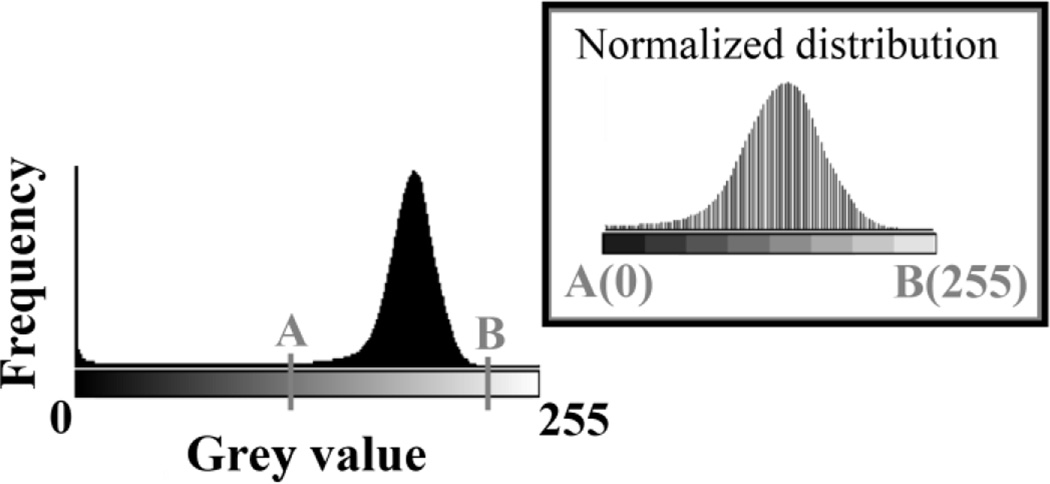
After the indentations, the PMMA blocks were repolished and carbon coated. Samples were analysed using EVO®MA10 scanning electron microscope (Zeiss UK Ltd, UK) operated at 20kV, with a beam current of 1.0 nA and at a working distance of 12 mm. Backscatter detector signals of monobromo and monoiodo dimethacrylate were used as standards (11,33). All the samples and standards were scanned during one test, and since both standards exhibited constant grey values throughout the test, the grey values were comparable among all the samples. ImageJ (31) was employed to plot the combined histogram of the grey values of all the bones to identify the lower (A, 125) and upper (B, 235) bounds across histograms (Fig. 4). These bounds were used to normalize the grey values of each pixel according to:
| [11] |
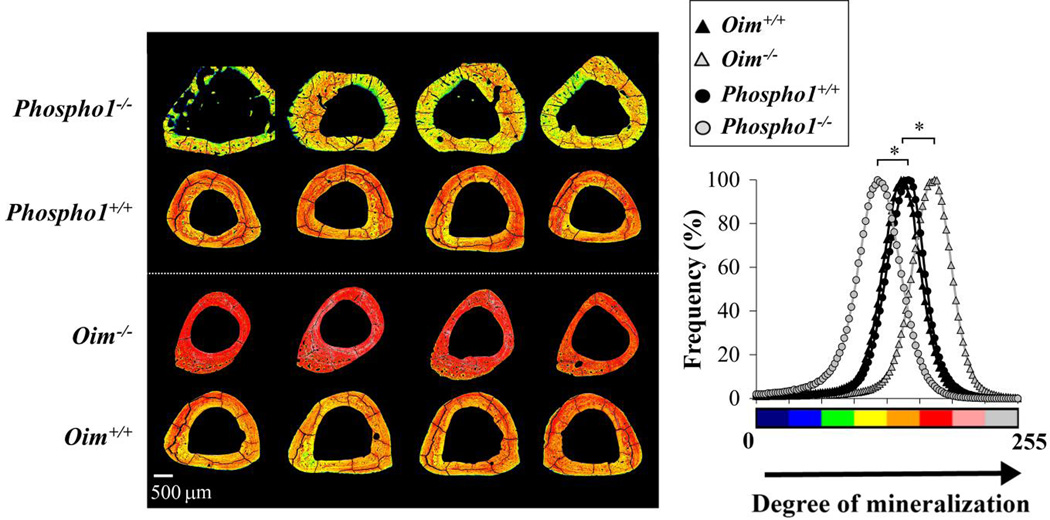
where pn is the normalized pixel value, p is the current pixel, and r is the bin range, in this case 255. For visualization purposes, the grey-level range of the normalized histogram was divided into eight equal size classes of different colours ranging from non-mineralized (black) to highly mineralized (white) bone matrix. The results reported hereafter are the ones corresponding to the normalized distribution in Fig. 4.
Figure 4.
Combined histogram of grey values of all the bones used to identify the lower (A) and upper limits (B). And the normalized combined histogram between A and B.
2.4 Statistical Analysis
Mean values and standard deviations were calculated for the measured parameters. Independent t-tests were used to compare crystal size, mineral/matrix ratio, elastic properties and mean BSE intensity values of pathologic vs. healthy bone (oim−/− vs. oim +/+; Phospho1−/− vs. Phospho1+/+). Equality of variances was assumed when Levene’s Test gave values of p > 0.05. Mann-Whitney U test was used in the cases where the data was not normally distributed according to the Shapiro-Wilk test. Differences were considered significant at p < 0.05. Statistical analysis was performed using SPSS (v.21, SPSS Inc., Chicago, IL).
3. RESULTS
Average crystal size
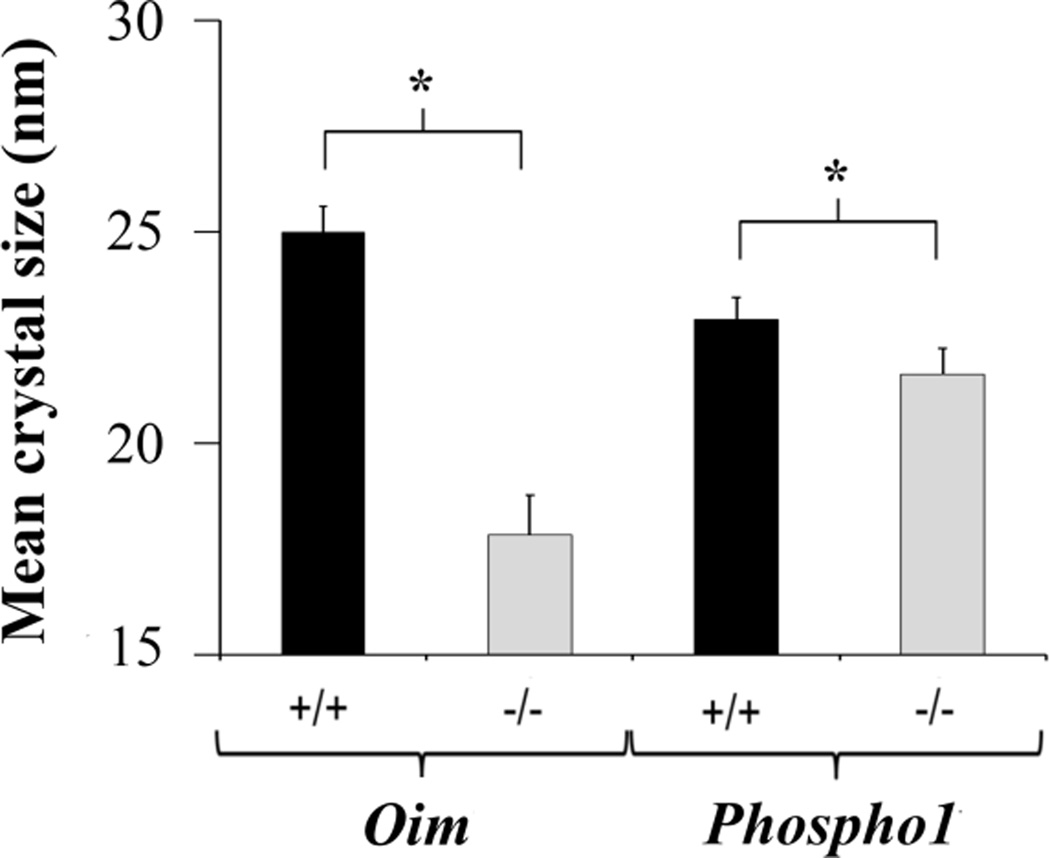
Pathologic bones had smaller crystal size than their controls (Fig. 5). In brittle bones, the average crystal size decreased from 25.0 ± 0.6 nm (oim+/+) to 17.8 ± 0.9 nm (oim−/−) (p<0.001). In ductile bones, it decreased from 22.9 ± 0.5 nm (Phospho1+/+) to 21.6 ± 0.6 nm (Phospho1−/−) (p = 0.001).
Figure 5.
Means and standard deviations of the average apatite crystal size. Pathologic bones had smaller crystal size. *p ≤ 0.001
Bulk mineral content
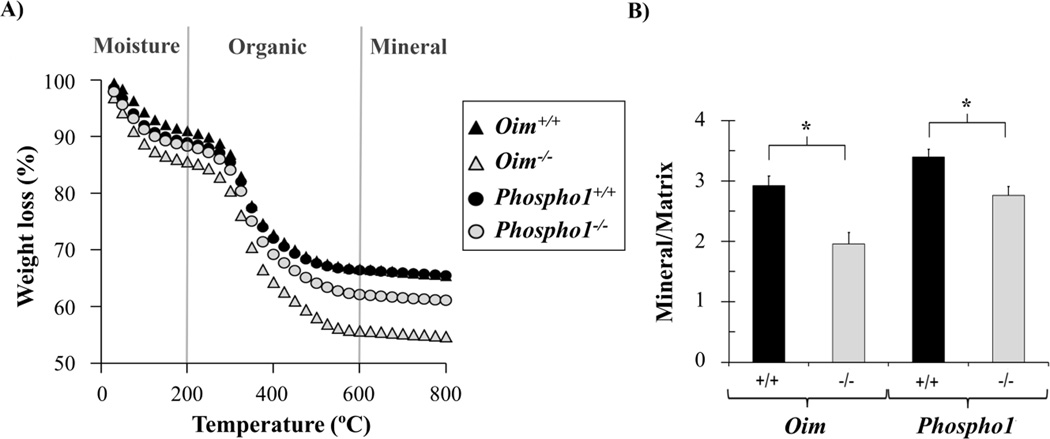
Representative TGA curves of weight loss with temperature are plotted in Fig. 6A. The percentages of weight associated with organic content (m200°C(%) – m600°C(%)), mineral phase (m600°C(%)) and carbonate content (m600°C(%) – m800°C (%)) are shown in Table 1. The weight loss associated with moisture is not shown, as it might be influenced by sample preparation. Brittle oim−/− and ductile Phospho1−/− bones exhibited increased organic content (p <0.001) compared to their controls. No differences were found in the loss of carbonate content to 800°C. Mineral/matrix ratios, calculated as the percentage of dry mass remaining at 600°C divided by the loss of organic matter (Eq. 2, 3) indicated that both pathologic bones had smaller mineral/matrix ratio compared to their controls (p<0.001) (Fig. 6B).
Figure 6.
A) Representative TGA curves of femur powder heated to 800°C. B) Mineral to matrix ratios, with pathologic bones showing smaller ratios. * p< 0.001
Table 1.
Mean and standard deviations of weight % of organic (200–600°C), mineral (at 600°C) and carbonate content (600–800°C) for oim and Phospho1 bone powder.
| Oim+/+ | Oim−/− | p-value | Phospho1+/+ | Phospho1−/− | p-value | |
|---|---|---|---|---|---|---|
| Organic (wt %) | 24.8 (1.0) | 32.3 (1.9) | <0.001* | 22.1 (0.6) | 25.6 (1.0) | <0.001* |
| Mineral (wt %) | 65.6 (1.0) | 55.0 (3.4) | <0.001* | 65.9 (1.2) | 61.7 (1.5) | <0.001* |
| Carbonate (wt %) | 1.1 (0.2) | 1.0 (0.1) | 0.310 | 0.9 (0.1) | 0.9 (0.1) | 0.628 |
p < 0.05
Conversion to HA and TCP
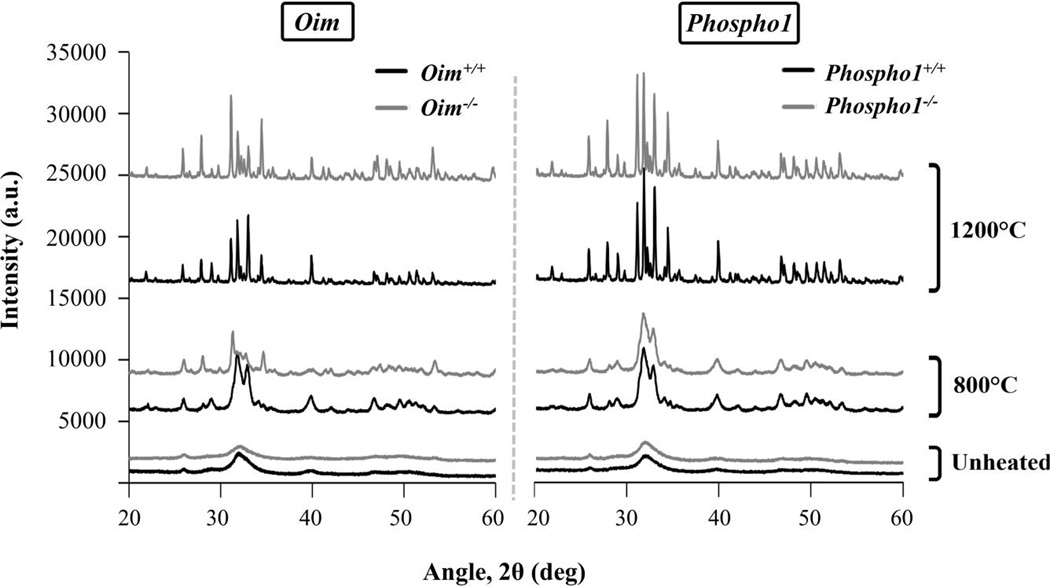
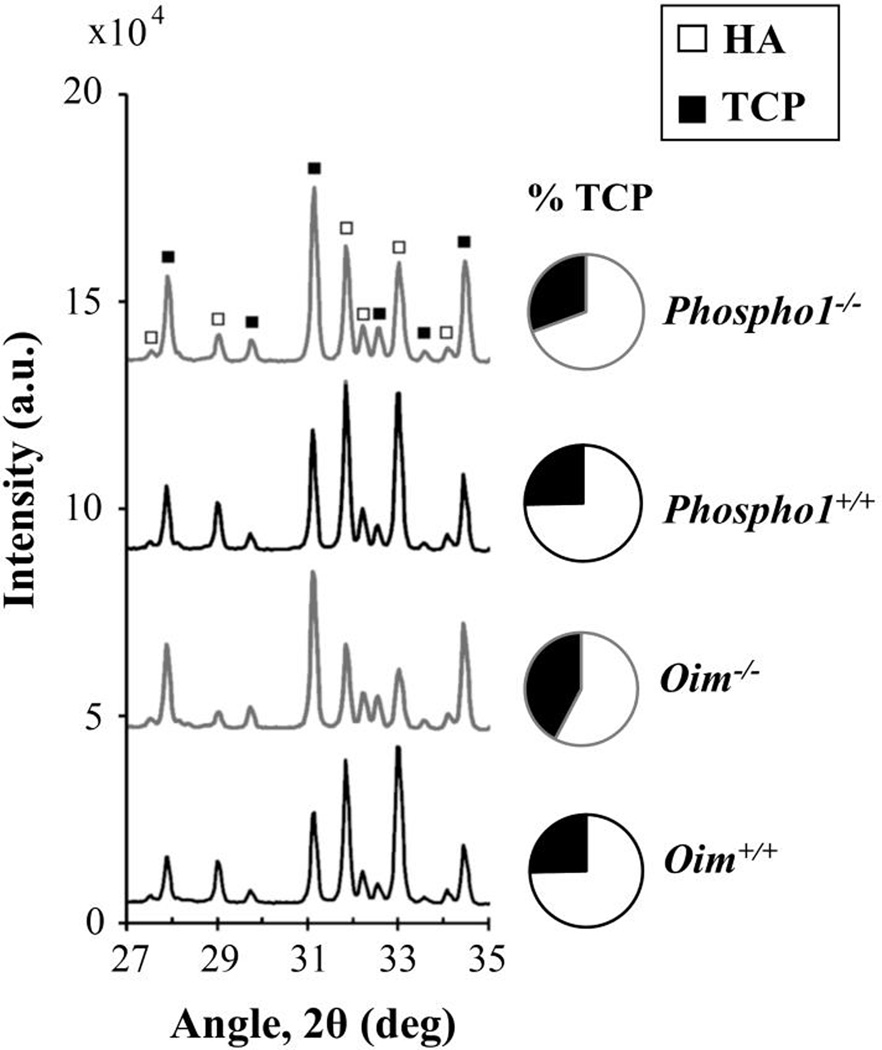
Figure 7 represents XRD patterns of oim and Phospho1 bone powder in three stages: unheated, after TGA to 800°C, and after the heat treatment to 1200°C. The XRD spectra of unheated bones could not be distinguished among all four mouse models due to low crystallinity and peak overlap. XRD after thermal treatment induced an increase in crystallinity for all the samples and revealed differences in the amounts of HA and TCP between the bones (Fig. 8). Figure 8 shows representative diffraction patterns of the samples heated to 1200°C, where the peaks corresponding to HA and TCP are identified. The heat treatment induced a bigger mass conversion to TCP for pathologic bones which were heated to 1200°C (42 ± 3% TCP in oim−/−, and 31 ± 1% in Phospho1−/−) compared to their wild-type controls (25 ± 3% in oim+/+, and 25 ± 1% in Phospho1+/+). It must be noted that only half of the bones were heated to 1200°C. Nevertheless, the same trend was found in the bones heated to 800°C, with pathologic bones having a bigger fraction of TCP mass (44 ± 6% in oim−/−, and 23 ± 1% in Phospho1−/−) than their wild-type controls (18 ± 1% in oim+/+ and Phospho1+/+).
Figure 7.
XRD spectra of oim (left) and Phospho1 (right) bones before TGA (unheated) and after heating to 800°C and 1200°C. The mineral becomes more crystalline with temperature.
Figure 8.
XRD patterns of oim and Phospho1 bone powder after being heated to 1200°C, and the average percentages of TCP. Pathologic samples show a higher conversion to TCP.
Tissue elastic properties
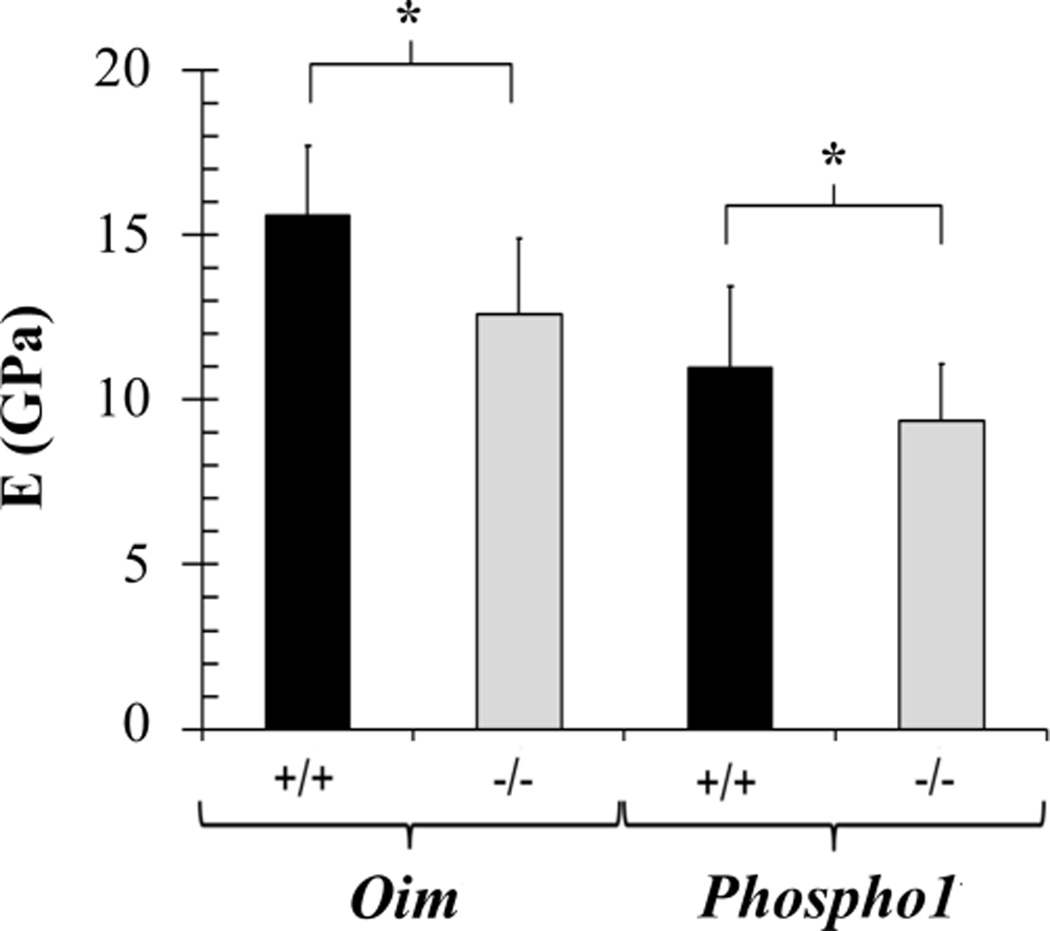
Table 2 summarizes the means and standard deviations of elastic properties for oim and Phospho1 tibiae. The plane strain modulus E’, instantaneous shear modulus G0, and infinite shear modulus G∞ were significantly smaller in pathologic bones compared to wild-type controls. As expected for dry and PMMA-infiltrated samples, no significant differences were found in the extent of viscoelasticity, G∞/G0. Pathologic bones had smaller Young’s modulus than their controls (p < 0.001 for oim−/−; p = 0.017 for Phospho1−/−) (Fig. 9).
Table 2.
Means and standard deviations of elastic properties of oim and Phospho1 tibiae embedded in PMMA, indented with a sphere in dry conditions. E’ is the plane strain modulus; G0 is the instantaneous shear modulus and G∞ corresponds to the shear modulus at infinite time; G∞/G0 represents the elastic fraction (viscous 0 ≤ G∞/G0 ≤ 1 elastic).
| Oim+/+ | Oim−/− | p-value | Phospho1+/+ | Phospho1−/− | p-value | |
|---|---|---|---|---|---|---|
| E’ (GPa) | 17.1 (2.3) | 13.9 (2.5) | <0.001* | 12.0 (2.7) | 10.3 (1.9) | 0.014* |
| G0 (GPa) | 4.27 (0.58) | 3.47 (0.63) | <0.001* | 3.01 (0.68) | 2.57 (0.48) | 0.016* |
| G∞ (GPa) | 2.77 (0.54) | 2.35 (0.53) | 0.004* | 2.03 (0.40) | 1.64 (0.33) | <0.001* |
| G∞/G0 | 0.65 (0.10) | 0.68 (0.09) | 0.487 | 0.68 (0.05) | 0.65 (0.09) | 0.440 |
p < 0.05
Figure 9.
Means and standard deviations of Young’s modulus E, with pathologic bones exhibiting reduced Young’s modulus. *p <0.05
Degree of mineralization of bone matrix
Oim−/− bones were more mineralized and Phospho1−/− bones were less mineralized than their controls (Fig. 10). Combined histograms were plotted per strain in order to compute average pixel distributions. The mean grey value was smaller for Phospho1−/− bones (117 ± 28) and bigger for oim−/− (168 ± 29) when compared to Phospho1+/+ (143 ± 26, p < 0.001) and oim+/+ (139 ± 27, p < 0.001) respectively.
Figure 10.
Normalized backscattered electron intensity maps of tibial cross sections (left) and the combined histograms of pixel values for each strain (right) from non-mineralized (0, black) to high mineralization (255, white). Bone matrix was hypomineralized in Phospho1 −/− and hypermineralized in oim−/−, as calculated from the mean grey values of the histograms. * p<0.001.
4. DISCUSSION
This study explored the mineral phase of brittle oim−/− and ductile Phospho1−/− bones. Interestingly, despite their extremely different mechanical behaviour at the macro-scale, the mineral of oim−/− and Phospho1−/− bones displayed similar trends. Both pathologic bones had smaller mineral crystal size, less bulk mineral to matrix ratio and bigger thermal conversion to TCP than controls. Despite the differences in the degree of mineralization of the bone matrix, both brittle and ductile bones had reduced tissue elastic moduli.
At the mineral level, average size of oim−/− and Phospho1−/− apatite crystals along the c-axis was reduced. This might be a consequence of the disrupted collagen fibril template in brittle bones (11) and altered mineral formation pathway due to lack of phosphate in ductile bones (34,35). Transmission electron microscopy (TEM) and small angle X-ray scattering (SAXS) have shown that apatite crystals of oim−/− bone have significantly smaller thickness and are packed more tightly in a less organized manner when compared tooim+/+ (11,17,18). Smaller crystals have also been measured in children with the severe form of osteogenesis imperfecta (36). In the current study it was found that, although the differences were not as pronounced as in brittle bone, Phospho1−/− bones also had significantly reduced average mineral crystal size. Variations in the mineral crystal size have previously been found in bones exhibiting altered mechanical properties (37), as the crystal size might influence how bone, as a composite material, responds to load. The current study shows that a reduction in the average crystal size is associated with both brittle oim−/− and ductile Phospho1−/− bone.
The bulk mineral content was reduced in both pathologic bones, which led to lower mineral/matrix ratios (Fig. 6B). It must be noted that differences in moisture content might have been affected by sample preparation, which is why the mineral to matrix ratio was calculated using the dry weight at 600°C. In Phospho1−/− bones, the lower mineral/matrix ratio is in agreement with Raman experiments (19). However, Raman and FTIR studies have measured increased mineral/matrix ratio for oim−/− bones (11,14). The discrepancy between Raman, FTIR and TGA in brittle bones is likely to be due to differences in how the organic and mineral contents are calculated: TGA provides a bulk measurement, whereas Raman and FTIR are local measurements. TGA measures the ratio of the total mineral content (including carbonated hydroxyapatite) to the total organic content (including collagen, blood vessels, non-collagenous proteins and lattice water) (38,39). In contrast, in FTIR and Raman the mineral content is represented only by the phosphate band and the organic content is limited to the collagen type I Amide I band (40). In addition, Amide I band is affected by structure and organization of the collagen fibers (41), hence the mineral/matrix ratio calculated by spectroscopy is not purely a compositional measurement.
After the heat treatment, all bones evolved to a biphasic mixture of HA and TCP but pathologic samples showed a higher conversion to TCP (Fig. 8), indicating chemical deviations from the stoichiometric HA. The increased conversion to TCP, with a lower Ca/P ratio than HA, suggests that the mineral of oim−/− and Phospho1−/− bones had lower Ca/P ratio than their controls. Our results are limited by the reduced number of samples heated to each of the temperatures (three per strain to 800°C and three to 1200°C). However, the results are consistent for both temperatures and in agreement with previous literature. Brittle bones exhibited the highest deviation from stoichiometric apatite. Phillips et al. (10) measured a reduction of Ca/P in oim−/− femora using neutron activation analysis. Reductions in Ca/P ratio have also been reported in human bone suffering osteogenesis imperfecta (42) and in osteoporotic bone(43,44). Our results further indicate that pathologic bone mineral tends to be less stoichiometric (22,28). The proposed method of heating the samples to different temperatures prior to XRD measurements brings out differences in composition of pathologic bones not readily evident from XRD without heat treatment.
A notable difference in the tissue properties of brittle and ductile bones resided in the mineralization of the tissue. Since our aim was to compare mineralization degrees between bones within the same study, mineralization was left in terms of normalized grey values, instead of translating these values to mineral density (33). This was done with the purpose of avoiding the many assumptions required to convert grey values to mineral density (11). Mineralized matrix of oim−/− bone was more mineralized, which is in agreement with previous qbSEM studies on brittle bones (11,17). In contrast, as expected from the lack of PHOSPHO1 enzyme and suggested from our previous studies (21), Phospho1−/− bones were less mineralized than their controls.
Tissue elastic modulus was reduced in brittle and ductile bones, indicating that in pathologic bones, mineral density does not necessarily correlate with modulus (11,23). The measured elastic values (Table 2) are in agreement with previously reported nanoindentation data (32,45,46) Young’s modulus was reduced by 19% in oim−/− bones, which is in accordance with results from ultrasound critical-angle reflectometry (47) and sharp Berkovich nanoindentation (11). Huesa et al. (19) measured the elastic properties of young Phospho1−/− tibiae using sharp indentation and reported a decrease of 11% in their elastic modulus, close to the 15% reduction found in the current study.
When combining results from TGA and qbSEM, interesting conclusions can be drawn. In Phospho1−/− bones, TGA measured less mineral content and this mineral was loosely packed, as inferred from smaller grey intensity values which indicated lower mineral density of the mineralized matrix. In brittle bones TGA also measured less mineral content, but in contrast, since this mineral was more tightly packed (11), qbSEM maps showed a higher degree of mineralization. Colorimetric measurements of hydroxyproline have measured reduced collagen content in oim−/− (15,48); however, hydroxyproline was normalized by the mass of the bone powder (undemineralized), and thus, reductions in collagen content could also be due to greater mineralization of the bone. Lattice water, which evaporates between 200–400°C, might contribute to the increased organic weight loss, since the water in crystals is lost more easily due to the small size of the crystals and the higher surface area (28) in pathologic bones. However, the differences in the organic weight loss also increased after 400°C (p = 0.002). This suggests that the increased organic fraction must be due to not only the lattice water, but also the increased non-mineralized matrix, non-collagenous proteins, and smaller but more numerous blood vessels (49), which are not visible in the qbSEM intensity maps. The differences between results derived from TGA and qbSEM in both pathologic bones highlight the need of distinguishing bulk bone mineral quantity (measured with TGA) from the extent of mineralization of the bone matrix (measured by qbSEM).
Conclusions
The mineral phase of brittle and ductile bones was compared at the nano- and micro-scale in order to better comprehend how different these bones are concerning the mineral. In brittleoim−/− bones the mutation affecting collagen structure has a profound effect in the mineralization, whereas in ductile Phospho1−/− bones the mineral is directly affected by the lack of PHOSPHO1, which in turn might also affect collagen structure(19).Comparisons of the mineral from oim and Phospho1 bones indicated that deviations from the size, composition, and organization of healthy bone mineral will decrease tissue elastic modulus even if the degree of mineralization increases. Since similar trends were found in the mineral of brittle and ductile bone, future studies will examine alterations in the collagen composition, matrix architecture and collagen cross-links in order to identify the nano-scale differences between these bones. A detailed multi-scale analysis of bone toughness is essential to characterize the properties that should be targeted in the development of new therapies for skeletal diseases such as osteogenesis imperfecta.
ACKNOWLEDGMENTS
This study was funded by BBSRC (UK) and supported by the Basque Government predoctoral fellowship (Spain), KJO studentship and AR53102 from the National Institutes of Health (USA). We would like to thank Michelle L. Oyen for her advice in the collection and analysis of nanoindentation data, and Angelo Karunaratne, Michael Doube and Maximilien Vanleene for interesting discussions about bone mineral density.
Author’s roles: Study design: S.J.S., N.R-F., E.G-T., E.S.; sample preparation: K.J.O., C. F., J.L.M., Q.M., N.R-F; XRD/TGA data collection: Q.M., E.G-T., N.R-F; XRD/TGA data analysis and interpretation: Q.M., E.G-T., N.R-F, E.S., S.J.S.; nanoindentation data collection and analysis: N.R-F; qbSEM data collection and analysis: A.B., N.R-F; drafting manuscript: N.R-F; Revising manuscript: all authors; approving final version of manuscript: all authors. Naiara Rodriguez-Florez takes responsibility for the integrity of data analysis.
Footnotes
CONFLICTS OF INTEREST
None.
REFERENCES
- 1.Rho J-Y, Kuhn-Spearing L, Zioupos P. Mechanical properties and the hierarchical structure of bone. Medical Engineering & Physics. 1998 Mar;20(2):92–102. doi: 10.1016/s1350-4533(98)00007-1. [DOI] [PubMed] [Google Scholar]
- 2.Ritchie RO, Nalla RK, Kruzic JJ, Ager JW, Balooch G, Kinney JH. Fracture and Ageing in Bone: Toughness and Structural Characterization. Strain. 2006;42(4):225–232. [Google Scholar]
- 3.Ritchie RO, Buehler MJ, Hansma P. Plasticity and toughness in bone. Physics Today. 2009;62(6):41–47. [Google Scholar]
- 4.Buehler MJ. Molecular nanomechanics of nascent bone: fibrillar toughening by mineralization. Nanotechnology. 2007 Jul 25;18(29):295102. [Google Scholar]
- 5.Fratzl P, Gupta HS, Paschalis EP, Roschger P. Structure and mechanical quality of the collagen-mineral nano-composite in bone. J Mater Chem. 2004 Jul 14;14(14):2115–2123. [Google Scholar]
- 6.Zimmermann EA, Schaible E, Bale H, Barth HD, Tang SY, Reichert P, et al. Age-related changes in the plasticity and toughness of human cortical bone at multiple length scales. Proc Natl Acad Sci U S A. 2011 Aug 30;108(35):14416–14421. doi: 10.1073/pnas.1107966108. [DOI] [PMC free article] [PubMed] [Google Scholar]
- 7.Nyman JS, Makowski AJ. The contribution of the extracellular matrix to the fracture resistance of bone. Curr Osteoporos Rep. 2012 Jun;10(2):169–177. doi: 10.1007/s11914-012-0101-8. [DOI] [PMC free article] [PubMed] [Google Scholar]
- 8.Camacho NP, Landis WJ, Boskey AL. Mineral changes in a mouse model of osteogenesis imperfecta detected by Fourier transform infrared microscopy. Connect Tissue Res. 1996;35(1–4):259–265. doi: 10.3109/03008209609029199. [DOI] [PubMed] [Google Scholar]
- 9.Grynpas M. Age and disease-related changes in the mineral of bone. Calcif Tissue Int. 1993 Feb 1;53(1):S57–S64. doi: 10.1007/BF01673403. [DOI] [PubMed] [Google Scholar]
- 10.Phillips C, Bradley D, Schlotzhauer C, Bergfeld M, Libreros-Minotta C, Gawenis L, et al. Oim mice exhibit altered femur and incisor mineral composition and decreased bone mineral density. Bone. 2000 Aug;27(2):219–226. doi: 10.1016/s8756-3282(00)00311-2. [DOI] [PubMed] [Google Scholar]
- 11.Vanleene M, Porter A, Guillot P-V, Boyde A, Oyen ML, Shefelbine SJ. Ultra-structural defects cause low bone matrix stiffness despite high mineralization in osteogenesis imperfecta mice. Bone. 2012 Mar 16;50(6):1317–1323. doi: 10.1016/j.bone.2012.03.007. [DOI] [PMC free article] [PubMed] [Google Scholar]
- 12.Donnelly E, Chen DX, Boskey AL, Baker SP, Meulen MCH van der. Contribution of Mineral to Bone Structural Behavior and Tissue Mechanical Properties. Calcif Tissue Int. 2010 Nov 1;87(5):450–460. doi: 10.1007/s00223-010-9404-x. [DOI] [PMC free article] [PubMed] [Google Scholar]
- 13.Carriero A, Bruse JL, Oldknow KJ, Millan JL, Farquharson C, Shefelbine SJ. Reference point indentation is not indicative of whole mouse bone stress intensity fracture toughness. Bone. doi: 10.1016/j.bone.2014.09.020. (In press). [DOI] [PMC free article] [PubMed] [Google Scholar]
- 14.Carriero A, Zimmermann EA, Paluszny A, Tang SY, Bale H, Busse B, et al. How tough is Brittle Bone? Investigating Osteogenesis Imperfecta in Mouse Bone. J Bone Miner Res. 2014 Jan;29(6):1392–1401. doi: 10.1002/jbmr.2172. [DOI] [PMC free article] [PubMed] [Google Scholar]
- 15.Camacho NP, Hou L, Toledano TR, Ilg WA, Brayton CF, Raggio CL, et al. The Material Basis for Reduced Mechanical Properties in oim Mice Bones. J Bone Miner Res. 1999;14(2):264–272. doi: 10.1359/jbmr.1999.14.2.264. [DOI] [PubMed] [Google Scholar]
- 16.Chipman SD, Sweet HO, McBride DJ, Davisson MT, Marks SC, Shuldiner AR, et al. Defective pro alpha 2(I) collagen synthesis in a recessive mutation in mice: a model of human osteogenesis imperfecta. Proc Natl Acad Sci U S A. 1993 Mar 1;90(5):1701–1705. doi: 10.1073/pnas.90.5.1701. [DOI] [PMC free article] [PubMed] [Google Scholar]
- 17.Grabner B, Landis W, Roschger P, Rinnerthaler S, Peterlik H, Klaushofer K, et al. Age- and genotype-dependence of bone material properties in the osteogenesis imperfecta murine model (oim) Bone. 2001 Nov;29(5):453–457. doi: 10.1016/s8756-3282(01)00594-4. [DOI] [PubMed] [Google Scholar]
- 18.Fratzl P, Paris O, Klaushofer K, Landis WJ. Bone mineralization in an osteogenesis imperfecta mouse model studied by small-angle x-ray scattering. J Clin Invest. 1996 Jan 15;97(2):396–402. doi: 10.1172/JCI118428. [DOI] [PMC free article] [PubMed] [Google Scholar]
- 19.Huesa C, Yadav MC, Finnilä MAJ, Goodyear SR, Robins SP, Tanner KE, et al. PHOSPHO1 is essential for mechanically competent mineralization and the avoidance of spontaneous fractures. Bone. 2011 May 1;48(5):1066–1074. doi: 10.1016/j.bone.2011.01.010. [DOI] [PMC free article] [PubMed] [Google Scholar]
- 20.MacRae VE, Davey MG, McTeir L, Narisawa S, Yadav MC, Millan JL, et al. Inhibition of PHOSPHO1 activity results in impaired skeletal mineralization during limb development of the chick. Bone. 2010 Apr;46(4):1146–1155. doi: 10.1016/j.bone.2009.12.018. [DOI] [PMC free article] [PubMed] [Google Scholar]
- 21.Yadav MC, Simão AMS, Narisawa S, Huesa C, McKee MD, Farquharson C, et al. Loss of skeletal mineralization by the simultaneous ablation of PHOSPHO1 and alkaline phosphatase function: A unified model of the mechanisms of initiation of skeletal calcification. J Bone Miner Res. 2011;26(2):286–297. doi: 10.1002/jbmr.195. [DOI] [PMC free article] [PubMed] [Google Scholar]
- 22.Rogers KD, Daniels P. An X-ray diffraction study of the effects of heat treatment on bone mineral microstructure. Biomaterials. 2002 Jun;23(12):2577–2585. doi: 10.1016/s0142-9612(01)00395-7. [DOI] [PubMed] [Google Scholar]
- 23.Oyen ML, Ferguson VL, Bembey AK, Bushby AJ, Boyde A. Composite bounds on the elastic modulus of bone. J Biomech. 2008 Aug 7;41(11):2585–2588. doi: 10.1016/j.jbiomech.2008.05.018. [DOI] [PubMed] [Google Scholar]
- 24.Boskey AL, Moore DJ, Amling M, Canalis E, Delany AM. Infrared Analysis of the Mineral and Matrix in Bones of Osteonectin-Null Mice and Their Wildtype Controls. J Bone Miner Res. 2003 Jun 1;18(6):1005–1011. doi: 10.1359/jbmr.2003.18.6.1005. [DOI] [PubMed] [Google Scholar]
- 25.Suryanarayana C, Norton MG. X-Ray Diffraction: A Practical Approach. Springer: 1998. p. 302. [Google Scholar]
- 26.Legros R, Balmain N, Bonel G. Age-related changes in mineral of rat and bovine cortical bone. Calcif Tissue Int. 1987 Sep 1;41(3):137–144. doi: 10.1007/BF02563793. [DOI] [PubMed] [Google Scholar]
- 27.Peters F, Schwarz K, Epple M. The structure of bone studied with synchrotron X-ray diffraction, X-ray absorption spectroscopy and thermal analysis. Thermochimica Acta. 2000 Oct 3;361(1–2):131–138. [Google Scholar]
- 28.Wang X-M, Cui F-Z, Ge J, Ma C. Alterations in mineral properties of zebrafish skeletal bone induced by liliputdtc232 gene mutation. J Cryst Growth. 2003;258(3):394–401. [Google Scholar]
- 29.Oyen ML. Spherical indentation creep following ramp loading. J Mater Res. 2005 Aug 1;20:2094–2100. [Google Scholar]
- 30.Oyen ML. Analytical techniques for indentation of viscoelastic materials. Philosophical Magazine. 2006 Nov 1;86:5625–5641. [Google Scholar]
- 31.Oyen ML. Sensitivity of polymer nanoindentation creep measurements to experimental variables. Acta Materialia. 2007 Jun;55(11):3633–3639. [Google Scholar]
- 32.Rodriguez-Florez N, Oyen ML, Shefelbine SJ. Insight into differences in nanoindentation properties of bone. J Mech Beh Biomed Mater. 2013 Feb;18:90–99. doi: 10.1016/j.jmbbm.2012.11.005. [DOI] [PubMed] [Google Scholar]
- 33.Boyde A, Jones SJ, Aerssens J, Dequeker J. Mineral density quantitation of the human cortical iliac crest by backscattered electron image analysis: Variations with age, sex, and degree of osteoarthritis. Bone. 1995 Jun 1;16(6):619–627. doi: 10.1016/8756-3282(95)00119-x. [DOI] [PubMed] [Google Scholar]
- 34.Roberts S, Narisawa S, Harmey D, Millán JL, Farquharson C. Functional involvement of PHOSPHO1 in matrix vesicle-mediated skeletal mineralization. J Bone Miner Res. 2007 Apr;22(4):617–627. doi: 10.1359/jbmr.070108. [DOI] [PubMed] [Google Scholar]
- 35.Stewart AJ, Roberts SJ, Seawright E, Davey MG, Fleming RH, Farquharson C. The presence of PHOSPHO1 in matrix vesicles and its developmental expression prior to skeletal mineralization. Bone. 2006 Nov;39(5):1000–1007. doi: 10.1016/j.bone.2006.05.014. [DOI] [PubMed] [Google Scholar]
- 36.Vetter U, Eanes ED, Kopp JB, Termine JD, Robey PG. Changes in apatite crystal size in bones of patients with osteogenesis imperfecta. Calcif Tissue Int. 1991 Oct;49(4):248–250. doi: 10.1007/BF02556213. [DOI] [PubMed] [Google Scholar]
- 37.Adele Boskey. Bone mineral crystal size. Osteoporos Int. 2003 Sep;14(Suppl 5):S16–S20. doi: 10.1007/s00198-003-1468-2. discussion S20–1. [DOI] [PubMed] [Google Scholar]
- 38.Pramanik S, Hanif A, Pingguan-Murphy B, Abu Osman N. Morphological Change of Heat Treated Bovine Bone: A Comparative Study. Materials. 2012 Dec 21;6(1):65–75. doi: 10.3390/ma6010065. [DOI] [PMC free article] [PubMed] [Google Scholar]
- 39.Wang X-Y, Zuo Y, Huang D, Hou X-D, Li Y-B. Comparative study on inorganic composition and crystallographic properties of cortical and cancellous bone. Biomed Environ Sci. 2010 Dec;23(6):473–480. doi: 10.1016/S0895-3988(11)60010-X. [DOI] [PubMed] [Google Scholar]
- 40.Feng L, Jasiuk I. Multi-scale characterization of swine femoral cortical bone. J Biomech. 2011 Jan 11;44(2):313–320. doi: 10.1016/j.jbiomech.2010.10.011. [DOI] [PubMed] [Google Scholar]
- 41.De Campos Vidal B, Mello MLS. Collagen type I amide I band infrared spectroscopy. Micron. 2011 Apr;42(3):283–289. doi: 10.1016/j.micron.2010.09.010. [DOI] [PubMed] [Google Scholar]
- 42.Sarathchandra P, Kayser MV, Ali SY. Abnormal mineral composition of osteogenesis imperfecta bone as determined by electron probe X-ray microanalysis on conventional and cryosections. Calcif Tissue Int. 1999 Jul;65(1):11–15. doi: 10.1007/pl00005829. [DOI] [PubMed] [Google Scholar]
- 43.Kourkoumelis N, Balatsoukas I, Tzaphlidou M. Ca/P concentration ratio at different sites of normal and osteoporotic rabbit bones evaluated by Auger and energy dispersive X-ray spectroscopy. J Biol Phys. 2012 Mar 1;38(2):279–291. doi: 10.1007/s10867-011-9247-3. [DOI] [PMC free article] [PubMed] [Google Scholar]
- 44.Tzaphlidou M. Bone Architecture: Collagen Structure and Calcium/Phosphorus Maps. J Biol Phys. 2008 Apr 1;34(1–2):39–49. doi: 10.1007/s10867-008-9115-y. [DOI] [PMC free article] [PubMed] [Google Scholar]
- 45.Bembey Ak, Bushby Aj, Boyde A, Ferguson Vl, Oyen Ml. Hydration effects on the micro-mechanical properties of bone. J Mater Res. 2006;21(08):1962–1968. [Google Scholar]
- 46.Oyen ML, Shean TAV, Strange DGT, Galli M. Size Effects in Indentation of Hydrated Biological Tissues. J Mater Res. 2012;27(01):245–255. [Google Scholar]
- 47.Mehta SS, Antich PP, Landis WJ. Bone Material Elasticity in a Murine Model of Osteogenesis Imperfecta. Connect Tissue Res. 1999;40(3):189–198. doi: 10.3109/03008209909005282. [DOI] [PubMed] [Google Scholar]
- 48.Yao X, Carleton SM, Kettle AD, Melander J, Phillips CL, Wang Y. Gender-dependence of bone structure and properties in adult osteogenesis imperfecta murine model. Ann Biomed Eng. 2013 Jun;41(6):1139–1149. doi: 10.1007/s10439-013-0793-7. [DOI] [PMC free article] [PubMed] [Google Scholar]
- 49.Carriero A, Doube M, Vogt M, Busse B, Zustin J, Levchuk A, et al. Altered lacunar and vascular porosity in osteogenesis imperfecta mouse bone as revealed by synchrotron tomography contributes to bone fragility. Bone. 2014 Apr;61:116–124. doi: 10.1016/j.bone.2013.12.020. [DOI] [PubMed] [Google Scholar]


