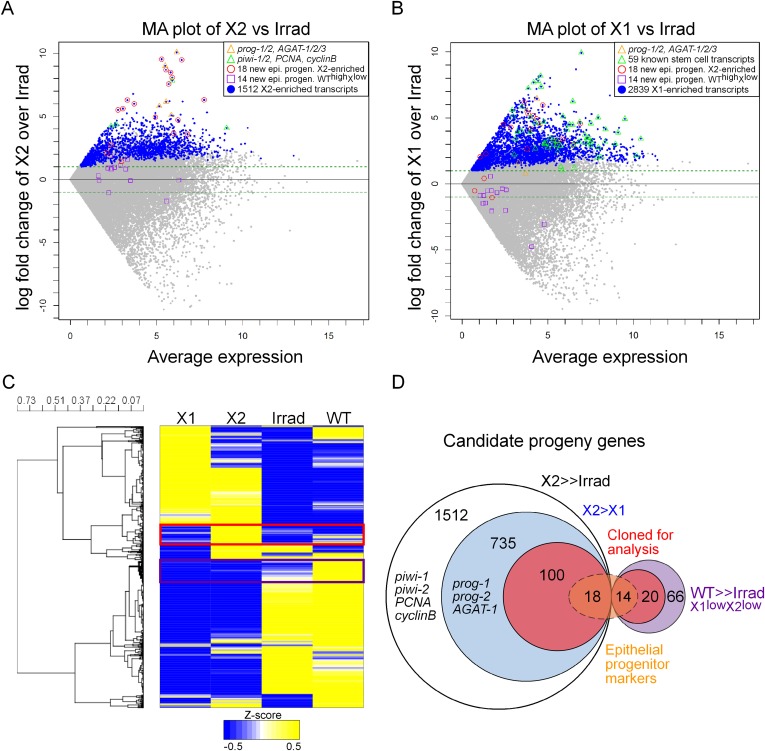
Figure 1. Transcriptional analysis of irradiation-sensitive cell populations in Schmidtea mediterranea.
Irradiation-sensitive cell populations (X1, X2) isolated by fluorescence-activated cell sorting (FACS), lethally irradiated whole worms (Irrad), and intact control worms (WT) were analyzed by RNA-deep sequencing (RNAseq). (A and B) MA plots comparing enrichment in the X2 (A) or X1 (B) cell populations over Irrad, with average expression level. Each gray dot represents one transcript. Blue dots represent transcripts found to be significantly enriched in the respective cell population through DESeq analysis (X2, p < 0.01; X1, p < 0.001). Previously established postmitotic lineage markers are indicated by orange triangles. Previously established stem cell-specific transcripts are indicated as green triangles. Candidate genes identified in this study as markers of epithelial progenitors are indicated as red circles (X2-enriched) or purple boxes (WThighXlow). (C) Hierarchical clustering of RNAseq data identifies transcripts enriched in the X2 population (red box), as well as a group of irradiation-sensitive transcripts, which have high expression in intact control worms but low expression in X1, X2, and Irrad populations (purple box, WThighXlow). To improve visualization, the heatmap depicts z-scores scaled to the range of −0.5 to +0.5. (D) Selection of candidate progeny genes for analysis was determined by enriched expression in X2 fraction compared to both Irrad and X1 fractions. The pool of candidate genes validated in this study to be expressed in epithelial progenitors is indicated in orange. >> denotes more than fivefold enrichment.


