

Abstract
Enclosed cab filtration systems are typically used on mobile mining equipment to reduce miners’ exposure to airborne dust generated during mining operations. The National Institute for Occupational Safety and Health (NIOSH) Office of Mine Safety and Health Research (OMSHR) has recently worked with a mining equipment manufacturer to examine a new cab filtration system design for underground industrial minerals equipment. This cab filtration system uses a combination of three particulate filters to reduce equipment operators’ exposure to dust and diesel particulates present in underground industrial mineral mines. NIOSH initially examined this cab filtration system using a two-instrument particle counting method at the equipment company’s manufacturing shop facility to assess several alternative filters. This cab filtration system design was further studied on several pieces of equipment during a two- to seven-month period at two underground limestone mines. The two-instrument particle counting method was used outside the underground mine at the end of the production shifts to regularly test the cabs’ long-term protection factor performance with particulates present in the ambient air. This particle counting method showed that three of the four cabs achieved protection factors greater than 1,000 during the field studies. The fourth cab did not perform at this level because it had a damaged filter in the system. The particle counting measurements of submicron particles present in the ambient air were shown to be a timely and useful quantification method in assessing cab performance during these field studies.
Keywords: enclosed cabs, filtration, particle counting, protection factor
INTRODUCTION
Enclosed cabs are an engineering control that can provide a safe, comfortable, and healthy worker environment for equipment operators. Most modern day enclosed cabs have heating, ventilation, and air conditioning (HVAC) systems for maintaining a comfortable temperature and a breathable quantity of air for their occupants. Various levels of filtration can be incorporated into the HVAC system to improve the ventilation quality of the air inside the cab by removing airborne pollutants such as dusts, diesel, and other aerosols. Enclosed cab filtration system effectiveness has been previously studied but it can be difficult to measure in the field.
The American Society of Agricultural Engineers (ASAE) previously devised a consensus standard for testing a cab’s particulate reduction factor and specifying a cab’s performance criteria for pesticide aerosol applications. These procedures used an optical particle counter placed inside and outside the cab to examine 2–4 μm ambient air particulate penetration into the cab as it drives along on an end-use tractor.(1,2) The procedure used two particle counters that were alternated between four cab test replicates to negate or average out measurement biases between instruments. Examination of this test procedure indicated that inconsistent and low particle count data for the 2–4 μm particles outside the cab can yield unreliable cab performance results between replicated cab tests.(2) It was observed that the cab filtration system needs to be challenged by a high enough outside particle count concentration to make the unfiltered inside ventilation system aerosol generation insignificant.(2) Another study showed that 200 to 1800 particles/L are generated from various cab manufacturer blower fans, and that the outside cab test concentrations should be sufficiently higher to make this internal particle source bias insignificant.(3)
Alternative particle counting cab field test procedures have been examined by NIOSH with submicron particles (0.3–0.5 μm) and have been used to quantify and improve agricultural tractor cab protection performance for pesticide spray applications.(4,5) One procedure used two optical particle counters alternated between the inside and outside locations of the tractor cab during four mobile test replicates, similar to the ASAE consensus standard test except that 0.3–0.4 μm particle sizes were used as the test medium. This field study identified and sealed several tractor cab filtration system leaks around a high-efficiency particulate air (HEPA) filter, which effectively reduced particle penetration into the cab from 11% to less than 1%.(4) Another study measured 0.3–0.5 μm particles inside and outside a stationary unoccupied cab parked inside a temporary enclosure filled with incense smoke contaminants. In this procedure a two-channel particle counting instrument sampled alternate positions inside and outside an unoccupied cab using equal lengths of sample hoses to these locations. This procedure was used to quantify cab protection factors of at least 50:1 (outside to inside particle concentrations) for a pesticide spraying company after refurbishing and performing maintenance on 13 tractor cabs.(5)
Particle counting measurements of submicron (0.3–1.0 μm) particulates in ambient air were further used by NIOSH during laboratory experiments with multiple instruments to study the key design factors of enclosed cab dust filtration systems.(6) During these experiments two particle counting instruments were alternated between test replicates to average out any measurement biases between instruments, similar to the ASAE procedure described above. The experimental tests were conducted in an unoccupied experimental cab test apparatus with a 2.0-m3 (72-ft3) inside enclosure volume, and at least four test replicates were completed for each cab test condition studied. These laboratory experiments studied the effects of intake filter efficiency, intake filter loading, intake air leakage around the filter, recirculation filter use, and wind on cab filtration system performance. Laboratory measurements showed that the largest number particles in the ambient air were submicron (0.3–1.0 μm) and that concentrations remained relatively constant during the testing on a particular day, but varied noticeably from day to day.(6) These experimental cab test results determined that intake filter efficiency and recirculation filter use were the two most important influential factors on cab filtration system performance.(6) The addition of a recirculation filter to the cab’s filtration system significantly reduced its particulate penetration performance by an order of magnitude and reduced the time to reach its lowest stable concentration after the entrance door is closed by about 60%.(6)
NIOSH most recently used this multiple-instrument particle counting method to study and quantify cab filtration system performance in the field. In cooperation with a mining equipment manufacturer, NIOSH examined the performance of a new cab filtration system design for the underground industrial minerals industry. This cab filtration system used a combination of three particulate filters (intake, recirculation, and final filter) to reduce the equipment operator’s exposure to dust and diesel particulates present in underground industrial mineral mines. Particle count testing and airflow measurements were initially conducted at the company’s manufacturing shop to examine the cab filtration system performance with several types of final filters and intake filter configurations.
The performance of this cab filtration system design was further studied in the field on several pieces of underground mining equipment. Four pieces of equipment with the new cab filtration system design were studied intermittently over a two- to seven-month period at two different underground limestone mines. The underground field dust and diesel sampling results from the seven-month study are described elsewhere by Cecala et al.(7) and Noll et al.(8) and showed inconsistent cab protection factors among production shifts because of unpredictable equipment operator practices, such as the frequency and duration of opening cab doors and the variability in HVAC system operation. Particle counting and HVAC airflow measurements were also made on these cabs in ambient air outside the mine between production shifts to better quantify their protection factor performance under more consistent cab operating test procedures. This article describes the particle counting method, measurement uncertainty analysis, and results obtained from studying the new cab filtration system at the manufacturing facility and during the field surveys.
METHODS AND APPARATUS
Cab Filtration Systems Tested
Figure 1 illustrates the new filtration system that was initially tested on a face drill cab at the manufacturing facility and was later tested in the field studies. The face drill’s cab at the manufacturing facility had an inside volume of at least 4.5 m3 (160 ft3). The cabs at the mines had inside volumes that ranged from 2.1 to 4.5 m3 (75 to 160 ft3). This filtration system uses the HVAC fan to jointly pull outside cab air through an external intake filter unit and interior cab air through a wall-mounted recirculation filter before routing this total airflow mixture through the HVAC heat exchangers, final filter, and cab interior. The final air filter was initially specified as a HEPA (efficiency ≥99.97 down to 0.3 μm particle sizes) with rectangular dimensions of 29.0-cm wide by 44.4-cm long by 9.7-cm deep (11.375-in. wide by 17.5-in long by 3.75-in. deep). An alternative final filter considered for the cab HVAC system was a similarly sized panel filter with an American Society of Heating, Refrigerating and Air-Conditioning Engineers (ASHRAE) minimum efficiency reporting value of 16 (MERV 16, efficiency ≥95% down to 0.3 μm particle sizes).(9) A pleated cellulose cylindrical intake cartridge pre-filter (20.3-cm diameter by 25.4-cm length or 8-in. diameter by 10-in. length) and rectangular recirculation panel pre-filter (7.6-cm width by 40.6-cm length by 5.1-cm depth or 3-in. width by 16-in. length by 2-in. depth) were both located upstream of the final filter to reduce dust loading of the higher-efficiency final filter. The intake filter was located in an external filter housing unit (referred to as a standard intake unit throughout the article) connected into the HVAC system with a flexible 7.62-cm (3-in.) diameter spiral tubing.
FIGURE 1.

New HVAC and filtration system design with an intake, recirculation, and final filter.
An optional fan-powered pre-cleaner intake filtering unit (referred to as a pressurizer intake unit throughout the article) with a MERV16 cylindrical intake filter (20.3-cm diameter by 33.0-cm length or 8-in. diameter by 13-in. length) was also tested to assist the HVAC system with pressurizing the cab. The cyclonic pre-cleaner fan centrifugally removed dust particles greater than 5 μm from the air upstream of the intake filter, thereby extending its operating life. Table I shows the various filtration system components that were tested on cabs at the manufacturing shop and in the two mine field studies.
TABLE I.
Filtration System Components Tested at the Manufacturing Shop and in the Field
| Cab Testing | Standard Intake A |
Pressurizer Intake UnitB |
Recirculation Filter C |
HEPA Final Filter |
MERV 16-A Final Filter |
MERV 16-B Final Filter |
|---|---|---|---|---|---|---|
| Drill Shop Test 1 | X | X | X | |||
| Drill Shop Test 2 | X | X | X | |||
| Drill Shop Test 3 | X | X | X | |||
| Drill Shop Test 4 | X | X | X | |||
| Mine A, Face Drill | X | X | X | |||
| Mine A, Scaler | X | X | X | |||
| Mine B, Face Drill | X | X | X | |||
| Mine B, Bolter | X | XC | X |
Unrated pre-filters.
Containing MERV 16 rated intake filter.
Recirculation filter removed in bolter after 526 hours of operation.
Cab Testing Procedures
Optical particle counters were used to measure airborne particles at the outside and inside locations of an unoccupied cab enclosure with the HVAC system running on maximum airflow speed settings while the mining vehicle was idling. Intake and recirculation airflows were also measured at the maximum airflow speed settings using hot wire and vane anemometers. The interior to exterior differential cab pressures were also measured.
The particle count instruments used during this study were hand-held MetOne Model HHPC-6 (six-channel) instruments (Hach Ultra Analytics, Grants Pass, Ore.). These instruments count airborne particles within the six channel size ranges of 0.3–0.5 μm, 0.5–0.7 μm, 0.7–1.0 μm, 1.0–3.0 μm, 3.0–5.0 μm, and ≥5.0 μm. The instruments operate at an airflow rate of 2.83 L/min and have selectable air sampling periods that are stored in a 500-sample rotating buffer (sample memory). These instruments provide particle count data in either concentrations or total number of particles measured in differential- or cumulative-sized sample statistics. The instruments’ specified coincidence error or error of undercounting particles hidden behind other particles is 5% for 70,670 particles/L or 2,000,000 particles/ft3.
Cab testing was conducted using two model HHPC-6 particle counters to simultaneously sample and record the inside and outside cab particle size concentrations for one-minute periods over a 30-minute-long test, as previously discussed in NIOSH’s laboratory cab experiments when using a recirculation filter.(6) Inside and outside instruments were alternately switched during the subsequent 30-minute test replicates. Instrument rotations between the inside and outside cab locations for an equal number of test replicates are intended to average out any instrument biases. The last 15 minutes of data from each test replicate were used to calculate the average outside and inside cab concentrations at the lowest steady-state particle count conditions inside the cab. A cab protection factor for each test replicate was determined by dividing the average outside particle concentration by the average inside particle concentration. It represents a reduction ratio of all the exterior and interior particles removed by the cab filtration and HVAC system.
At the mining machine manufacturing shop facility, four particle counting test replicates were performed on the cab for each filter combination studied. During the mine field studies, only two particle counting test replicates were conducted due to the time constraints encountered with testing two cabs after the production shift. Each cab could be particle counted in one hour for the two test replicates. Both cabs could be particle counted and have their airflows measured in less than two hours when using four HHPC-6 particle counters.
In order to examine the cab operating effects of different filter combinations at the manufacturer’s facility and the filter loading effects in the field, airflow readings were measured for the intake and recirculation circuits of the cab’s HVAC and filtration system. VELOCICALC hotwire anemometer models 8346 or 9555 (TSI Incorporated, Shoreview, Minn.) were used to measure the centerline air velocity inside the middle of a 122-cm (4-ft)-long section of smooth 10.2-cm (4-in.) diameter PVC pipe which was added to the inlet of the intake filtering unit. Both these hot wire instruments have the capacity to input the duct shape and dimensions to directly provide the air quantity measurements. For the recirculation component, one-minute moving traverse velocity measurements were made with a vane anemometer (Davis Instruments, Vernon Hills, Ill.) over the recirculation filter inlet area. The average air velocity value was then multiplied by the recirculation filter inlet area (307 cm2 or 0.33 ft2) to determine the recirculated airflow quantity.
The cab’s inside to outside differential static pressure was also measured to insure that cab pressurization was achieved. Cab pressure measurements were taken with either a 0.0–0.5 in. Magnehelic differential pressure water gauge (Dwyer Instruments, Inc., Michigan City, Ind.) or DP-CALC Model 5825 Micromanometers (TSI Incorporated). The magnehelic pressure gauge was used to spot check the cab pressure at the manufacturer’s facility and the DP-CALC was used inside the cab during production shifts of the field studies. The DP-CALC time recorded one-minute cab pressure averages during the production shifts.
Finally, engine operating hours were recorded on each vehicle cab studied in the field to document timelines for cab operation. The differential engine hours of operating time from the beginning of the field tests through the follow-up field tests were used to quantify the cabs’ operating performance over time.
Cab Protection Factor Measurement Uncertainty Analysis
The propagation of error analysis approach was used on the outside and inside particle count test data to estimate the uncertainty of the cab protection factors (PF = outside/inside, particle concentrations) measured for the shop and field test replicates. The 15 one-minute particle count samples collected outside and inside the cab during the last half of the test were averaged and used to calculate the cab protection factor (reduction ratio) for a test. The cab’s protection factor during a particular test configuration was determined from the average of the test replicates. Since the two-replicate cab test procedure used in the field is generally considered too small a sample size for determining the measurement uncertainty from the standard deviation of the two tests, an alternative propagation of error analysis approach (for a two-variable ratio) was used to determine the standard error of each test replicate and combine the test replicate standard errors by using Satterthwaite’s standard error approximation.(10,11) This approach uses the variation of the one-minute particle count samples collected from each test replicate to estimate the measurement uncertainty of the cab protection factor. The equations used for this uncertainty analysis and an example of their application in determining confidence intervals are shown in the Appendix of this article.
RESULTS
Shop Testing
Figure 2 shows a graph of the minimum, median, and maximum particle count concentrations measured in the various size ranges outside the cab with the MetOne HHPC-6 during all the shop testing at the manufacturer’s facility. As can be seen in Figure 2, the largest number of particles measured at the outside cab sampling location in the shop facilities was in the 0.3–0.5 μm size range with the smallest number of particles above 5.0 μm in size. Welding and grinding were taking place in other areas of the shop while cab testing was being conducted, and this contributed to the particle count concentration variations measured outside the cab while testing. The cumulative-sized particle concentrations (0.3–1.0 μm, 0.3–3.0 μm, and ≥0.3 μm) were similar, given that most of the particles counted were less than 1.0 μm. The average outside cab particle count concentrations for about half of the test replicates exceeded the instruments’ coincidence error specifications of 5% for 70,670 particles/L or 2,000,000 particles/ft3, thereby undercounting the outside particle concentrations and somewhat reducing the protection factors for these tests. Previous laboratory experiments with outside cab concentrations above and below the coincidence error specifications have suggested that these errors can be inconsequential when determining the cab’s relative protection performance.(6)
FIGURE 2.

Optical particle sizes measured outside the cab at the manufacturer’s facility.
Figures 3 and 4 illustrate the dynamics of outside and inside submicron (0.3–1.0 μm) particle concentrations measured in the shop during two MERV 16-B final filter cab tests with their associated cab protection factors. These two cab test replicates show that the outside cab particle count conditions can be steady or variable during cab testing around active industrial sites. The steady test conditions shown in Figure 3 had outside cab concentrations typically less than coincidence error specifications with an average protection factor of 51.5, while the variable conditions shown in Figure 4 had outside cab concentrations typically exceeding the coincidence error specifications with an average protection factor of 50.1. Exceeding the outside sampling instrument’s coincidence error specifications undercounts outside particles and appears to somewhat reduce the cab’s protection factor. This is further illustrated in Figure 4, where the corresponding increase in particle count concentrations at the end of the test corresponded to a decrease in the cab protection factor. Therefore, it is reasonably expected that the cab protection factor would be greater than measured when outside coincidence errors are present during cab testing.
FIGURE 3.

Test replicate with steady outside cab test concentrations and minimal coincidence errors.
FIGURE 4.

Test replicate with unsteady outside cab test conditions and coincidence errors.
Figure 5 shows the average cab protection factors and 95% confidence levels for the various shop tests (shown in Table I) determined at several cumulative particle size ranges. As can be seen in this figure, the protection factors were not significantly different between the smallest size range (0.3–0.5 μm) and the larger cumulative size ranges (0.3–1.0 μm, 0.3–3.0 μm, and ≥0.3 μm). Since the largest number of ambient particles outside the cab tends to be in the respirable size range of 0.3–1.0 μm, the cab protection factor results presented thereafter in this report will be based on this respirable size range.
FIGURE 5.

Final filter and pressurizer test results at the manufacturer’s facility.
The new system design with the HEPA final filter, non-pressurizing intake filtration unit, and recirculation filter provided the best cab protection factor of 81 as compared to the two MERV 16 final filter types tested (from different manufacturers) or by adding the pressurizer intake unit. The first MERV16-A final filter tested provided a cab protection factor of 5 as compared to 53 for the second MERV16-B final filter tested. The MERV16-B filter was selected as an alternative final filter type for field testing because of its superior performance in the shop tests. Adding the optional pressurizer intake unit to the original cab system design with the HEPA final filter provided a cab protection factor of 60. The cab pressure was increased from 0.15 to 0.18 in water gauge by adding the pressurizer intake unit.
Mine A Field Testing
Protection factors (with 95% confidence levels) and cab airflow field measurements for a face drill cab and scaling machine cab at the first underground limestone mine site are shown in Figures 6 and 7, respectively. Figure 6 is missing several data points because of an occasional time limitation to test the drill. Table I shows the cab filtration system components tested at Mine A. The face drill had a cab size of at least 4.5 m3 (160 ft3) and included the initial filtration system configuration tested at the manufacturer’s shop (HEPA final filter with standard intake filter unit and recirculation pre-filter). The scaling machine had a smaller inside cab volume of 2.1 m3 (75 ft3) with a filtration system identical to the face drill’s system, except that it used the optional pressurizer intake unit with a MERV 16 intake filter. Particle counting and airflow measurements were made outside the limestone mine between shifts in ambient air.
FIGURE 6.

Field test results for face drill cab at Mine A.
FIGURE 7.
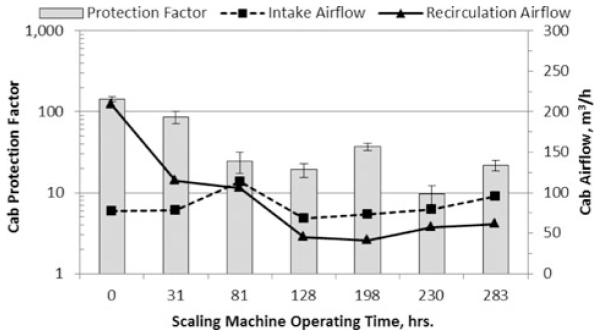
Field test results for scaling machine cab at Mine A.
As can be seen in Figure 6, the face drill initially had a protection factor of about 400 with new filters (0 hours) and increased to nearly 1,800 at 65 hours of operation with a drop off in airflow due to initial filter loading. After 240 hours of operation the cab protection factor decreased to 100 for the lowest intake and recirculation airflows measured. These protection factor changes were significant at the 95% confidence levels, because their confidence intervals did not coincide over the 240-hour testing period. This is an indication that some air started to bypass the filtration system after the filters additionally loaded up with dust and diesel particles during the production shifts in the mine. The drill cab pressure ranged from 32 Pa (0.13 inH2O) at the beginning of field testing to 10 Pa (0.04 inH2O) at the end of field testing. The cab pressure decrease from the start to the end of the testing was primarily attributed to a decrease in cab intake airflow from 137 m3/h (81 ft3/min) to 93 m3/h (55 ft3/min) caused by dust and diesel loading of the filters. Cab pressure is directly related to the amount of intake airflow quantity delivered into the cab.(6)
Figure 7 shows that the scaling machine had a protection factor of about 150 with new filters (0 hours) and that the protection factor trended down to 20 after 283 hours of operation, indicating that some of the cab airflow was also bypassing the filtration system. These protection factor changes were significant at the 95% confidence levels, because their confidence intervals did not coincide over the 283-hour testing period. After these tests visual examination of the final filter on the scaling machine indicated a few small sections of the filter media were damaged or breached during installation or by mine personnel removing the filter housing cover during interim periods when NIOSH was not present for cab testing. The scaling machine cab pressure ranged from 25 Pa (0.10 inH2O) at the beginning of field testing to 7 Pa (0.03 inH2O) at the end of field testing. This cab pressure decrease was more likely attributed to an increase in enclosure seal leakage to the outside given the increase in intake airflow from 77 m3/h (46 ft3/min) to 95 m3/h (56 ft3/min) at the start to the end of testing, respectively. Cab pressure is directly related to the amount of intake airflow quantity delivered into the cab.(6)
A second round of tests was planned using MERV 16-B final filters in both cab systems. A final filter modification of placing a protective screen over the exposed filter media was suggested by NIOSH to the equipment manufacturer before any more testing was conducted. Before the second round of tests could be initiated the mine was closed and testing was conducted at the second mine site (Mine B).
Mine B Field Testing
Protection factors (with 95% confidence levels) and cab airflow field measurements for a face drill cab and roof bolting machine cab at the second underground limestone mine are shown in Figures 8 and 9, respectively. Figures 8 and 9 are missing a few data points because of the occasional limited access time to the drill and bolting machine. The particular time that the recirculation filters were changed or removed is illustrated by a symbol * next to the operating time in the figures. Table I shows the cab filtration system components tested at Mine B. The face drill had a cab size of at least 4.5 m3 (160 ft3) and included the alternative filtration system configuration tested at the manufacturer’s shop (MERV 16-B final filter with standard intake unit and recirculation pre-filter). The MERV 16-B final filter had the protective screen over the filter media to protect it from damage during installation and operation. The roof bolter machine had a smaller inside cab volume of 2.3 m3 (80 ft3), and its filtration system was identical to the face drill’s system except that a pressurizer intake unit with a MERV 16 filter was installed in place of the standard intake unit. Particle counting and airflow measurements were made outside the limestone mine between shifts in ambient air.
FIGURE 8.

Field test results for face drill cab at Mine B (the symbol * marks the point in time that the recirculation filters were changed or removed).
FIGURE 9.

Field test results for roof bolting machine at Mine B (the symbol * marks the point in time that the recirculation filters were changed or removed).
As can be seen in Figure 8, the face drill initially had a protection factor of about 73 with new filters (0 hours) and steadily increased to over 1,000 after 174 hours of operation. These protection factor changes were significant at the 95% confidence levels due to the separation between their confidence intervals and were attributed to initial dust and diesel loading of the cab system’s filters in the mine. At the start of testing (0 hours), the recirculation airflow was noticeably higher (427 m3/h or 251 ft3/min) with the MERV16-B final filter as compared to the face drill cab filtration system using the HEPA final filter (245 m3/h or 144 ft3/min, see Figure 6) at Mine A. The recirculation airflow decreased significantly after the initial 174 hours of operation and was nearly restored to its initial airflow rate with recirculation filter replacements at 174 hr and 487 hr of operation. Protection factors remained above 1,000 for 717 hours of operation after the two recirculation filter changes.
At 726 hours of operation all the filters were removed and inspected. The used intake and final filter were placed back into the face drill to measure the HVAC system airflows without the recirculation filter to examine if this filtration configuration is a viable HVAC system option when using the standard intake unit. Since only a nominal 14 m3/h (8 ft3/min) of intake air flow could be achieved without the recirculation filter, the used recirculation filter was placed back into the cab to increase the intake airflow above 85 m3/h (50 ft3/min) and to continue with the long-term testing. As can be seen in Figure 8, the protection factor decreased to 680 after the filter inspections and increased back to over 1,000 before cab testing stopped at 1,132 hours of operation. The drill cab pressure ranged from 40 to 10 Pa (0.16 to 0.04 inH2O) during field testing, with the lower part of this range attributed to the decrease in cab intake airflow from 117 m3/h (69 ft3/min) to 83 m3/h (49 ft3/min) caused by the dust and diesel loading of the filters throughout the testing period.
Figure 9 shows that the roof bolter cab initially had a protection factor of about 133 with the new filters (0 hours) and the protection factor increased to over 1,000 after 106 hours of operation. These protection factor changes were significant at the 95% confidence levels because of the separation between their confidence intervals and were attributed to initial dust and diesel loading of the cab system’s filters in the mine. At the start of testing (0 hours) the recirculation airflow was also noticeably higher 381 m3/h (224 ft3/min) with the MERV16-B final filter compared to the scaling machine cab filtration system using the HEPA final filter (208 m3/h or 123 ft3/min, see Figure 7) at Mine A. The recirculation airflow decreased after the initial 106 hours of operation and was nearly restored to its initial airflow rate with recirculation filter replacements at 106 hr and 337 hr of operation. The cab’s protection factor decreased to 515 before the second filter replacement and increased back to above 1,000 after the recirculation filter was replaced for the second time at 337 hours.
At 526 hours of operation, the recirculation filter was removed to measure the HVAC system airflows without the recirculation filter and to examine if this filtration configuration is a viable HVAC system option when using the pressurizer intake unit. The recirculation and intake airflows were measured at 399 m3/h (235 ft3/min) and 87 m3/h (51 ft3/min), respectively, with the recirculation filter removed while using the pressurizer intake unit. This configuration initially provided a protection factor of 247 which increased to back over 1,000 after 707 hours of operation. The recirculation and intake airflows started to decrease after 707 hours of operation from the additional final filter loading (with no recirculation filter) while the cab protection factor remained above 1,000 throughout the remainder of 842 hours of testing. The bolter cab pressure was the lowest measured during the field studies at 12 to 5 Pa (0.05 to 0.02 inH2O) and was primarily attributed to a poorly sealed resin cartridge supply access door into the cab. This access door allows resin cartridges to be placed into the cab’s interior storage bin for pneumatic injection, by the operator, into a roof bolt hole during the bolt installation process. The access door had visual unsealed gaps around its perimeter.
DISCUSSION
The ambient air particle count concentrations at the manufacturing shop and in the field for many of the cab tests were higher than the specified coincidence errors of the instruments. Previous laboratory experiments with outside cab concentrations above and below the coincidence error specifications have indicated that these errors can be inconsequential when determining the cab’s relative protection performance.(6) Figure 10 shows the protection factors measured in the laboratory experiments for four particular cab test configurations conducted over a wide range of particle count concentrations in the ambient air. Two of these cab test configurations shown used a high-efficiency intake filter (>99% on particle sizes ≥0.3 μm) under calm and 16 km/h (10 mph) wind conditions. The two other test conditions shown used the same high-efficiency intake filter with the addition of a MERV15 recirculation filter under calm and 16 km/h (10 mph) wind conditions. These four particular test configurations were conducted with cab enclosure static pressures (≤12 Pa or 0.05 inH2O with no wind) that were typically below the equivalent air velocity pressure of the 16 km/h (10 mph) wind condition tested in the laboratory.(6)
FIGURE 10.

Replicated laboratory cab tests conducted with a wide range of outside particle count concentrations.
These laboratory tests clearly illustrate that the cab protection factors remained relatively the same or slightly decreased when outside cab concentrations exceeded the instrument’s coincidence error specification of 70,670 Particles/L. They also show that a recirculation filter improves the cab protection factor by about an order of magnitude and mitigates particle penetration into the cab from the wind as compared to using just an intake filter. A decrease in the cab protection factor was further observed when outside particle count concentrations were less than 20,000 Counts/L for the test condition without a recirculation filter and with no wind. This decrease suggests that the protection factor measurements of a cab without a recirculation filter may be subjected to an additional over-counting error of particulates generated inside the cab at the lower outside particle count test concentrations. Any internally generated cab particles will be counted as particles that penetrated the cab’s filtration system from the outside, thereby lowering its measured protection factor. Other studies have measured notable internal particulate generation from blower motors (200 to 1,800 Particles/L) and have used incense smoke generated around a vehicle cab tested inside a temporary constructed field enclosure when outside cab concentrations were less than 42,000 Particles/L to make this error insignificant.(3,5) The minimum outside particle count concentrations needed for cab testing is currently open to discussion, but the laboratory test results discussed here indicate that the minimum may be somewhere around 20,000 Counts/L. However, internal cab particulate generation and instrument coincidence errors both tend to err conservatively with respect to cab protection factor measurements.
Ideal cab particle counting testing would be performed at steady outside particle concentrations that are sufficiently high to reduce internal cab particulate generation biases and that are within the instrument’s coincidence error specifications. However, the laboratory, shop, and field results presented in this article show that cab testing with less than ideal particle counting conditions can adequately measure changes to and deficiencies in cab performance.
CONCLUSION
Particle counting inside and outside environmental cabs using ambient air with identical HVAC fan settings was found to be a reliable method for measuring cab filtration system performance in the field. Conducting these tests with an unoccupied cab in a nonproduction environment removes any operator impacts on cab performance while measuring the optimum cab protection factor performance. The propagation of error analysis approach for the cab protection factor ratio can be used to determine the standard error of each test, and the Satterthwaite’s standard error approximation can be used to estimate the combined standard error of the cab test replicates. This procedure utilized all the data from each test replicate to estimate the measurement uncertainty of the cab protection factor determined from a small number of test replicates. Although particle count concentrations varied during field testing, the propagation of error analysis accounted for both random and covariance errors during cab protection factor testing with the two-instrument test method. The propagation of error analysis does not account for coincidence errors present when outside particle count concentrations exceed the instrument’s specifications, but these errors tend to conservatively measure cab protection factors because of undercounting the outside cab particles.
Initial shop testing of a new cab filtration system design showed that most of the ambient air particles outside the cab tended to be below 1.0 μm in size and that the cumulative respirable size range of 0.3–1.0 μm provided a relevant particulate medium for testing unoccupied cabs while using ambient air. Cab particle count testing of multiple final filter alternatives at the manufacturer’s shop facility showed that the initial design with the HEPA final filter had a significantly higher cab protection factor of 81 compared to the cab protection factors of 5 and 51 achieved with the MERV 16-A and MERV16-B final filters, respectively. Adding a pressurizer intake unit increased the cab’s air pressure from 37 to 45 Pa (0.15 to 0.18 inH2O) while achieving a protection factor of 60.
Field testing showed that after the initial dust and diesel particulate loading of the filters on three of the four cab filtration systems, the protection factors significantly improved to greater than 1,000 with either of the HEPA and MERV 16-B final filters used. The one cab that showed a consistent decline in protection factor performance from 150 to 20 had visible damage to the HEPA final filter, allowing air to bypass the filter. The MERV 16-B final filters initially provided an additional 100 cfm of recirculation airflow on both cabs at Mine B compared to the HEPA final filters used at Mine A. However, the cabs at both mines experienced a significant drop off in recirculation airflow within 100 hours of operation. Recirculation filters were not replaced while using the HEPA final filters at Mine A, which diminished the cabs’ protection factors in less than 283 hours of operation. New recirculation filters were changed at Mine B in about 200-hour replacement intervals, extending the cabs’ effective operating time of the MERV 16 final filter by about three times over the HEPA filters at Mine A.
After an extended time of usage all the cab pressures were found to diminish because of intake airflow reductions and enclosure seal leakages to the outside. Therefore, the two-instrument particle counting method with intake and recirculation airflow measurements can provide beneficial cab performance benchmarking and servicing information for optimizing cab particulate protection performance in the field. Cab pressure measurements only indicate intake airflow and seal integrity changes to cab enclosures and do not necessarily provide information about the air quality that the cab filtration system is providing.
APPENDIX
Equation 1 provides a method to determine the standard error of estimate for the protection factor of a particle counting test.(10) This equation assumes that there are an equal number of outside and inside samples (n) collected during the test.(10) Covariance can be ignored in the equation if the variables are independent or there are insufficient pairs of data for a good estimate. Since outside and inside cab sample data are not independent, the covariance was included in the standard error of estimate calculations for the 15 pairs of concurrent sampling data collected per test replicate.
| (1) |
Where:
o = mean of outside particle concentrations,
so = standard deviation of outside particle concentrations,
RSDo = relative standard deviation of outside particle concentrations, so/o,
i = mean of inside particle concentrations,
si = standard deviation of inside particle concentrations,
RSDi = relative standard deviation of inside particle concentrations, si/i,
= covariance between outside and inside particle concentrations,
PF = protection factor, o/i
sPF = standard deviation of protection factor,
roi = correlation coefficient between outside and inside particle concentrations,
n = equal number of particle count samples taken inside and outside the cab.
Equation 2 illustrates the method for Satterthwaite’s standard error approximation for multiple test replicates, assuming unequal variances between test replicates.(11) Equation 3 shows how to determine the degrees of freedom for Satterthwaite’s approximation.(11)
| (2) |
| (3) |
Where:
sep = Satterthwaite’s standard error approximation,
sk = standard deviation of the kth test replicate,
nk = number of samples in the kth test replicate,
k = number of test replicates,
df = degrees of freedom.
The confidence levels for the protection factor of similar test replicates can be determined by multiplying the Satterthwaite’s standard error approximation (Eq. 2) by the student’s t-statistic for the calculated degrees of freedom (Eq. 3). This uncertainty analysis uses all the particle count sample data during each test replicate to estimate the confidence level of the average protection factor for the replicates. Table II in the text illustrates the particle count information and standard error calculations for four test replicates conducted with two HHPC-6 instruments on the initial drill cab filtration system design with a HEPA final filter at the manufacturing shop facility. The test information in Table II in the text shows the cumulative particle count concentrations measured for the 0.3–1.0 μm size range. The protection factor (PF) for replicate 1 would be calculated as follows:
The protection factor standard error of estimate for test replicate 1 would be calculated as follows:
TABLE II.
Initial Cab Filtration System Particle Counting Test Results Using the HEPA Final Filter
| Test Information | Test Replicate 1 | Test Replicate 2 | Test Replicate 3 | Test Replicate 4 |
|---|---|---|---|---|
| AOutside Average | 99,266 | 128,649 | 91,065 | 94,022 |
| AOutside Std. Dev. | 19,192 | 17,478 | 6314 | 10,129 |
| AInside Average | 1,301 | 1,668 | 1,114 | 1,074 |
| AInside Std. Dev. | 230 | 211 | 93 | 83 |
| Covariance | 4,142,231 | 3,162,488 | 498,549 | 758,239 |
| No. of Samples | 15 | 15 | 15 | 15 |
| BProtection Factor | 76.3 | 77.1 | 81.7 | 87.5 |
| CStandard Error | 1.32 | 1.41 | 0.93 | 1.14 |
0.3–1.0 μm sized particle count per liter.
Outside average ÷ inside average.
Standard error determined from Eq. 1.
The protection factors and standard error of estimates for the other test replicates would be similarly calculated. The Satterthwaite’s standard error approximation for all the test replicates would be the square root of the summation of the standard errors squared by using Eq. 2 as shown below for the four test replicates in Table II in the text.
The degrees of freedom for the Satterthwaite’s standard error approximation would be calculated by Eq. 3 and is shown below for the four test replicates. To be conservative, the degree of freedom calculation was rounded down to the nearest whole number which would be 51.
The average cab protection factor would be calculated by averaging the test replicates. When there are a balanced number of samples in each test replicate the average can be simply computed by the numeric average of the test replicates as shown below.
The 95% confidence level for the average protection factor of the test replicates is then determined by multiplying the Satterthwaite’s standard error approximation by the student’s t-statistic for the calculated 51 degrees of freedom. As determined from the above calculations using Table II in the text, the estimated 95% confidence level for the average protection factor of 80.6 would be (2.43 × 1.96) or ± 4.8.
By comparison, the calculation of the standard deviation, standard error, and confidence level using the protection factor for each test replicate would yield the following result:
Although the 2.58 standard error is similar to the Satterthwaite’s standard error approximation of 2.43, its 95% confidence level would be larger at ± 8.2 (2.58 × 3.182) because of the greater uncertainty in the student’s t-statistic for three degrees of freedom. Given the additional measurement uncertainty expected with conducting only two cab test replicates during the field studies, the alternate propagation of error analysis and Satterthwaite’s error approximation procedures were used to estimate the confidence levels from all the available sampling data collected during the two test replicates.
Footnotes
DISCLAIMER
The findings and conclusions in this report are those of the authors and do not necessarily represent the views of the National Institute for Occupational Safety and Health (NIOSH). Mention of any company name, product, or software does not constitute endorsement by NIOSH. This article not subject to U.S. copyright law.
REFERENCES
- 1.American Society of Agricultural Engineers (ASAE) Agricultural Cabs—Environmental Air Quantity, Part 1: Definitions, Test Methods, and Safety Practices. ASAE; St. Joseph Mich.: 1997. ([Standard S525-1.1] [Google Scholar]
- 2.Heitbrink WA, Hall RM, Reed LD, Gibbons D. Review of ambient aerosol test procedures in ASAE Standard 525. J. Agric. Saf. Health. 1998;4(4):255–266. [Google Scholar]
- 3.Heitbrink WA, Collingwood S. Aerosol generation by blower motors as a bias in assessing aerosol penetration into cab filtration systems. J. Occup. Env. Hyg. 2005;2(1):45–53. doi: 10.1080/15459620590903020. [DOI] [PubMed] [Google Scholar]
- 4.Heitbrink WA, Moyer ES, Jensen PA, Watkins DS, Martin SB. Environmental agricultural tractor cab filter efficiency and field evaluation. AIHA J. 2003;64:394–400. doi: 10.1080/15428110308984832. [DOI] [PubMed] [Google Scholar]
- 5.Moyer ES, Heitbrink WA, Jensen PA. Test for the integrity of environmental tractor cab filtration systems. J. Occup. Env. Hyg. 2005;2:516–523. doi: 10.1080/15459620500297519. [DOI] [PubMed] [Google Scholar]
- 6.Organiscak JA, Cecala AB. Key design factors of enclosed cab dust filtration systems. NIOSH; Pittsburgh, PA: 2008. (Report of Investigations No. 9677, DHHS (NIOSH) Publication No. 2009-103) [Google Scholar]
- 7.Cecala AB, Organiscak JA, Noll JD. Long-Term Evaluation of Cab Particulate Filtration and Pressurization Performance; Presented at the SME Annual Meeting; Seattle, Wash.. Feb. 2012. pp. 19–22. [Google Scholar]
- 8.Noll JD, Cecala AB, Organiscak JA, Rider JP. Field study on the effects of MERV 16 filters on enclosed cabs and routine work practices for reducing dust and DPM exposures. Min. Eng. in press. [PMC free article] [PubMed] [Google Scholar]
- 9.American Society of Heating, Refrigerating and Air-Conditioning Engineers (ASHRAE) Method of Testing General Ventilation Air-Cleaning Devices for Removal Efficiency by Particle Size. ASHRAE; Atlanta, GA: 1999. [Standard 52.2] [Google Scholar]
- 10.Bevington PR. Data Reduction and Error Analysis for the Physical Sciences. McGraw-Hill Book Company; New York: 1969. pp. 60–64. [Google Scholar]
- 11.Satterthwaite FE. An approximate distribution of estimates of variance components. Biometrics Bulletin. 1946;2(6):110–114. [PubMed] [Google Scholar]