

Abstract
Background
A perception exists that residents are more costly than midlevel providers (MLPs). Since graduate medical education (GME) funding is a key issue for teaching programs, hospitals should conduct cost-benefit analyses when considering staffing models.
Objective
Our aim was to compare direct patient care costs and length of stay (LOS) between resident and MLP inpatient teams.
Methods
We queried the University HealthSystems Consortium clinical database (UHC CDB) for 13 553 “inpatient” discharges at our institution from July 2010 to June 2013. Patient assignment was based on bed availability rather than “educational value.” Using the UHC CDB data, discharges for resident and MLP inpatient teams were compared for observed and expected LOS, direct cost derived from hospital charges, relative expected mortality (REM), and readmissions. We also compared patient satisfaction for physician domain questions using Press Ganey data. Bivariate analysis was performed for factors associated with differences between the 2 services using χ2 analysis and Student t test for categorical and continuous variables, respectively.
Results
During the 3-year period, while REM was higher on the hospitalist-resident services (P < .001), LOS was shorter by 1.26 days, and per-patient direct costs derived from hospital charges were lower by $617. Patient satisfaction scores for the physician-selected questions were higher for resident teams. There were no differences in patient demographics, daily discharge rates, readmissions, or deaths.
Conclusions
Resident teams are economically more efficient than MLP teams and have higher patient satisfaction. The findings offer guidance when considering GME costs and inpatient staffing models.
What was known and gap
There is limited knowledge about the impact of residents on hospitalist teams on the cost of care, and hospitals lack data to select among alternative staffing models.
What is new
Length of stay was shorter, and per-patient direct costs from hospital charges were lower on the hospitalist-resident teams compared to hospitalist–midlevel practitioner (MLP) teams.
Limitations
Single institution, single specialty study limits generalizability.
Bottom line
Hospitalist-resident teams are more economically efficient and have higher patient satisfaction than hospitalist-MLP teams.
Introduction
Federal and state governments, through Medicare and Medicaid, provide nearly $20 billion annually to support graduate medical education (GME).1 The need for this funding is being debated, as some question the need to subsidize resident education while others argue support is needed.2,3 The Institute of Medicine has recommended changes over the next decade that align GME funding with outcomes and performance.4 A perception also exists that, despite receiving lower compensation than alternatives, such as attendings or midlevel practitioners (MLPs), residents are a financial burden to hospitals through inefficiency, increased use of ancillary services, and greater use of drugs and medical supplies.5 Because efficient patient care teams are paramount to hospital finances, we compared hospitalist-resident and hospitalist-MLP inpatient teams on direct patient care costs and length of stay (LOS) using the University HealthSystems Consortium clinical database (UHC CDB). The UHC CDB data are derived from an alliance of 120 academic medical centers and 299 affiliate hospitals, and facilitate comparisons. We also assessed patient satisfaction for both types of teams.
Methods
We abstracted Upstate Medical University Department of Medicine's administrative discharge data during the 3-year period from July 2010 to June 2013 from the UHC CDB. Because UHC does not apply risk modeling for patients admitted under “observation” status, only “inpatient” discharges were included in the analysis.
We evaluated 13 650 “inpatient” discharges. Of these, 107 were excluded because of incomplete financial data, resulting in a final sample size of 13 553. Discharges were classified as covered (hospitalist with residents) or uncovered (hospitalist with MLPs). The primary determinant of team assignment was bed availability to promote team geography, rather than patients' “educational value.” Hospitalist-resident teams were composed of 1 hospitalist, 1 senior resident, 2 interns, and students (1 to 2 clerkship students and, at times, a medical student acting intern). Teams had a “hard” patient cap of 20. Overnight coverage was provided by a core group of nocturnal residents (2 seniors, 2 interns), with supervision via an in-house nocturnal hospitalist. Hospitalist-MLP teams were made up of 1 hospitalist, 1 MLP, and, at times, a medical student acting as the intern. These teams had a “soft” cap of 16 (which could be exceeded if required by the hospital census). Overnight coverage for all uncovered teams was provided by the same nocturnal hospitalist. The MLP worked an average of 50 hours weekly with weekends off. Hospitalists rotated on both service types and had no other clinical responsibilities while on service. During the study period, we operated 5 covered services and 3 uncovered services.
Data were analyzed for direct patient care costs and LOS on patients discharged from the medicine services. The observed direct cost for each discharge was obtained from the UHC CDB, which was derived from hospital charges. For each hospital-reported line item charge, the unadjusted direct cost was determined using ratios of cost to charge according to revenue code assigned to that item. The observed direct cost was derived by adjusting for wage index applied to the labor portion of the cost. Observed direct patient care costs and observed LOS were compared with expected patient care costs and expected LOS, as determined by UHC risk adjustment models.6 UHC does not perform the same analysis for indirect or total costs, so we limited our analysis to direct costs. Differences (O − E) and ratios (O / E) between observed and expected values were calculated for each end point. We obtained relative expected mortality (REM) from the UHC CDB, which provides a qualitative description of the patient's percentage expected mortality, in comparison with other patients in the same base Medicare severity-diagnosis related group or model group.
We also evaluated the Hospital Consumer Assessment of Healthcare Providers and Systems (HCAHPS) and the Press Ganey physician performance survey domains for covered and uncovered patients. HCAHPS scores were evaluated based on Centers for Medicare & Medicaid Services (CMS) funding requirements of “top box” scores, with only “always” responses receiving credit. Press Ganey scores were on a Likert scale and were converted into normalized values (−1 for unfavorable responses, 0 for neutral, and 1 for positive responses).
The study was declared exempt by our Institutional Review Board.
Bivariate analysis was performed for factors associated with differences between the 2 service types using χ2 analysis and Student t test for categorical and continuous variables, respectively. Differences between services in O − E and O / E for direct patient care costs and LOS were assessed using Student t test. Factors with 2-tailed P value < .05 were considered statistically significant. All analyses were performed using SPSS version 20.0 (IBM Corp).
Results
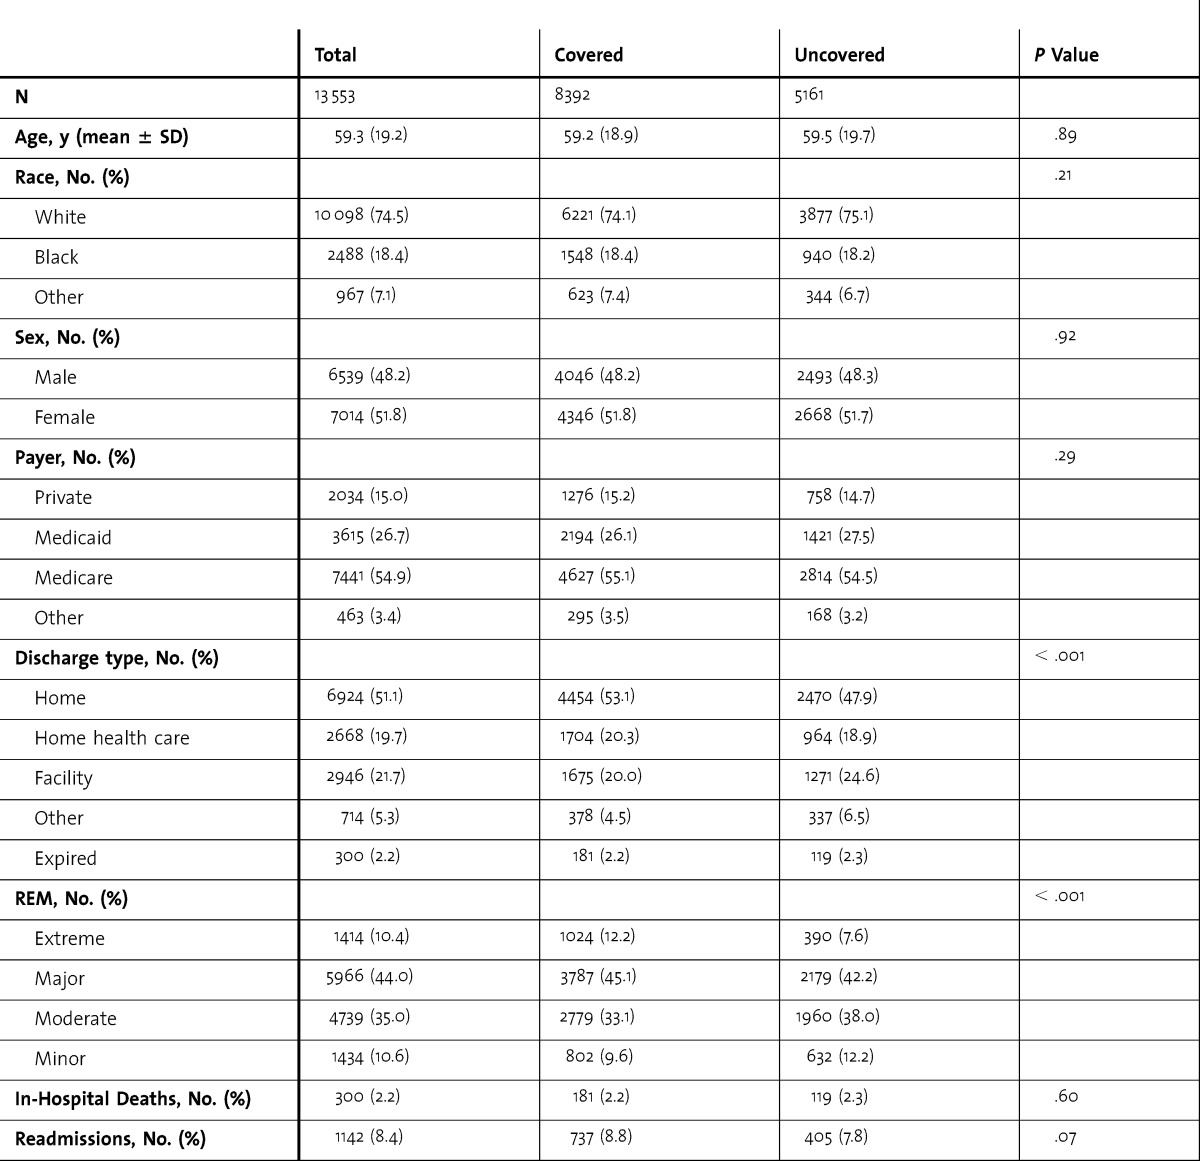
table 1 provides data on demographics, discharge type, REM, in-hospital deaths, and 30-day readmissions. There was no significant difference in age, sex, or self-identified race between covered and uncovered discharges. Covered discharges included a greater proportion of home discharges, despite caring for patients with higher REM and longer critical care requirements. There was no difference in the average number of discharges per day, per service type (covered 1.53 versus uncovered 1.57). In-hospital deaths and 30-day readmission rates were similar between the 2 service types.
TABLE 1.
Comparison of Demographics, Discharge Type, Relative Expected Mortality (REM), In-Hospital Deaths, and 30-Day Readmissions Between Covered and Uncovered Services
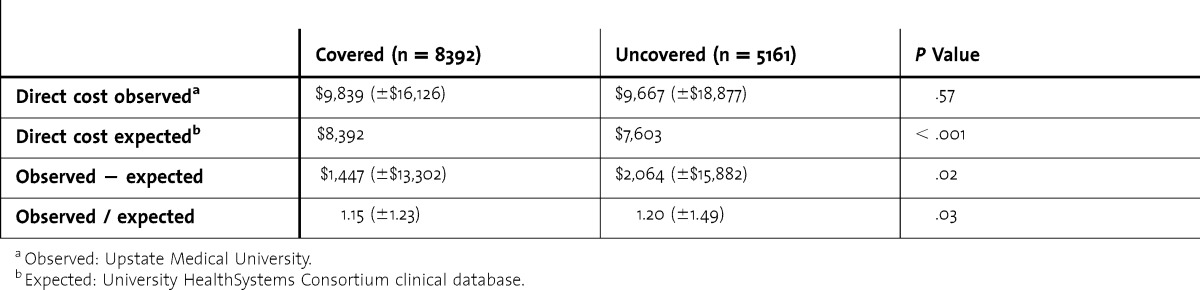
Although observed direct costs per hospital discharge for both service types were greater than anticipated, the expected direct costs per hospital discharge were significantly higher for covered compared to uncovered services (table 2). The observed minus expected direct costs averaged $617 less for a covered discharge than for an uncovered discharge (P = .02).
TABLE 2.
Comparison of Direct Costs Between Covered and Uncovered Services
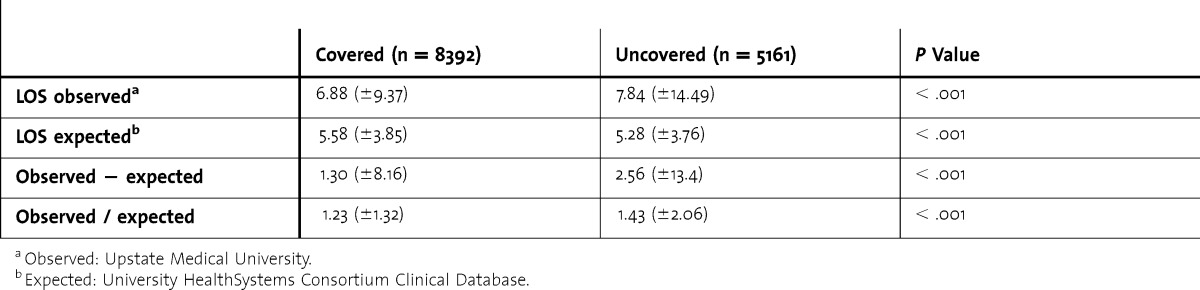
Observed LOS was greater than expected for covered and uncovered discharges, and expected LOS was significantly higher for covered discharges, resulting in a smaller difference and decreased ratio between observed and expected LOS for covered discharges compared to discharges by hospitalist-MLP teams (table 3). Hospitalist-resident teams saved 1.26 days per patient.
TABLE 3.
Comparison of Length of Stay (LOS) Between Covered and Uncovered Services
Compensation (salaries and benefits) for the 3-year study period for MLPs resulted in a cost of $195 per discharge; resident stipends and benefits resulted in a $173 cost per discharge. Additional resident noncompensation expenses (including funding for the program director, associate program directors, and support staff; resident recruitment expenses; and educational costs, such as simulation training, in-service examinations, scientific meetings, and social events) during the same time period were $140,040 for the 15 residents ($9,336 per resident), or $16.57 per case. The $9,336 per resident is within the range reported by Kelly et al,7 in which noncompensation costs, termed “hidden costs,” for a 2006 sample of 8 core Accreditation Council for Graduate Medical Education residency programs comprising 461 trainees at 1 academic medical center, were estimated to be $1,500 to $9,417, with an average of $4,439 per resident. The combined stipend and noncompensation costs for residents were $189.57 ($173 + $16.57) per discharge, less than the $195 for the hospitalist-MLP team.
We compared patient satisfaction scores for covered and uncovered discharges using HCAHPS and the Press Ganey physician-related questions (tables 4 and 5). Percentage survey response was statistically higher for patients discharged by hospitalist-resident teams (6.7% versus 5.6%). The covered team had statistically higher scores on physician-related HCAHPS questions, and a Press Ganey question regarding physician time spent with patient.
TABLE 4.
Odds Ratios Between Hospital Consumer Assessment of Healthcare Providers and Systems (HCAHPS) Covered and Uncovered Satisfaction Scores
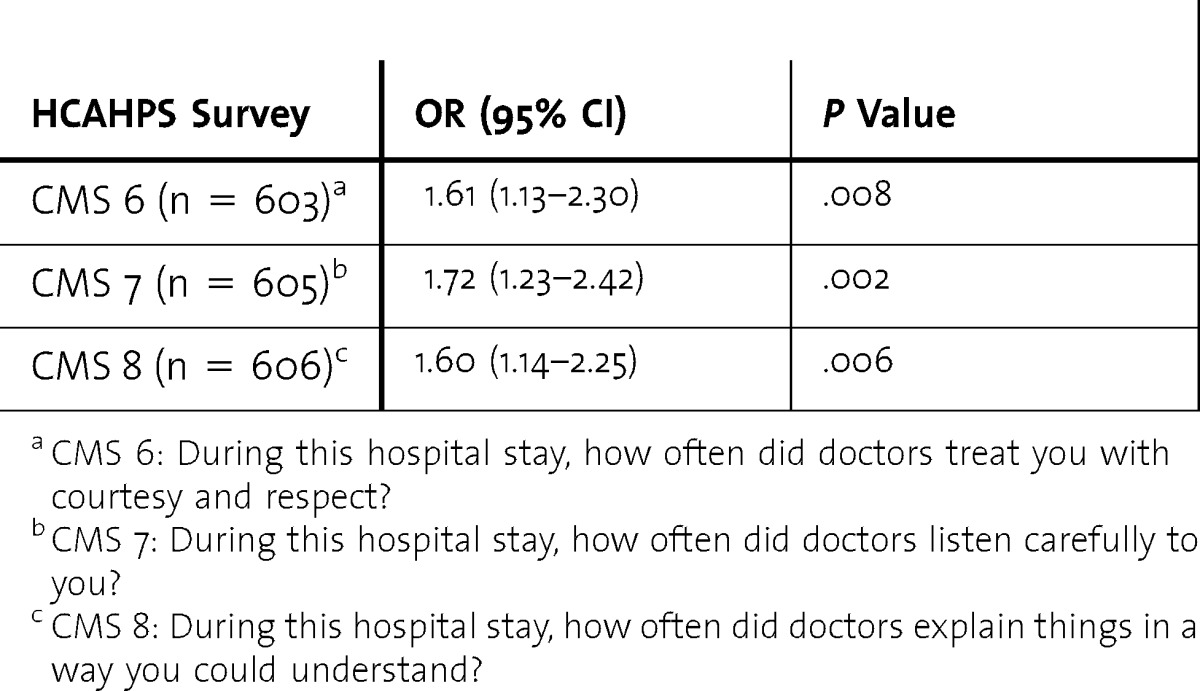
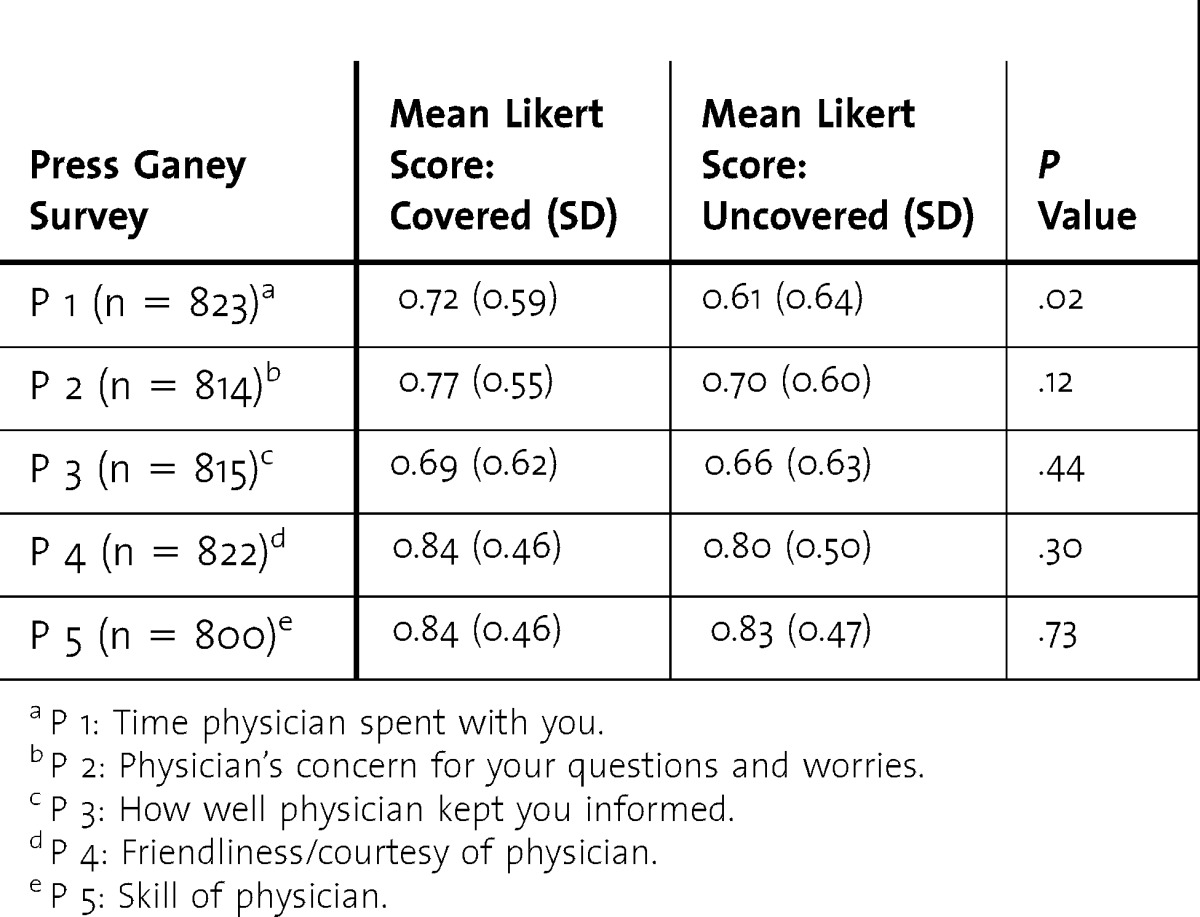
TABLE 5.
Comparison of Covered and Uncovered Press Ganey Satisfaction Scores
Discussion
Using the UHC CDB and risk models, we found that hospitalist-resident teams had lower patient care costs and LOS than hospitalist-MLP teams, with no difference in mortality and readmission rates. For the 8392 covered discharges during the study period, the lower cost of $617 per discharge would result in a savings of nearly $5.2 million. Even after adjusting for additional resident noncompensation costs, the savings would remain substantial. We estimated that reducing LOS by 1 day per patient reduced cost by approximately $1,050 per patient; and the 1.26 LOS reduction found in our study represents an estimated decrease in costs of $1,323 per discharge, or approximately $11 million in savings during the study period. Our analysis suggests an annual savings of more than $5 million could be achieved at our institution by replacing our MLP teams with resident teams.
We also found that resident teams had a higher patient satisfaction score for the physician-related questions. Since the CMS began withholding payments to hospitals in October 2012, resident-associated higher patient satisfaction could have resulted in greater savings.
Few studies have discussed the cost of replacing residents with MLPs. A time and motion study of internal medicine residents found that only about half of the work performed by residents could be replaced by MLPs.8 Previous reports that have compared outcomes between residents and MLPs found no differences in mortality, adverse events, readmissions, and patient satisfaction between MLP-associated (specifically, physician assistant) and resident-associated hospitalist services.9,10
We also found statistically higher physician-related HCAHPS scores and “physician time with patient” Press Ganey scores for patients on covered services. Neither survey, however, is specific to provider type, with HCAHPS referring to “the doctors” (which could be one or a combination of attending, resident, MLP, or student) and Press Ganey using “the physician” (again, open to interpretation). Resident involvement in care may have an impact on the perception of or actual time spent with each patient, hence why that single domain remained statistically significant in the Press Ganey survey.
Our study has several limitations. We focused only on internal medicine services, examined costs for residents on the inpatient service, and did not look at costs associated with other rotations. UHC CDB does not provide expected values for indirect or total costs, allowing us to examine only direct patient care costs. We also did not control for potential differences in medical record documentation. Documentation issues also could have accounted for our findings that observed LOS was higher than expected LOS for both types of teams. The low patient satisfaction survey response rate may limit generalizability.
Of note, we calculated the financial benefit of hospitalist-resident teams without accounting for federal support of residency education. Taking funding into account would further support the financial advantage of employing residents. When taking into account CMS-supported postgraduate positions, the cost savings of hospitalist-resident teams becomes more significant.
Conclusion
We compared direct patient care costs and LOS, finding that hospitalist-resident teams were economically more efficient than hospitalist-MLP teams. Our analysis suggested that more than $5 million in annual savings could have been achieved at our institution if the latter were replaced with the former. Our approach is worthy of consideration at other institutions, particularly as the future of GME funding is under consideration.
Footnotes
Michael C. Iannuzzi, MD, MBA, is Professor and Chair, Department of Medicine, Upstate Medical University; James C. Iannuzzi, MD, MPH, is Associate Scientist, Surgical Health Outcomes & Research Enterprise (SHORE), University of Rochester Medical Center; Andrew Holtsbery, BS, is Senior Programmer Analyst, Upstate Medical University; Stuart M. Wright, CPA, MBA, is Chief Financial Officer, Upstate Medical University; and Stephen J. Knohl, MD, is Associate Professor, Program Director, and Vice Chair for Education, Department of Medicine, Upstate Medical University.
Funding: The authors report no external funding source for this study.
Conflict of interest: The authors declare they have no competing interests.
References
- 1.Dower C. Health policy briefs: graduate medical education. Health Affairs. August 16, 2012. http://www.healthaffairs.org/healthpolicybriefs/brief.php?brief_id=73. Accessed November 24, 2014. [Google Scholar]
- 2.Chandra A, Khullar D, Wilensky GR. The economics of graduate medical education. N Engl J Med. 2014;370(25):2357–2360. doi: 10.1056/NEJMp1402468. [DOI] [PubMed] [Google Scholar]
- 3.Grover A, Slavin PL, Wilson P. The economics of academic medical centers. N Engl J Med. 2014;370(25):2360–2362. doi: 10.1056/NEJMp1403609. [DOI] [PubMed] [Google Scholar]
- 4.Institute of Medicine. Graduate Medical Education That Meets the Nation's Health Needs. Washington, DC: The National Academies Press; 2014. [PubMed] [Google Scholar]
- 5.Cameron JM. The indirect costs of graduate medical education. N Engl J Med. 1985;312(19):1233–1238. doi: 10.1056/NEJM198505093121906. [DOI] [PubMed] [Google Scholar]
- 6.Meurer S. Mortality Measurement. Rockville, MD: Agency for Healthcare Research and Quality; 2009. Mortality risk adjustment methodology for University Health System's Clinical Data Base. [Google Scholar]
- 7.Kelly SP, Tibbles C, Barnett SR, Schwartzstein RM The “hidden costs” of graduate medical education in the United States. J Grad Med Educ. 2012;4(2):267–268. doi: 10.4300/JGME-D-12-00038.1. [DOI] [PMC free article] [PubMed] [Google Scholar]
- 8.Knickman JR, Lipkin M, Jr, Finkler SA, Thompon WG, Kiel J. The potential for using non-physicians to compensate for the reduced availability of residents. Acad Med. 1992;67(7):429–438. doi: 10.1097/00001888-199207000-00003. [DOI] [PubMed] [Google Scholar]
- 9.Dhuper S, Choksi S. Replacing an academic internal medicine residency program with a physician assistant—hospitalist model: a comparative analysis study. Am J Med Qual. 2009;24(2):132–139. doi: 10.1177/1062860608329646. [DOI] [PubMed] [Google Scholar]
- 10.Carzoli RP, Martinez-Cruz M, Cuevas LL, Murphy S, Chiu T. Comparison of neonatal nurse practitioners, physician assistants, and residents in the neonatal intensive care unit. Arch Pediatr Adolesc Med. 1994;148(12):1271–1276. doi: 10.1001/archpedi.1994.02170120033005. [DOI] [PubMed] [Google Scholar]