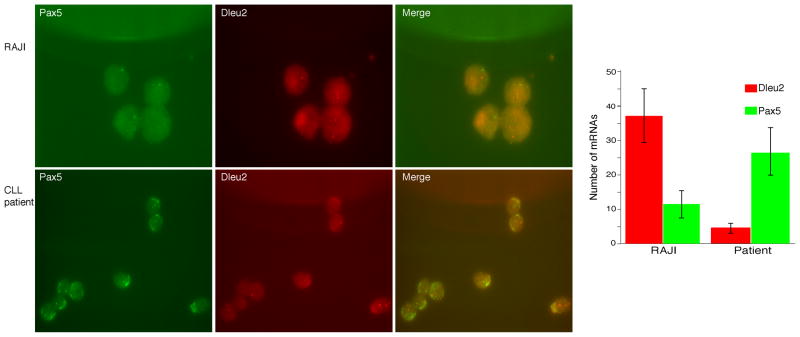
Fig. 3. In situ RNA FISH Analysis of Dleu2 and Pax5 mRNA levels.
Cell were grown on poly L-lysine coated coverslips and hybridized with single molecule FISH probes. Dleu2 probes labeled were with TMR and Pax5 probes were labeled with Alexa 594. The z-stacks obtained from each fluorescence channel were merged and coded to represent Pax5 as red and Dleu2 as green. Each spot represent single mRNA molecule [65]. The right panel is the merge of both channels and the chart represents the mean values from multiple analysis ± SEM.

