

Abstract
Background
Individuals with autism spectrum disorders (ASD) often exhibit symptoms of Attention-Deficit/Hyperactivity Disorder (ADHD). Across both disorders, observations of distributed functional abnormalities suggest aberrant large-scale brain network connectivity. Yet, common and distinct network correlates of ASD and ADHD remain unidentified. Here, we aimed to examine patterns of dysconnection in school-age children with ASD, ADHD and typically developing children (TDC) who completed a resting state fMRI (R-fMRI) scan.
Methods
We measured voxel-wise network centrality, functional connectivity metrics indexing local (degree centrality; DC) and global (eigenvector centrality; EC) functional relationships across the entire brain connectome, in R-fMRI data from 56 children with ASD, 45 children with ADHD and 50 TDC. A one-way ANCOVA, with group as fixed factor (whole-brain corrected), was followed by post-hoc pair-wise comparisons.
Results
Cortical and subcortical areas exhibited centrality abnormalities; some common to both ADHD and ASD, such as in precuneus. Others were disorder-specific and included ADHD-related increases in DC in right striatum/pallidum, in contrast with ASD-related increases in bilateral temporolimbic areas. Secondary analyses differentiating children with ASD into those with or without ADHD-like comorbidity (ASD+ and ASD−, respectively) revealed that the ASD+ group shared ADHD-specific abnormalities in basal ganglia. By contrast, centrality increases in temporolimbic areas characterized children with ASD regardless of ADHD-like comorbidity. At the cluster level eignevector centrality group patterns were similar to DC.
Conclusions
ADHD and ASD are neurodevelopmental disorders with distinct and overlapping clinical presentations. This work provides evidence for both shared and distinct underlying mechanisms at the large-scale network level.
Keywords: Autism, ADHD, Network Centrality, Functional Connectivity, resting state fMRI, Caudate, amygdala, precuneus
Introduction
Inattention and hyperactivity/impulsivity, cardinal symptoms of Attention-Deficit/Hyperactivity Disorder (ADHD), are frequently reported in individuals with autism spectrum disorders (ASD) (1, 2) and are associated with substantial impairment and decreased effectiveness of treatments (e.g., 3). Accordingly, clinicians and researchers support elimination of the DSM-IV diagnostic criterion preventing the co-occurring diagnoses of ADHD and ASD. Yet, beyond extensive supportive clinical and epidemiological data (2, 4–8), commonalities and distinctions in the neurobiological correlates of ADHD and ASD have been rarely investigated. This is particularly true for neuroimaging (9–11).
Independent examinations of ADHD and ASD increasingly emphasize a role for dysconnectivity in large-scale networks in both disorders (for reviews: 12, 13–15), particularly in the default network (e.g., 16, 17–21) and in fronto-parietal-striatal circuitry (e.g., 17, 22, 23–25). Given the fundamental distinctions between the prototypic clinical presentations of ASD and ADHD, marked differences in their neural signatures would be expected. Instead, studies directly comparing the neural correlates of ASD and ADHD have found potential commonalities, along with disorder-specific correlates (10, 11). A preliminary voxel-based morphometry study comparing children with ASD, ADHD and typically developing controls (TDC; 15 per group) revealed common gray matter reductions in medial temporal and left inferior parietal cortex for the clinical groups, and ASD-specific reductions in supramarginal gyrus; no ADHD-specific findings were observed (11). Similarly, a recent functional magnetic resonance imaging (fMRI) study directly comparing boys with ASD to those with ADHD and to TDC (20 per group) on a sustained attention task found that both clinical groups exhibited hyperactivation (reduced deactivation) within the precuneus, a default network hub, as well as hypoactivation in areas implicated in attentional control such as superior parietal cortex and striatum. Disorder-specific patterns were also noted, including hypoactivation of dorsolateral prefrontal cortex in ADHD and cerebellar hyperactivation in ASD (10). Although these studies focused on regions rather than circuits, the widely distributed nature of their findings, consistent with the MRI literature for each of the disorders (26–28), further supports the notion of dysconnectivity in large-scale networks. Still, the connectivity features underlying ASD and ADHD have not been directly compared (29).
Here, we examined shared and distinct patterns of dysconnectivity in ASD and ADHD. Given the increasing number of circuits implicated in both disorders (13, 14), we carried out full-brain exploration of the functional connectome using resting state fMRI data obtained from a substantial sample of children with ASD (n=56) and age- and sex-matched children with ADHD (n=45) and TDC (n=50). To achieve this goal, we analyzed voxel-wise network centrality. This graph-based measure of network organization captures the functional relationships of a given voxel (node) within the entire connectivity matrix of the brain (connectome), rather than with specific nodes or networks (30–35).
A variety of metrics index network centrality, each emphasizing a different aspect of whole-brain information flow within the connectome (30). We used two commonly employed measures, degree centrality (DC; 30, 31, 34) and eigenvector centrality (EC; 36). DC is a local measure of the connectome graph indexing the number of direct connections for a given node. A node has high DC if it has numerous direct connections to other nodes. By contrast, a node has high EC when it is connected with nodes that are highly-connected. EC is a relative global measure that indexes the qualitative superiority of a node’s connections, rather than the number of direct connections per se. Accordingly, examining voxel-wise DC and EC allowed comparisons between ASD and ADHD of local and global information processing within the functional connectome without requiring selection of a priori nodes or networks-of-interest.
Finally, despite comorbid ADHD symptomatology in 30–60% of children with ASD (2, 4–7, 37), this overlap is rarely acknowledged in neuroimaging studies – potentially confounding findings. To explore the extent to which ADHD-like comorbidity in ASD shares common neural correlates with ADHD, secondary analyses subdivided the ASD group to compare those with comorbid ADHD symptoms (ASD+) to those without comorbid ADHD symptoms (ASD−).
Methods
Participants
We examined data from 158 children (7.1–13.9 years); seven were excluded for excessive movement. Of the remaining 151, 56 children with ASD were group-matched for age, sex, and handedness with 45 children diagnosed with ADHD and 50 TDC, selected from ongoing studies (Table 1). Clinicians’ DSM-IV-TR diagnoses of Autistic Disorder, Asperger’s Disorder, or Pervasive Developmental Disorder Not-Otherwise-Specified (n=39, n=15, and n=2, respectively) were supported by the Autism Diagnostic Observation Schedule, (38, 39)
Table 1.
Characteristics of the Groups
|
TD N=50 |
ASD N=56 |
ADHD N=45 |
Group Comparisons | Post-Hoc | ||||||
|---|---|---|---|---|---|---|---|---|---|---|
|
| ||||||||||
| M | SD | M | SD | M | SD | F | df | p | ||
|
| ||||||||||
| Age | 10.7 | 1.8 | 10.1 | 1.8 | 9.9 | 1.8 | 2.71 | 2, 148 | 0.07 | - |
|
| ||||||||||
| Full IQ | 115 | 13 | 108 | 16 | 110 | 13 | 3.30 | 2, 148 | 0.04 | TDC>ASD |
| Verbal IQ | 116 | 13 | 107 | 15 | 111 | 13 | 5.21 | 2, 147 | 0.01 | TDC>ASD |
| Performance IQ | 112 | 14 | 108 | 18 | 108 | 13 | 0.96 | 2, 147 | 0.39 | - |
|
| ||||||||||
| CPRS-R:L T scores | ||||||||||
| DSM-IV Inattentive | 45 | 5 | 64 | 11 | 68 | 9 | 87.1 | 2, 144 | <0.00 | TDC<ASD=ADH |
| DSM-IV H-I | 47 | 6 | 66 | 12 | 71 | 11 | 73.7 | 2, 144 | <0.00 | TDC<ASD=ADH |
| DSM-IV Total | 46 | 6 | 66 | 11 | 71 | 9 | 100.43 | 2, 144 | <0.00 | TDC<ASD<ADH |
| Anxious/Shy | 45 | 5 | 61 | 13 | 52 | 8 | 33.9 | 2, 144 | <0.00 | TDC<ADHD<AS |
|
| ||||||||||
| CTRS-R:L T Scores | ||||||||||
| DSM-IV Inattentive | 46 | 5 | 57 | 9 | 62 | 11 | 31.6 | 2, 130 | <0.00 | TDC<ASD<ADH |
| DSM-IV H-I | 47 | 8 | 57 | 11 | 65 | 13 | 24.3 | 2, 130 | <0.00 | TDC<ASD<ADH |
| DSM-IV Total | 47 | 6 | 58 | 9 | 64 | 12 | 35.6 | 2, 130 | <0.00 | TDC<ASD<ADH |
| Anxious/Shy | 50 | 11 | 63 | 14 | 56 | 10 | 13.9 | 2, 130 | <0.00 | TDC<ADHD=AS |
|
| ||||||||||
| SRS-Parent | 43 | 6 | 78 | 12 | 53 | 6 | 199. | 2, 143 | <0.00 | TDC<ADHD<AS |
|
| ||||||||||
| SRS-Teacher | 44 | 5 | 62 | 10 | 54 | 11 | 39.6 | 2, 124 | <0.00 | TDC<ADHD<AS |
|
| ||||||||||
| ADOS Module 3* | ||||||||||
| ADOS Total | - | 14 | 5 | - | - | - | ||||
| Social Affect Total | - | 10 | 4 | - | - | - | ||||
| Restricted Repetitive Behaviors | - | 3 | 1 | - | - | - | ||||
| Scaled Severity Score | - | 7 | 2 | - | - | - | ||||
|
| ||||||||||
| N (%) | N (%) | N (%) | χ2 | df | p | |||||
|
| ||||||||||
| Males | 37 (74) | 49 (88) | 37 (82) | 3.2 | 2 | 0.20 | - | |||
|
| ||||||||||
| SES (class 4 or 5) | 36 (72) | 40 (71) | 34 (76) | 0.5 | 2 | 0.77 | - | |||
|
| ||||||||||
| Race** | ||||||||||
| Caucasian | 19 (38) | 33 (59) | 23 (51) | 6.3 | 4 | 0.18 | - | |||
| African-American | 14 (28) | 8 (14) | 6 (13) | |||||||
| Other*** | 13 (26) | 11 (20) | 10 (22) | |||||||
|
| ||||||||||
| Medication Status | ||||||||||
| Medication naïve | - | 29 (52) | 28 (62) | 5.69 | 3 | 0.13 | - | |||
| Not naïve but off | - | 12 (21) | 9 (20) | |||||||
| Current Stimulant Treatment^ | - | 9 (16) | 8 (17) | |||||||
| Current Non-Stimulant | - | 6 (11) | 0 (0) | |||||||
Note: ADOS: Autism Diagnostic Observation Schedule; df=degrees of freedom; CPRS-R:L: Conners’ Parent Rating Scales Revised Long Version (one parent of ADHD and three parents of TDC did not complete the CPRS-R:L); CTRS-R:L: Conners’ Teacher Rating Scales Revised Long Version (CTRS-R:L were not completed for 15, 1, and 2 of the TDC, ADHD, and ASD, respectively); DSM-IV: Diagnostic & Statistical Manual-4th edition; H-I: Hyperactivity/Impulsivity score; IQ: Intelligence Quotient (Verbal IQ and Performance IQ were not available for one TDC for whom only two scales of the WASI were administered); M=group mean; SD=standard deviation of the group mean; SES: Socio-economic status; SRS: Social Responsiveness Scale Total T-score (all but three parents of TDC, 1 parent of ASD, and 1 parent of ADHD completed the SRS; SRS teacher scores were available for 33, 54, and 40, TDC, ASD and ADHD, respectively);
Only data for research reliable ADOS administrations (n=53) are reported; the remaining were based on clinical administrations only.
Self (parent) reported race was missing in 4 TDC, 6 children with ADHD and 4 children with ASD.
“Other” includes Asian, Pacific Islander, Hawaiian, American Indian, Alaskan Native, other races, or mixed races.
Not taking psychoactive medications for periods ranging from 1 week to >12 months prior to scanning.
Those currently treated with psychostimulants had medication discontinued for 24–48 hours prior to scanning.
Three were treated with selective serotonin reuptake inhibitors and one each with guanfacine, desmopressin, or melatonin.
Module 3 (n=56; research reliable n=53), review of the child’s history, and the Autism Diagnostic Interview-Revised (n=54; research reliable n=42) (40, 41). Consistent with previous reports (2, 4–7, 37), 34 (61%) children with ASD had psychiatric comorbidity based on parent administration of the Schedule of Affective Disorders and Schizophrenia for Children (n=50) (KSADS:PL; 42) or unstructured psychiatric interviews (n=5); comorbidity data were missing for one child. Of 34 comorbid children, 28 presented with ADHD (i.e., met DSM-IV-TR criteria except for criterion E) alone or with other Axis-I disorders (Table S1 in Supplement 1).
Among children with ADHD, 44 met criteria for Combined Type ADHD, and one met criteria for Predominantly Inattentive Type per KSADS-PL. Previous studies reported that 20–30% of children with ADHD exhibit elevated autistic traits (43, 44). To minimize potential confounds, we only included children with ADHD with a parent-based Social Responsiveness Scale (SRS; 45) inconsistent with autistic traits (i.e., Total T-score <65). Seventeen children (38%) with ADHD were diagnosed with comorbid disorders (Table S1 in Supplement 1).
Twenty-nine (52%) children with ASD, 28 (62%) children with ADHD, and all TDC were psychotropic medication-naïve. Details on treatment histories are in Table 1. Current treatment with neuroleptics was exclusionary.
Inclusion as TDC required absence of any DSM-IV-TR Axis-I diagnosis. The KSADS-PL was used for all but one TDC child/parent dyad. Absence of known neurological or genetic syndromes was required for all participants. Intelligence was estimated with the Wechsler Abbreviated Scale of Intelligence (46). Total and Verbal IQ, but not Performance IQ, were significantly lower in children with ASD relative to TDC. Per the Edinburgh Handedness Inventory (and for one TDC, self-report), 49 TDC, 50 children with ASD, and 44 children with ADHD were right-handed (χ (2)2=5.2, p=0.07). Conners’ Parent/Teacher Rating Scales (47), and parent and teacher SRS were administered. Per parent-reported ethnicity/race (collected from all but three TDC and one child with ADHD), Hispanic/Latino represented 14%, 21% and 27% for TDC, ADHD and ASD, respectively. Groups did not differ significantly in ethnicity/race, age, sex, socioeconomic status, or handedness (Table 1; assessment tools in appendix). All parents and children provided written informed consent/assent, as approved by the NYU and the NYU School of Medicine Institutional Review Boards. Data from up to 30 TDC (23, 48, 49), 17 children with ASD (23), and 18 children with ADHD (50) were included in previous reports.
MRI Data Acquisition
We employed the NYU Center for Brain Imaging Siemens Allegra 3.0 Tesla scanner (Siemens, Iselin, NJ). Most children (n=127) completed a 6-min resting scan comprising 180 contiguous whole-brain functional volumes, acquired using a multi-echo echo-planar imaging (EPI) sequence (repetition time [TR]=2000ms; echo time [TE]=30ms; flip angle=90°; 33 slices; matrix=64×64; voxel size=3×3×4mm). Twenty-four children completed a 6min 34s rest scan comprising 197 contiguous volumes, using a single-shot EPI sequence (TR=2000ms; TE=25ms; flip angle=90º, 39 slices, matrix=64×64; 3mm isotropic). Previous studies have demonstrated it is feasible to combine MRI data across sequences (30, 48, 51–56). To minimize data loss, we obtained two EPI sequences whenever possible. We used the first EPI rest scan for 138 children and the second scan for 13 who moved excessively during the first. Rest scans were collected with eyes open for 132 children, while 19 kept their eyes closed. Groups did not differ significantly on sequence type, or scan order, while they marginally differed in eye status (Table 2). We adjusted for these variables and sequence-related variability, at group-level analyses. A high-resolution T1-weighted anatomical image was also acquired.
Table 2.
Scan Characteristics for the Groups
| TDC N=50 |
ASD N=56 |
ADHD N=45 |
Group Comparisons | ||||||
|---|---|---|---|---|---|---|---|---|---|
| M | SD | M | SD | M | SD | F | df | p | |
| RMS Mean Displacement (mm) | .027 | .020 | .031 | .015 | .031 | .015 | 1.27 | 2, 148 | 0.29 |
| Mean FD (mm) | .11 | .054 | .14 | .056 | .14 | .059 | 5.99 | 2,148 | 0.003* |
| N | (%) | N | (%) | N | (%) | χ2 | df | p | |
| Sequence Type (# - Seq1)*** | 40 | (80) | 45 | (80) | 42 | (93) | 4.08 | 2 | 0.13 |
| Scan Order (# - Rest1)٭ | 48 | (96) | 50 | (89) | 40 | (88) | 2.02 | 2 | 0.36 |
| Eyes Status (# -Open) | 45 | (90) | 52 | (92) | 35 | (77) | 5.6 | 2 | 0.06 |
df: degrees of freedom; Mean FD: framewise displacement computed in accordance with Power et al. (62). RMS Mean Displacement: frame-to-frame root mean square motion in the x, y and z directions measured in accordance with Van Dijk et al. (61).
Pairwise comparisons showed that both clinical groups (ADHD, ASD) exhibited significantly higher mean FD relative to TDC.
Seq1: Resting state fMRI data were collected in 127 children with Sequence 1 (Seq1) and in 24 children with Sequence 2.
A high-resolution T1-weighted anatomical image was also acquired for all children. For the 127 children completing Sequence 1, anatomical T1 images were collected with the parameters: TR=2530ms; TE=3.25ms; inversion time [TI]=1100ms; flip angle=7°; 128 slices; FOV=256mm; acquisition voxel size=1.3×1×1.3mm. For the 24 children completing Sequence 2, the T1 images were collected with the parameters: TR=2500ms; TE=4.35ms; TI=900ms; flip angle=8º; 176 slices, FOV=256mm, voxel size=1×1×1mm.
Rest1: Two rest sequences were attempted whenever possible. The first rest sequence was used unless unavailable. ADHD= Attention-Deficit/Hyperactivity Disorder; ASD= Autism Spectrum Disorders; M=group mean; SD=standard deviation of the group mean; TDC=Typically Developing Children.
Preprocessing
Consistent with prior work (23, 50), data were processed using AFNI (http://afni.nimh.nih.gov/afni/) and the FMRIB Software Library (FSL; www.fmrib.ox.ac.uk). Preprocessing comprised slice time correction for interleaved slice acquisition, 3D motion correction, despiking, mean-based intensity normalization of all volumes by the same factor, temporal band-pass filtering (0.009 – 0.1Hz), linear and quadratic detrending. Nuisance signals from white matter and cerebrospinal fluid, the six motion parameters, and the global signal (GS) were removed to control for physiological processes (e.g., cardiac and respiratory (57, 58)), and large-scale neural signals (59). Linear registration of high resolution structural images to the MNI152 template with 2mm resolution was carried out using FLIRT and refined using FNIRT nonlinear registration (60). For data collected with multi-echo EPI, functional-to-anatomical co-registration was improved by intermediate registration to a low-resolution image and b0 unwarping (using the FSL program fugue). Linear registration of each participant’s functional data to their high-resolution structural image was also carried out using FLIRT. We computed the mean frame-to-frame root mean square motion in x, y and z directions for each subject per (61). Groups did not differ significantly on these motion parameters. Given recent concerns regarding the confounding influence of micromovements in intrinsic functional connectivity (iFC) analyses (61–64), we computed mean framewise displacement (FD) per (62) and excluded any child with mean FD>2SD from the mean (0.3mm) of the initial group of 158 children (Figure S1 in Supplement 1). This excluded 7 children (one TDC, and three each from ADHD and ASD groups); data from 151 children remained. Although below 0.3mm for all children, mean FD was significantly higher in both clinical groups relative to TDC (Table 2, Figure S1 in Supplement 1). We accounted for motion by including mean FD as a group-level covariate.
Individual Network Centrality
As previously described (30), we first generated a study-specific functional volume mask that included only voxels (in MNI152 standard space) present in all 151 participants, further constrained by a 40% gray-matter probability mask (Figure S2 in Supplement 1). Prior to graph generation, we down-sampled EPI time-series to 13486 4mm isotropic voxels to decrease computational complexity.
Voxel-based graphs were generated for each participant. Each voxel constitutes a node in the graph, and each significant functional connection (i.e., Pearson correlation) between any pair of voxels is an edge. A voxel-based graph is thus a mathematical representation of the functional network consisting of nodes or voxels and their edges or connections (30, 31). To obtain each participant’s graph, the correlation between the time-series of each voxel with every other voxel in the study mask was computed, resulting in a 13486×13486 correlation matrix. A binary, undirected adjacency matrix was then obtained by thresholding each correlation at p<0.001 (r=0.2). Based on the graph, DC and EC were calculated at the individual-level (30). We computed DC by counting the number of functional connections (significant positive correlations) between each voxel and all other voxels (30, 31). To compute EC we identified the first eigenvector (i.e., with the largest eigenvalue) of the adjacency matrix. Since EC is a recursive measure, the EC of voxel i is proportional to the sum of the EC of all direct neighbors of voxel i (30, 36). Centrality indices were then transformed to z-scores based on the mean and SD across all voxels in the brain per individual (30, 31).
To confirm that our findings were not dependent upon the threshold selected for graph construction, we repeated our calculation of centrality using a range of p-value thresholds (0.01, 0.0001, and 0.00001). Group differences were not substantially affected by the use of different p-value thresholds for graph construction (Figure S3 in Supplement 1).
Group Network Centrality
At the voxel-level, individual centrality z-score maps were first spatially smoothed (Gaussian smoothing kernel FWHM=6mm) and used as inputs for group-level analyses. To test diagnostic group effects for DC and EC separately, we performed a one-way ANCOVA implemented in FLAME treating group as a 3-level factor (TDC, ASD, ADHD); F-contrasts measured group effects. Age, sex, eye status, sequence type, scan order, mean FD, and full scale IQ were covariates. Multiple comparisons correction was performed using Gaussian random field theory (min Z>2.3; cluster significance: p<0.05, corrected). To determine pairwise differences between groups, significant clusters were interrogated via Tukey’s post-hoc tests (p<0.05). Finally, for each cluster identified in primary analyses, we compared centrality of the 28 children with ASD and ADHD-like comorbidity (ASD+) to those 27 children without (ASD−). To verify that potential differences in sparsity (i.e., #significant edges / total possible number of edges) did not confound centrality, we computed sparsity for each individual, compared group means, and repeated group post-hoc analyses covarying for sparsity.
Potential Confounds
In light of recent debates (61–69), secondary analyses examined whether micromovements (e.g., 62) or global signal regression (GSR) (65, 66, 70) confounded primary analyses. While we accounted for group differences in micromovements by including mean FD as a covariate at the group level, some have argued for individual level corrections involving volume censoring at FD>0.2mm (‘scrubbing’ (e.g., 62)). Thus, we computed centrality on individual data ‘scrubbed’ at 0.2mm, and interrogated the clusters identified in primary analyses to determine the pattern of pair-wise differences among the four groups (TDC, ADHD, ASD+, ASD−).
Similarly, cluster-level group comparisons were conducted using centrality indices computed on data preprocessed without GSR. Since omitting GSR markedly increases the number of significant positive correlations, we used a more stringent threshold (p=0.00001) to equate sparsity of the adjacency matrix with that obtained using GSR (Figure S4 in Supplement 1). Finally, to gain greater insight into the regional role of GSR, we examined group differences in the voxel-wise correlation pattern with the GS time-series used as a seed (23, 50, 71–74).
Results
Consistent with the literature (30–32, 36, 75), across all children, centrality z-scores were highest in heteromodal cortical regions including insula, medial prefrontal cortex, medial occipital cortex, and precuneus for both DC and EC (Figure S2 in Supplement 1).
ANCOVA identified six distinct clusters in which a significant effect of group was noted for DC; no significant effects of group were observed for EC. While EC and DC differed in their sensitivity to group differences at the voxel-level, cluster-based interrogation suggested that ADHD- and ASD-related abnormalities disrupted both centrality indices comparably (Figure S5 in Supplement 1). The six clusters revealed by ANCOVA included subcortical and cortical regions. Pair-wise group comparisons carried out on these clusters revealed both shared (TDC3[ADHD=ASD]) and distinct abnormalities (ADHD3[ASD=TDC]) and (ASD3[ADHD=TDC]) (Figure 1; Tables S2 and S3 in Supplement 1). Specifically, groups differed significantly in the head of the right caudate, pallidum and putamen (Figure 1, Cluster A) as well as in left postcentral cortex (Cluster B). For both clusters, secondary pairwise comparisons revealed significantly increased DC in the ADHD group (ADHD>[ASD=TDC]) suggesting these are ADHD-specific abnormalities. By contrast, the ASD group exhibited significantly increased DC in limbic areas, bilaterally (Clusters C and D), though more extensively in the left hemisphere. These clusters included the superficial and laterobasal amygdala (76; respectively on the right and left hemisphere), the adjacent parahippocampus, planum temporale and temporal cortex (ASD>[TDC=ADHD]). Additionally, relative to TDC, decreased DC for both ADHD and ASD was observed in the precuneus (Cluster E; TDC>ASD>ADHD). Finally, significantly increased DC in subgenual anterior cingulate cortex (Cluster F; Figure S6 in Supplement 1) was evident in children with ASD relative to ADHD, although neither clinical group differed significantly from TDC.
Figure 1. Effects of Diagnostic Group on Degree Centrality.
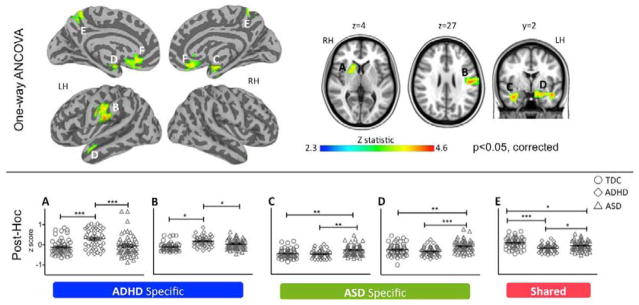
The top panel depicts the statistical brain maps of the F-contrast results from the one-way ANCOVA revealing voxels in which degree centrality (DC) z scores differ as a function of group (Typically Developing Children [TDC] vs. Attention-Deficit/Hyperactivity Disorder [ADHD] vs. Autism Spectrum Disorders [ASD]). Gaussian random field theory was employed to carry out cluster-level correction for multiple comparisons (min Z > 2.3; cluster significance: p < 0.05, corrected). Significant clusters are presented on inflated surface maps (left side) and axial and coronal maps (right side) generated using Analysis of Functional NeuroImages (AFNI) and Surface Mapping with AFNI (SUMA) software (http://afni.nimh.nih.gov/afni/suma). Lateral and medial views are shown for left and right hemispheres (LH, RH, respectively). For illustration purposes, results were resampled from 4mm3 to 1mm3 using sinc interpolation (FLIRT). The scatter plots in the bottom panel illustrate individual participant z scores, for the five clusters (indexed with capital letters from A to E) in which ASD, ADHD, or both differed from TDC, based on pair-wise post-hoc group comparisons (Tukey corrected at p< 0.05). Solid black lines depict means and standard errors. Horizontal capped lines designate pairwise comparisons reaching statistical thresholds: ***, p<0.0001; **, p<0.001; and *, p<0.05. ADHD specific clusters A and B designate regions in which ADHD differ from both TDC and ASD; ASD specific clusters C and D designate regions in which ASD differ from both TDC and ADHD; Cluster E designates a region in which both clinical groups exhibited decreased DC relative to TDC. Figure S5 in Supplement 1 shows cluster F, in which ASD and ADHD differed from each other, although neither differed from TDC. See Table S2 in Supplement 1 for anatomical labels, group statistics and peaks detected within clusters.
As groups differed in sparsity (i.e., ADHD>[TDC=ASD]; Figure S7 in Supplement 1), we repeated pair-wise group comparisons covarying for sparsity, yielding substantially unchanged results (data not shown).
Centrality and ADHD-Like Comorbidity in ASD
Consistent with the literature (2, 4–7, 37), 50% of the children with ASD presented with clinically significant ADHD symptoms (ASD+). As Figure 2 shows, ASD+ and ASD− shared a similar pattern of centrality regardless of ADHD-like comorbidity in all interrogated regions except the caudate and lentiform nucleus clusters (Tables S2 and S4 in Supplement 1). As increases in DC were observed in ADHD and ASD+, follow-up correlations between CPRS ADHD Index and DC scores across ADHD and ASD showed a positive relationship. This was significant across both groups (R2(98) =0.06; p<0.018; Figure S8 in Supplement 1). Since the study was not designed for dimensional examinations, we interpret this result with caution.
Figure 2. Contributions of ADHD-Like Comorbidity to ASD-Related Differences in Degree Centrality.
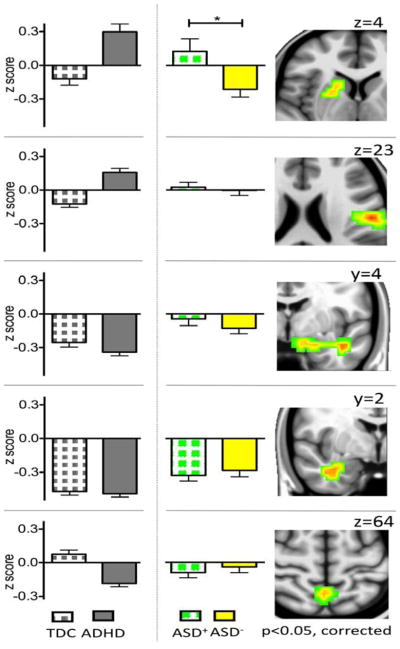
Histograms illustrate degree centrality (group mean z scores and standard errors of the mean) in children with Autism Spectrum Disorders (ASD) with and without Attention-Deficit/Hyperactivity Disorder (ADHD) comorbidity (ASD+ and ASD−, green squares and yellow fill, respectively). For illustration, we also present the histograms for children with ADHD and Typically Developing Children (TDC). With respect to degree centrality, ASD+ and ASD− differ significantly only in a cluster encompassing the right striatum and pallidum (See Table S3 in Supplement 1 for group statistics). The right panels show the coronal and axial brain images depicting the statistical maps of the five clusters identified in primary analyses. From the top, these are the right striatum/pallidum (z=4), the left postcentral cortex (z=23), the left (y=4) and right (y=2) temporolimbic areas, and the precuneus (z=64) (min Z > 2.3; cluster significance: p < 0.05, corrected). Brain maps were generated using Analysis of Functional NeuroImages (AFNI) (http://afni.nimh.nih.gov/afni). For illustration purposes, results were resampled from 4mm3 to 1mm3 using sinc interpolation (FLIRT). *p=.017.
Potential Confounds
To determine the extent to which our findings were robust to motion correction strategy, we computed centrality on data ‘scrubbed’ at 0.2mm and verified the pattern of group-related differences in DC in the clusters identified in primary analyses. Results remained largely unchanged (Figure S9; Table S1 for details on scrubbing; see Supplement 1).
To address the concern that GSR may introduce artifactual between-group differences (65, 66, 70), we repeated DC analyses using data preprocessed without GSR and reexamined DC patterns at the cluster level. This yielded highly similar results for all clusters except the left postcentral gyrus (Figure S4 in Supplement 1). To explore potential group-related differences in the distribution of the signal removed by GSR, we carried out seed-based correlation analyses using the GS as the seed time-series. We found a significant effect of group (ADHD>[TDC=ASD]; Figure S10 in Supplement 1) in the pattern of correlation between the GS and several cortical regions involving frontal and parietal cortex, including the postcentral gyrus bilaterally.
Discussion
In a substantial sample of children with ASD, ADHD, and TDC, we examined whole-brain intrinsic functional architecture by surveying voxel-wise network centrality indices, thus bypassing a priori selection of circuits-of-interest. Degree centrality differentiated children with ADHD or with ASD from TDC in key cortical and subcortical regions, supporting models of ADHD and ASD as disorders of large-scale systems connectivity (12, 15, 77). Along with disorder-specific abnormalities, analyses revealed aberrancies common to both types of psychopathology.
The present work further advances our understanding of similarities and differences in the neural mechanisms underlying ADHD and ASD by directly comparing these disorders and by fractionating ASD in terms of presence or absence of ADHD comorbidity. We found abnormalities ascribable to ADHD within the right caudate, pallidum and putamen, as well as in the left postcentral cortex, and abnormalities referable to ASD in temporolimbic areas. These findings are consistent with previous iFC studies examining each disorder relative to TDC (e.g., 21, 78). In contrast, based on primary diagnosis, shared network abnormalities between the two disorders were limited to precuneus. When comparing children with ASD with and without ADHD-like comorbidity, we observed a shared neural signature between the ASD+ and the ADHD group (i.e., increased DC in right striatum and pallidum), which was absent in ASD−.
The commonality of precuneus abnormalities in ADHD and ASD is not surprising given previous evidence highlighting functional dysconnections in these regions for both ADHD and ASD (e.g., 16, 17, 19, 21, 79, 80), as well as a recent task-based fMRI study directly comparing these disorders (10). In our work, the precuneal DC abnormality was localized to the sensorimotor division (81, 82), with ADHD-related abnormalities being more robust than that of ASD. Similarly, Christakou et al. (10) found failure to suppress precuneus activity during a sustained attention task in both ADHD and ASD, though more prominently in ADHD. Differences in sensorimotor precuneus may underlie impairments in fine motor skills associated with both disorders (83–86), as well as abnormal integration of sensory information (87–89). Given the increasing frequency of precuneal abnormalities in ASD and ADHD, as well as other psychiatric disorders, future work would benefit from more fine-grained functional profiling of precuneus dysfunction in the various disorders involving both task-based imaging and phenotypic/neuropsychological dissections of precuneus function.
Our findings of ASD-specific abnormalities within the amygdala and associated temporolimbic regions are consistent with the ASD literature (e.g., 26, 90–92). A meta-analysis of fMRI studies in ASD (26) found consistent amygdala hypofunction during social processing, though amygdala hyperactivity has also been found (e.g., 90). Recently, studies reported ASD-related decreases in amygdala functional connectivity (93), particularly with regions implicated in social cognition (91, 93), face perception or affective regulation (e.g., fusiform gyrus (94, 95), anterior insula (96)). Our findings of increased amygdala DC (i.e., increased iFC with the broader connectome), regardless of presence or absence of ADHD symptoms, further support the relevance of amygdala dysfunction to the impairments in social and emotional processing characteristic of ASD. Yet, identifying the specific roles of the amygdala in ASD remains a challenge for future studies as amygdala-based circuitry is implicated in a wide array of cognitive and affective processes (97–99). Similar to the precuneus, the amygdala is functionally and structurally heterogeneous and human imaging studies rarely address its key subdivisions (76, 100, 101). Systematic dissections of amygdala dysfunction in ASD using task-based imaging and phenotypic/neuropsychological characterizations will be crucial next steps; resting state fMRI examinations at higher spatial resolutions may prove beneficial as well.
The involvement of basal ganglia circuitry in children with ADHD symptoms, independent of diagnostic group, is consistent with the broader body of research that conclusively implicates the basal ganglia in ADHD (102). ADHD has also been linked to delayed brain maturation (103, 104). Developmental R-fMRI studies find that subcortico-cortical iFC decreases with age, as cortico-cortical iFC increases (105). In this light, our findings of increased DC of basal ganglia may reflect brain developmental immaturity in children with ADHD symptoms irrespective of primary diagnosis. Of note, a prior examination that included a subset of the participants with ASD and TDC (32% and 36%, respectively) from the present study, revealed increased striatal iFC in ASD (23). In those analyses, ectopic ASD-related patterns of iFC were inconsistent with developmental immaturity, suggesting a deviant development of striatal circuits in ASD. In light of our centrality results, future work will examine whether the distinction between ASD+ and ASD− is also relevant to aberrant striatal iFC in specific circuits, as opposed to relationships with the whole connectome indexed by centrality measures.
Finally, though DC and EC group patterns converged at the cluster level, we did not find significant voxel-wise effects of group in EC. Centrality measures are not interchangeable and differ in sensitivity (30). Of note, although EC effects failed to survive voxel-wise multiple comparison correction, interrogation of clusters identified with DC revealed similar group-effects in EC. These findings suggest that similar diagnosis-related (ASD, ADHD) patterns exist in local and global centrality properties, although the former may be more consistent. Of note, while hubs are increasingly highlighted as primary targets for psychopathology (34, 106), our findings expand this focus, as they were limited to regions characterized by either relatively moderate centrality (e.g., dorsal precuneus) or relative isolation (e.g., amygdala) in the intrinsic brain. An intriguing speculation is that these regions may serve as sources of interference for information flow within the connectome.
With regard to study limitations, to optimize sample size and group matching, we combined data obtained using two different acquisition protocols. Diagnostic groups did not differ significantly with respect to proportion of scans from the two sequences, and scan protocol was included as a nuisance covariate in analyses. Additionally, prior work suggests that inter-individual differences in the brain’s iFC are robust to variations in data acquisition parameters (51, 61, 63, 64). Although our groups were equated with respect to gross motion, the clinical groups exhibited greater micromovements than TDC. Primary analyses account for such differences using a group-level covariate for micromovements, and findings were confirmed when ‘scrubbing’ was employed. Thus, diagnosis-related differences are not likely driven by micromovements. We employed global signal regression (GSR) to account for artifactual signals (e.g., physiologic, scanner-related, residual motion), as well as large-scale gray matter signals. Despite apparent increases in sensitivity with GSR, the approach can introduce artifactual group differences (65, 107, 108). The field is currently debating the best approach to account for nuisance signals (68–70, 109). Here, we found that although GSR increased sensitivity, all group-related differences except those in the postcentral gyrus were detectable without GSR, suggesting that most of our results could not be ascribed to GSR-related artifact.
In conclusion, we found evidence for distinct and shared areas of connectome-wide dysconnectivity in ASD and ADHD. While disorder specific abnormalities emphasize the unique neural origins of the two conditions, the presence of overlapping results is consistent with the growing clinical, molecular and neuroimaging evidence of commonalities (110). The finding that ADHD-like comorbidity in ASD was associated with a neural abnormality shared with ADHD supports the anticipated change in DSM-5 to allow the frequent comorbidity of these disorders to be explicitly recognized. Such alignment among clinical, nosological, and neurobiological perspectives is expected to provide a firmer basis for dissecting the heterogeneity of ASD.
Supplementary Material
Acknowledgments
We are immensely grateful to the children and parents who generously contributed to this research. We also wish to thank the research staff of the Phyllis Green and Randolph Cowen Institute for Pediatric Neuroscience for help in participant recruitment, assessment, data collection and data entry, as well as the members of the Cross-Collaborative Writing Club for helpful discussions and suggestions, and Kritika Nayar and Erin Denio for careful proof reading. Of note, part of the data included in this manuscript were deposited, as fully anonymized data, in the Autism Brain Imaging Data Exchange repository (ABIDE; http://fcon_1000.projects.nitrc.org/indi/abide/data) and/or the National Database for Autism Research (NDAR; http://ndar.nih.gov/).
This work was supported by grants from the Brain & Behavior Research Foundation (previously known as NARSAD) to ADM and National Institute of Mental Health (K23MH087770 to ADM; R01MH081218 to FXC); from the National Institute of Child Health and Human Development (R01HD065282), Autism Speaks, the Stavros Niarchos Foundation, awarded to FXC; the Leon Levy Foundation awarded to MPM, ADM, and CK; as well as the Natural Science Foundation of China (81171409, 81220108014) and the Chinese Academy of Sciences (KSZD-EW-TZ-002, Y0CX492S03, Y2CX112006) to XNZ and gifts from Joseph P. Heley and the Stavros Niarchos Foundation to the Child Mind Institute (MPM).
Footnotes
Financial Disclosure: Dr. Di Martino receives royalties from the publication of the Italian version of the Social Responsiveness Scale—Child Version. Dr. Lord receives royalties from the publication of the Autism Diagnostic Interview–Revised and the Autism Diagnostic Observation Schedule. Dr. Lord’s royalties received from this research have been donated to a charity. All other authors report no biomedical financial interests or potential conflict of interest.
Publisher's Disclaimer: This is a PDF file of an unedited manuscript that has been accepted for publication. As a service to our customers we are providing this early version of the manuscript. The manuscript will undergo copyediting, typesetting, and review of the resulting proof before it is published in its final citable form. Please note that during the production process errors may be discovered which could affect the content, and all legal disclaimers that apply to the journal pertain.
Bibliography
- 1.Taurines R, Schwenck C, Westerwald E, Sachse M, Siniatchkin M, Freitag C. ADHD and autism: differential diagnosis or overlapping traits? A selective review. Atten Defic Hyperact Disord. 2012;4:115–139. doi: 10.1007/s12402-012-0086-2. [DOI] [PubMed] [Google Scholar]
- 2.Simonoff E, Pickles A, Charman T, Chandler S, Loucas T, Baird G. Psychiatric disorders in children with autism spectrum disorders: prevalence, comorbidity, and associated factors in a population-derived sample. Journal of the American Academy of Child and Adolescent Psychiatry. 2008;47:921–929. doi: 10.1097/CHI.0b013e318179964f. [DOI] [PubMed] [Google Scholar]
- 3.Research Units on Pediatric Psychopharmacology Autism Network . A Randomized Controlled Crossover Trial of Methylphenidate in Pervasive Developmental Disorders with Hyperactivity. Archives of General Psychiatry. 2005;62:1266–1274. doi: 10.1001/archpsyc.62.11.1266. [DOI] [PubMed] [Google Scholar]
- 4.Icasiano F, Hewson P, Machet P, Cooper C, Marshall A. Childhood autism spectrum disorder in the Barwon region: A community based study. Journal of Paediatrics and Child Health. 2004;40:696–701. doi: 10.1111/j.1440-1754.2004.00513.x. [DOI] [PubMed] [Google Scholar]
- 5.de Bruin EI, de Nijs PF, Verheij F, Hartman CA, Ferdinand RF. Multiple complex developmental disorder delineated from PDD-NOS. Journal of Autism and Developmental Disorders. 2007;37:1181–1191. doi: 10.1007/s10803-006-0261-4. [DOI] [PubMed] [Google Scholar]
- 6.Gadow KD, DeVincent CJ, Pomeroy J. ADHD symptom subtypes in children with pervasive developmental disorder. J Autism Dev Disord. 2006;36:271–283. doi: 10.1007/s10803-005-0060-3. [DOI] [PubMed] [Google Scholar]
- 7.Goldstein S, Schwebach AJ. The comorbidity of Pervasive Developmental Disorder and Attention Deficit Hyperactivity Disorder: results of a retrospective chart review. Journal of Autism and Developmental Disorders. 2004;34:329–339. doi: 10.1023/b:jadd.0000029554.46570.68. [DOI] [PubMed] [Google Scholar]
- 8.Ronald A, Happe F, Plomin R. A twin study investigating the genetic and environmental aetiologies of parent, teacher and child ratings of autistic-like traits and their overlap. Eur Child Adolesc Psychiatry. 2008;17:473–483. doi: 10.1007/s00787-008-0689-5. [DOI] [PubMed] [Google Scholar]
- 9.Taurines R, Schwenck C, Westerwald E, Sachse M, Siniatchkin M, Freitag C. ADHD and autism: differential diagnosis or overlapping traits? A selective review. Atten Defic Hyperact Disord. 2012 doi: 10.1007/s12402-012-0086-2. [DOI] [PubMed] [Google Scholar]
- 10.Christakou A, Murphy CM, Chantiluke K, Cubillo AI, Smith AB, Giampietro V, et al. Disorder-specific functional abnormalities during sustained attention in youth with Attention Deficit Hyperactivity Disorder (ADHD) and with Autism. Mol Psychiatry. 2012 doi: 10.1038/mp.2011.185. [DOI] [PMC free article] [PubMed] [Google Scholar]
- 11.Brieber S, Neufang S, Bruning N, Kamp-Becker I, Remschmidt H, Herpertz-Dahlmann B, et al. Structural brain abnormalities in adolescents with autism spectrum disorder and patients with attention deficit/hyperactivity disorder. Journal of Child Psychology and Psychiatry. 2007;48:1251–1258. doi: 10.1111/j.1469-7610.2007.01799.x. [DOI] [PubMed] [Google Scholar]
- 12.Minshew NJ, Williams DL. The new neurobiology of autism: cortex, connectivity, and neuronal organization. Archives of Neurology. 2007;64:945–950. doi: 10.1001/archneur.64.7.945. [DOI] [PMC free article] [PubMed] [Google Scholar]
- 13.Konrad K, Eickhoff SB. Is the ADHD brain wired differently? A review on structural and functional connectivity in attention deficit hyperactivity disorder. Hum Brain Mapp. 2010;31:904–916. doi: 10.1002/hbm.21058. [DOI] [PMC free article] [PubMed] [Google Scholar]
- 14.Muller RA, Shih P, Keehn B, Deyoe JR, Leyden KM, Shukla DK. Underconnected, but how? A survey of functional connectivity MRI studies in autism spectrum disorders. Cereb Cortex. 2011;21:2233–2243. doi: 10.1093/cercor/bhq296. [DOI] [PMC free article] [PubMed] [Google Scholar]
- 15.Castellanos FX, Proal E. Large-scale brain systems in ADHD: beyond the prefrontal-striatal model. Trends Cogn Sci. 2012;16:17–26. doi: 10.1016/j.tics.2011.11.007. [DOI] [PMC free article] [PubMed] [Google Scholar]
- 16.Kennedy DP, Courchesne E. The intrinsic functional organization of the brain is altered in autism. Neuroimage. 2008;39:1877–1885. doi: 10.1016/j.neuroimage.2007.10.052. [DOI] [PubMed] [Google Scholar]
- 17.Castellanos FX, Margulies DS, Kelly C, Uddin LQ, Ghaffari M, Kirsch A, et al. Cingulate-precuneus interactions: a new locus of dysfunction in adult attention-deficit/hyperactivity disorder. Biol Psychiatry. 2008;63:332–337. doi: 10.1016/j.biopsych.2007.06.025. [DOI] [PMC free article] [PubMed] [Google Scholar]
- 18.Sonuga-Barke EJ, Castellanos FX. Spontaneous attentional fluctuations in impaired states and pathological conditions: a neurobiological hypothesis. Neurosci Biobehav Rev. 2007;31:977–986. doi: 10.1016/j.neubiorev.2007.02.005. [DOI] [PubMed] [Google Scholar]
- 19.Assaf M, Jagannathan K, Calhoun VD, Miller L, Stevens MC, Sahl R, et al. Abnormal functional connectivity of default mode sub-networks in autism spectrum disorder patients. Neuroimage. 2010;53:247–256. doi: 10.1016/j.neuroimage.2010.05.067. [DOI] [PMC free article] [PubMed] [Google Scholar]
- 20.Peterson BS, Potenza MN, Wang Z, Zhu H, Martin A, Marsh R, et al. An FMRI study of the effects of psychostimulants on default-mode processing during Stroop task performance in youths with ADHD. Am J Psychiatry. 2009;166:1286–1294. doi: 10.1176/appi.ajp.2009.08050724. [DOI] [PMC free article] [PubMed] [Google Scholar]
- 21.Tomasi D, Volkow ND. Abnormal functional connectivity in children with attention-deficit/hyperactivity disorder. Biol Psychiatry. 2012;71:443–450. doi: 10.1016/j.biopsych.2011.11.003. [DOI] [PMC free article] [PubMed] [Google Scholar]
- 22.Liston C, Cohen MM, Teslovich T, Levenson D, Casey BJ. Atypical prefrontal connectivity in attention-deficit/hyperactivity disorder: pathway to disease or pathological end point? Biol Psychiatry. 2011;69:1168–1177. doi: 10.1016/j.biopsych.2011.03.022. [DOI] [PubMed] [Google Scholar]
- 23.Di Martino A, Kelly C, Grzadzinski R, Zuo XN, Mennes M, Mairena MA, et al. Aberrant striatal functional connectivity in children with autism. Biol Psychiatry. 2011;69:847–856. doi: 10.1016/j.biopsych.2010.10.029. [DOI] [PMC free article] [PubMed] [Google Scholar]
- 24.Cao X, Cao Q, Long X, Sun L, Sui M, Zhu C, et al. Abnormal resting-state functional connectivity patterns of the putamen in medication-naive children with attention deficit hyperactivity disorder. Brain Res. 2009;1303:195–206. doi: 10.1016/j.brainres.2009.08.029. [DOI] [PubMed] [Google Scholar]
- 25.Wang L, Zhu C, He Y, Zang Y, Cao Q, Zhang H, et al. Altered small-world brain functional networks in children with attention-deficit/hyperactivity disorder. Hum Brain Mapp. 2009;30:638–649. doi: 10.1002/hbm.20530. [DOI] [PMC free article] [PubMed] [Google Scholar]
- 26.Di Martino A, Ross K, Uddin LQ, Sklar AB, Castellanos FX, Milham MP. Functional brain correlates of social and nonsocial processes in autism spectrum disorders: an activation likelihood estimation meta-analysis. Biological Psychiatry. 2009;65:63–74. doi: 10.1016/j.biopsych.2008.09.022. [DOI] [PMC free article] [PubMed] [Google Scholar]
- 27.Dickstein SG, Bannon K, Castellanos FX, Milham MP. The neural correlates of attention deficit hyperactivity disorder: an ALE meta-analysis. Journal of Child Psychology and Psychiatry and Allied Disciplines. 2006;47:1051–1062. doi: 10.1111/j.1469-7610.2006.01671.x. [DOI] [PubMed] [Google Scholar]
- 28.Cortese S, Kelly C, Chabernaud C, Proal E, Di Martino A, Milham MP, et al. Towards systems neuroscience of ADHD: A 582 meta-analysis of 55 fMRI studies. Am J Psychiatry. 2012 doi: 10.1176/appi.ajp.2012.11101521. [DOI] [PMC free article] [PubMed] [Google Scholar]
- 29.Malisza KL, Clancy C, Shiloff D, Holden J, Jones C, Paulson K, et al. Functional magnetic resonance imaging of facial information processing in children with autistic disorder, attention deficit hyperactivity disorder and typically developing controls. Int J Adolesc Med Health. 2011;23:269–277. doi: 10.1515/ijamh.2011.055. [DOI] [PubMed] [Google Scholar]
- 30.Zuo XN, Ehmke R, Mennes M, Imperati D, Castellanos FX, Sporns O, et al. Network centrality in the human functional connectome. Cereb Cortex. 2012;22:1862–1875. doi: 10.1093/cercor/bhr269. [DOI] [PubMed] [Google Scholar]
- 31.Buckner RL, Sepulcre J, Talukdar T, Krienen FM, Liu H, Hedden T, et al. Cortical hubs revealed by intrinsic functional connectivity: mapping, assessment of stability, and relation to Alzheimer’s disease. J Neurosci. 2009;29:1860–1873. doi: 10.1523/JNEUROSCI.5062-08.2009. [DOI] [PMC free article] [PubMed] [Google Scholar]
- 32.Sporns O. The human connectome: a complex network. Ann N Y Acad Sci. 2011;1224:109–125. doi: 10.1111/j.1749-6632.2010.05888.x. [DOI] [PubMed] [Google Scholar]
- 33.Tomasi D, Volkow ND. Functional connectivity hubs in the human brain. Neuroimage. 2011;57:908–917. doi: 10.1016/j.neuroimage.2011.05.024. [DOI] [PMC free article] [PubMed] [Google Scholar]
- 34.Bullmore ET, Bassett DS. Brain graphs: graphical models of the human brain connectome. Annu Rev Clin Psychol. 2011;7:113–140. doi: 10.1146/annurev-clinpsy-040510-143934. [DOI] [PubMed] [Google Scholar]
- 35.Fornito A, Zalesky A, Pantelis C, Bullmore ET. Schizophrenia, neuroimaging and connectomics. Neuroimage. 2012;62:2296–2314. doi: 10.1016/j.neuroimage.2011.12.090. [DOI] [PubMed] [Google Scholar]
- 36.Lohmann G, Margulies DS, Horstmann A, Pleger B, Lepsien J, Goldhahn D, et al. Eigenvector centrality mapping for analyzing connectivity patterns in FMRI data of the human brain. PLoS One. 2010;5:e10232. doi: 10.1371/journal.pone.0010232. [DOI] [PMC free article] [PubMed] [Google Scholar]
- 37.Ronald A, Happe F, Plomin R. A twin study investigating the genetic and environmental aetiologies of parent, teacher and child ratings of autistic-like traits and their overlap. EurChild AdolescPsychiatry. 2008;17:473–483. doi: 10.1007/s00787-008-0689-5. [DOI] [PubMed] [Google Scholar]
- 38.Gotham K, Pickles A, Lord C. Standardizing ADOS scores for a measure of severity in autism spectrum disorders. J Autism Dev Disord. 2009;39:693–705. doi: 10.1007/s10803-008-0674-3. [DOI] [PMC free article] [PubMed] [Google Scholar]
- 39.Gotham K, Risi S, Pickles A, Lord C. The Autism Diagnostic Observation Schedule: revised algorithms for improved diagnostic validity. Journal of Autism and Developmental Disorders. 2007;37:613–627. doi: 10.1007/s10803-006-0280-1. [DOI] [PubMed] [Google Scholar]
- 40.Lord C, Pickles A, McLennan J, Rutter M, Bregman J, Folstein S, et al. Diagnosing autism: analyses of data from the Autism Diagnostic Interview. J Autism Dev Disord. 1997;27:501–517. doi: 10.1023/a:1025873925661. [DOI] [PubMed] [Google Scholar]
- 41.Lord C, Rutter M, Le Couteur A. Autism Diagnostic Interview-Revised: a revised version of a diagnostic interview for caregivers of individuals with possible pervasive developmental disorders. J Autism Dev Disord. 1994;24:659–685. doi: 10.1007/BF02172145. [DOI] [PubMed] [Google Scholar]
- 42.Kaufman J, Birmaher B, Brent D, Rao U, Flynn C, Moreci P, et al. Schedule for Affective Disorders and Schizophrenia for School-Age Children-Present and Lifetime Version (K-SADS-PL): initial reliability and validity data. J Am Acad Child Adolesc Psychiatry. 1997;36:980–988. doi: 10.1097/00004583-199707000-00021. [DOI] [PubMed] [Google Scholar]
- 43.Grzadzinski R, Di Martino A, Brady E, Mairena MA, O’Neale M, Petkova E, et al. Examining Autistic Traits in Children with ADHD: Does the Autism Spectrum Extend to ADHD? J Autism Dev Disord. 2011;41:1178–1191. doi: 10.1007/s10803-010-1135-3. [DOI] [PMC free article] [PubMed] [Google Scholar]
- 44.Reiersen AM, Constantino JN, Volk HE, Todd RD. Autistic traits in a population-based ADHD twin sample. Journal of Child Psychology and Psychiatry and Allied Disciplines. 2007;48:464–472. doi: 10.1111/j.1469-7610.2006.01720.x. [DOI] [PubMed] [Google Scholar]
- 45.Constantino JN, Gruber CP. Social Responsiveness Scale (SRS): Manual. Los Angeles, CA: Western Psychological Services; 2005. [Google Scholar]
- 46.Wechsler D. Wechsler Abbreviated Scale of Intelligence (WASI) San Antonio, TX: The Psychological Corporation; 1999. [Google Scholar]
- 47.Conners CK, Sitarenios G, Parker JD, Epstein JN. The revised Conners’ Parent Rating Scale (CPRS-R): factor structure, reliability, and criterion validity. Journal of Abnormal Child Psychology. 1998;26:257–268. doi: 10.1023/a:1022602400621. [DOI] [PubMed] [Google Scholar]
- 48.Zuo XN, Kelly C, Di Martino A, Mennes M, Margulies DS, Bangaru S, et al. Growing together and growing apart: regional and sex differences in the lifespan developmental trajectories of functional homotopy. J Neurosci. 2010;30:15034–15043. doi: 10.1523/JNEUROSCI.2612-10.2010. [DOI] [PMC free article] [PubMed] [Google Scholar]
- 49.Kelly AMC, Di Martino A, Uddin LQ, Shehzad Z, Gee DG, Reiss PT, et al. Development of anterior cingulate functional connectivity from late childhood to early adulthood. Cerebral Cortex. 2009;19:640–657. doi: 10.1093/cercor/bhn117. [DOI] [PubMed] [Google Scholar]
- 50.Chabernaud C, Mennes M, Kelly C, Nooner K, Di Martino A, Castellanos FX, et al. Dimensional brain-behavior relationships in children with attention-deficit/hyperactivity disorder. Biol Psychiatry. 2012;71:434–442. doi: 10.1016/j.biopsych.2011.08.013. [DOI] [PMC free article] [PubMed] [Google Scholar]
- 51.Biswal BB, Mennes M, Zuo XN, Gohel S, Kelly C, Smith SM, et al. Toward discovery science of human brain function. Proc Natl Acad Sci U S A. 2010;107:4734–4739. doi: 10.1073/pnas.0911855107. [DOI] [PMC free article] [PubMed] [Google Scholar]
- 52.Tomasi D, Volkow ND. Functional connectivity density mapping. Proc Natl Acad Sci U S A. 2010;107:9885–9890. doi: 10.1073/pnas.1001414107. [DOI] [PMC free article] [PubMed] [Google Scholar]
- 53.Proal E, Reiss PT, Klein RG, Mannuzza S, Gotimer K, Ramos-Olazagasti MA, et al. Brain gray matter deficits at 33-year follow-up in adults with attention-deficit/hyperactivity disorder established in childhood. Arch Gen Psychiatry. 2011;68:1122–1134. doi: 10.1001/archgenpsychiatry.2011.117. [DOI] [PMC free article] [PubMed] [Google Scholar]
- 54.Dosenbach NU, Fair DA, Miezin FM, Cohen AL, Wenger KK, Dosenbach RA, et al. Distinct brain networks for adaptive and stable task control in humans. ProcNatlAcadSciUSA. 2007;104:11073–11078. doi: 10.1073/pnas.0704320104. [DOI] [PMC free article] [PubMed] [Google Scholar]
- 55.Cherkassky VL, Kana RK, Keller TA, Just MA. Functional connectivity in a baseline resting-state network in autism. Neuroreport. 2006;17:1687–1690. doi: 10.1097/01.wnr.0000239956.45448.4c. [DOI] [PubMed] [Google Scholar]
- 56.Kelly C, Toro R, Di Martino A, Cox CL, Bellec P, Castellanos FX, et al. A convergent functional architecture of the insula emerges across imaging modalities. Neuroimage. 2012 doi: 10.1016/j.neuroimage.2012.03.021. [DOI] [PMC free article] [PubMed] [Google Scholar]
- 57.Shmueli K, van Gelderen P, de Zwart JA, Horovitz SG, Fukunaga M, Jansma JM, et al. Low-frequency fluctuations in the cardiac rate as a source of variance in the resting-state fMRI BOLD signal. Neuroimage. 2007;38:306–320. doi: 10.1016/j.neuroimage.2007.07.037. [DOI] [PMC free article] [PubMed] [Google Scholar]
- 58.Bianciardi M, Fukunaga M, van Gelderen P, Horovitz SG, de Zwart JA, Shmueli K, et al. Sources of functional magnetic resonance imaging signal fluctuations in the human brain at rest: a 7 T study. Magn Reson Imaging. 2009;27:1019–1029. doi: 10.1016/j.mri.2009.02.004. [DOI] [PMC free article] [PubMed] [Google Scholar]
- 59.Scholvinck ML, Maier A, Ye FQ, Duyn JH, Leopold DA. Neural basis of global resting-state fMRI activity. Proc Natl Acad Sci U S A. 2010;107:10238–10243. doi: 10.1073/pnas.0913110107. [DOI] [PMC free article] [PubMed] [Google Scholar]
- 60.Andersson J, Jenkinson M, Smith SM. Non-linear registration, aka Spatial normalisation. FMRIB Analysis Group Technical Reports. 2007 Available at: www.fmrib.ox.ac.uk/analysis/techrep.
- 61.Van Dijk KR, Sabuncu MR, Buckner RL. The influence of head motion on intrinsic functional connectivity MRI. Neuroimage. 2012;59:431–438. doi: 10.1016/j.neuroimage.2011.07.044. [DOI] [PMC free article] [PubMed] [Google Scholar]
- 62.Power JD, Kelly AB, Snyder AZ, Schlaggar BL, Petersen SE. Steps toward optimizing motion artifact removal in functional connectivity MRI; a reply to Carp. Neuroimage. 2012 doi: 10.1016/j.neuroimage.2012.03.017. In Press. [DOI] [PMC free article] [PubMed] [Google Scholar]
- 63.Power JD, Barnes KA, Snyder AZ, Schlaggar BL, Petersen SE. Spurious but systematic correlations in functional connectivity MRI networks arise from subject motion. Neuroimage. 2012;59:2142–2154. doi: 10.1016/j.neuroimage.2011.10.018. [DOI] [PMC free article] [PubMed] [Google Scholar]
- 64.Satterthwaite TD, Wolf DH, Loughead J, Ruparel K, Elliott MA, Hakonarson H, et al. Impact of in-scanner head motion on multiple measures of functional connectivity: relevance for studies of neurodevelopment in youth. Neuroimage. 2012;60:623–632. doi: 10.1016/j.neuroimage.2011.12.063. [DOI] [PMC free article] [PubMed] [Google Scholar]
- 65.Murphy K, Birn RM, Handwerker DA, Jones TB, Bandettini PA. The impact of global signal regression on resting state correlations: are anti-correlated networks introduced? NeuroImage. 2009;44:893–905. doi: 10.1016/j.neuroimage.2008.09.036. [DOI] [PMC free article] [PubMed] [Google Scholar]
- 66.Saad ZS, Gotts SJ, Murphy K, Chen G, Jo HJ, Martin A, et al. Trouble at rest: how correlation patterns and group differences become distorted after global signal regression. Brain Connect. 2012;2:25–32. doi: 10.1089/brain.2012.0080. [DOI] [PMC free article] [PubMed] [Google Scholar]
- 67.Kelly C, Biswal BB, Craddock RC, Castellanos FX, Milham MP. Characterizing variation in the functional connectome: promise and pitfalls. Trends Cogn Sci. 2012;16:181–188. doi: 10.1016/j.tics.2012.02.001. [DOI] [PMC free article] [PubMed] [Google Scholar]
- 68.Fox MD, Zhang D, Snyder AZ, Raichle ME. The global signal and observed anticorrelated resting state brain networks. J Neurophysiol. 2009;101:3270–3283. doi: 10.1152/jn.90777.2008. [DOI] [PMC free article] [PubMed] [Google Scholar]
- 69.Satterthwaite TD, Elliott MA, Gerraty RT, Ruparel K, Loughead J, Calkins ME, et al. An improved framework for confound regression and filtering for control of motion artifact in the preprocessing of resting-state functional connectivity data. Neuroimage. 2013;64:240–256. doi: 10.1016/j.neuroimage.2012.08.052. [DOI] [PMC free article] [PubMed] [Google Scholar]
- 70.Carbonell F, Bellec P, Shmuel A. Global and system-specific resting-state FMRI fluctuations are uncorrelated: principal component analysis reveals anti-correlated networks. Brain Connect. 2011;1:496–510. doi: 10.1089/brain.2011.0065. [DOI] [PMC free article] [PubMed] [Google Scholar]
- 71.Koyama MS, Di Martino A, Zuo XN, Kelly C, Mennes M, Jutagir DR, et al. Resting-state functional connectivity indexes reading competence in children and adults. J Neurosci. 2011;31:8617–8624. doi: 10.1523/JNEUROSCI.4865-10.2011. [DOI] [PMC free article] [PubMed] [Google Scholar]
- 72.Cox CL, Uddin LQ, Di Martino A, Castellanos FX, Milham MP, Kelly C. The balance between feeling and knowing: affective and cognitive empathy are reflected in the brain’s intrinsic functional dynamics. Soc Cogn Affect Neurosci. 2011 doi: 10.1093/scan/nsr051. [DOI] [PMC free article] [PubMed] [Google Scholar]
- 73.Kelly AM, Di Martino A, Uddin LQ, Shehzad Z, Gee DG, Reiss PT, et al. Development of anterior cingulate functional connectivity from late childhood to early adulthood. Cereb Cortex. 2009;19:640–657. doi: 10.1093/cercor/bhn117. [DOI] [PubMed] [Google Scholar]
- 74.Di Martino A, Scheres A, Margulies DS, Kelly AM, Uddin LQ, Shehzad Z, et al. Functional connectivity of human striatum: a resting state FMRI study. Cereb Cortex. 2008;18:2735–2747. doi: 10.1093/cercor/bhn041. [DOI] [PubMed] [Google Scholar]
- 75.Achard S, Salvador R, Whitcher B, Suckling J, Bullmore E. A resilient, low-frequency, small-world human brain functional network with highly connected association cortical hubs. The Journal of Neuroscience. 2006;26:63–72. doi: 10.1523/JNEUROSCI.3874-05.2006. [DOI] [PMC free article] [PubMed] [Google Scholar]
- 76.Ball T, Rahm B, Eickhoff SB, Schulze-Bonhage A, Speck O, Mutschler I. Response properties of human amygdala subregions: evidence based on functional MRI combined with probabilistic anatomical maps. PLoS One. 2007;2:e307. doi: 10.1371/journal.pone.0000307. [DOI] [PMC free article] [PubMed] [Google Scholar]
- 77.Just MA, Keller TA, Malave VL, Kana RK, Varma S. Autism as a neural systems disorder: a theory of frontal-posterior underconnectivity. Neurosci Biobehav Rev. 2012;36:1292–1313. doi: 10.1016/j.neubiorev.2012.02.007. [DOI] [PMC free article] [PubMed] [Google Scholar]
- 78.Gotts SJ, Simmons WK, Milbury LA, Wallace GL, Cox RW, Martin A. Fractionation of social brain circuits in autism spectrum disorders. Brain. 2012 doi: 10.1093/brain/aws160. Epub ahead of print. [DOI] [PMC free article] [PubMed] [Google Scholar]
- 79.Uddin LQ, Kelly AM, Biswal BB, Margulies DS, Shehzad Z, Shaw D, et al. Network homogeneity reveals decreased integrity of default-mode network in ADHD. Journal of Neuroscience Methods. 2008;169:249–254. doi: 10.1016/j.jneumeth.2007.11.031. [DOI] [PubMed] [Google Scholar]
- 80.Weng SJ, Wiggins JL, Peltier SJ, Carrasco M, Risi S, Lord C, et al. Alterations of resting state functional connectivity in the default network in adolescents with autism spectrum disorders. Brain Res. 2010;1313:202–214. doi: 10.1016/j.brainres.2009.11.057. [DOI] [PMC free article] [PubMed] [Google Scholar]
- 81.Cavanna AE, Trimble MR. The precuneus: a review of its functional anatomy and behavioural correlates. Brain. 2006;129:564–583. doi: 10.1093/brain/awl004. [DOI] [PubMed] [Google Scholar]
- 82.Margulies DS, Vincent JL, Kelly C, Lohmann G, Uddin LQ, Biswal BB, et al. Precuneus shares intrinsic functional architecture in humans and monkeys. Proc Natl Acad Sci U S A. 2009;106:20069–20074. doi: 10.1073/pnas.0905314106. [DOI] [PMC free article] [PubMed] [Google Scholar]
- 83.Velasques B, Machado S, Paes F, Cunha M, Sanfim A, Budde H, et al. Sensorimotor integration and psychopathology: motor control abnormalities related to psychiatric disorders. World J Biol Psychiatry. 2011;12:560–573. doi: 10.3109/15622975.2010.551405. [DOI] [PubMed] [Google Scholar]
- 84.Mostofsky SH, Newschaffer CJ, Denckla MB. Overflow movements predict impaired response inhibition in children with ADHD. Percept Mot Skills. 2003;97:1315–1331. doi: 10.2466/pms.2003.97.3f.1315. [DOI] [PubMed] [Google Scholar]
- 85.Fuentes CT, Mostofsky SH, Bastian AJ. Perceptual reasoning predicts handwriting impairments in adolescents with autism. Neurology. 2010;75:1825–1829. doi: 10.1212/WNL.0b013e3181fd633d. [DOI] [PMC free article] [PubMed] [Google Scholar]
- 86.Izawa J, Pekny SE, Marko MK, Haswell CC, Shadmehr R, Mostofsky SH. Motor learning relies on integrated sensory inputs in ADHD, but over-selectively on proprioception in autism spectrum conditions. Autism Res. 2012;5:124–136. doi: 10.1002/aur.1222. [DOI] [PMC free article] [PubMed] [Google Scholar]
- 87.Rogers SJ, Ozonoff S. Annotation: what do we know about sensory dysfunction in autism? A critical review of the empirical evidence. J Child Psychol Psychiatry. 2005;46:1255–1268. doi: 10.1111/j.1469-7610.2005.01431.x. [DOI] [PubMed] [Google Scholar]
- 88.Rogers SJ, Hepburn S, Wehner E. Parent reports of sensory symptoms in toddlers with autism and those with other developmental disorders. J Autism Dev Disord. 2003;33:631–642. doi: 10.1023/b:jadd.0000006000.38991.a7. [DOI] [PubMed] [Google Scholar]
- 89.Wiggins LD, Robins DL, Bakeman R, Adamson LB. Brief report: sensory abnormalities as distinguishing symptoms of autism spectrum disorders in young children. J Autism Dev Disord. 2009;39:1087–1091. doi: 10.1007/s10803-009-0711-x. [DOI] [PubMed] [Google Scholar]
- 90.Kleinhans NM, Johnson LC, Richards T, Mahurin R, Greenson J, Dawson G, et al. Reduced neural habituation in the amygdala and social impairments in autism spectrum disorders. Am J Psychiatry. 2009;166:467–475. doi: 10.1176/appi.ajp.2008.07101681. [DOI] [PubMed] [Google Scholar]
- 91.Monk CS, Weng SJ, Wiggins JL, Kurapati N, Louro HM, Carrasco M, et al. Neural circuitry of emotional face processing in autism spectrum disorders. J Psychiatry Neurosci. 2010;35:105–114. doi: 10.1503/jpn.090085. [DOI] [PMC free article] [PubMed] [Google Scholar]
- 92.Vaidya CJ, Foss-Feig J, Shook D, Kaplan L, Kenworthy L, Gaillard WD. Controlling attention to gaze and arrows in childhood: an fMRI study of typical development and Autism Spectrum Disorders. Dev Sci. 2011;14:911–924. doi: 10.1111/j.1467-7687.2011.01041.x. [DOI] [PubMed] [Google Scholar]
- 93.von dem Hagen EA, Stoyanova RS, Baron-Cohen S, Calder AJ. Reduced functional connectivity within and between ‘social’ resting state networks in autism spectrum conditions. Soc Cogn Affect Neurosci. 2012 doi: 10.1093/scan/nss053. [DOI] [PMC free article] [PubMed] [Google Scholar]
- 94.Rudie JD, Shehzad Z, Hernandez LM, Colich NL, Bookheimer SY, Iacoboni M, et al. Reduced Functional Integration and Segregation of Distributed Neural Systems Underlying Social and Emotional Information Processing in Autism Spectrum Disorders. Cereb Cortex. 2011 doi: 10.1093/cercor/bhr171. [DOI] [PMC free article] [PubMed] [Google Scholar]
- 95.Kleinhans NM, Richards T, Sterling L, Stegbauer KC, Mahurin R, Johnson LC, et al. Abnormal functional connectivity in autism spectrum disorders during face processing. Brain. 2008;131:1000–1012. doi: 10.1093/brain/awm334. [DOI] [PubMed] [Google Scholar]
- 96.Ebisch SJ, Gallese V, Willems RM, Mantini D, Groen WB, Romani GL, et al. Altered intrinsic functional connectivity of anterior and posterior insula regions in high-functioning participants with autism spectrum disorder. Hum Brain Mapp. 2011;32:1013–1028. doi: 10.1002/hbm.21085. [DOI] [PMC free article] [PubMed] [Google Scholar]
- 97.Ho SS, Gonzalez RD, Abelson JL, Liberzon I. Neurocircuits underlying cognition-emotion interaction in a social decision making context. Neuroimage. 2012 doi: 10.1016/j.neuroimage.2012.07.017. [DOI] [PubMed] [Google Scholar]
- 98.LeDoux JE. Emotion circuits in the brain. Annu Rev Neurosci. 2000;23:155–184. doi: 10.1146/annurev.neuro.23.1.155. [DOI] [PubMed] [Google Scholar]
- 99.Pessoa L, Adolphs R. Emotion processing and the amygdala: from a ‘low road’ to ‘many roads’ of evaluating biological significance. Nat Rev Neurosci. 2010;11:773–783. doi: 10.1038/nrn2920. [DOI] [PMC free article] [PubMed] [Google Scholar]
- 100.Roy AK, Shehzad Z, Margulies DS, Kelly AM, Uddin LQ, Gotimer K, et al. Functional connectivity of the human amygdala using resting state fMRI. Neuroimage. 2009;45:614–626. doi: 10.1016/j.neuroimage.2008.11.030. [DOI] [PMC free article] [PubMed] [Google Scholar]
- 101.Etkin A, Prater KE, Schatzberg AF, Menon V, Greicius MD. Disrupted amygdalar subregion functional connectivity and evidence of a compensatory network in generalized anxiety disorder. Arch Gen Psychiatry. 2009;66:1361–1372. doi: 10.1001/archgenpsychiatry.2009.104. [DOI] [PubMed] [Google Scholar]
- 102.Nakao T, Radua J, Rubia K, Mataix-Cols D. Gray matter volume abnormalities in ADHD: voxel-based meta-analysis exploring the effects of age and stimulant medication. Am J Psychiatry. 2011;168:1154–1163. doi: 10.1176/appi.ajp.2011.11020281. [DOI] [PubMed] [Google Scholar]
- 103.Castellanos FX, Lee PP, Sharp W, Jeffries NO, Greenstein DK, Clasen LS, et al. Developmental trajectories of brain volume abnormalities in children and adolescents with attention-deficit/hyperactivity disorder. JAMA : The Journal of the American Medical Association. 2002;288:1740–1748. doi: 10.1001/jama.288.14.1740. [DOI] [PubMed] [Google Scholar]
- 104.Shaw P, Eckstrand K, Sharp W, Blumenthal J, Lerch JP, Greenstein D, et al. Attention-deficit/hyperactivity disorder is characterized by a delay in cortical maturation. Proc Natl Acad Sci U S A. 2007;104:19649–19654. doi: 10.1073/pnas.0707741104. [DOI] [PMC free article] [PubMed] [Google Scholar]
- 105.Supekar K, Uddin LQ, Prater K, Amin H, Greicius MD, Menon V. Development of functional and structural connectivity within the default mode network in young children. Neuroimage. 2010;52:290–301. doi: 10.1016/j.neuroimage.2010.04.009. [DOI] [PMC free article] [PubMed] [Google Scholar]
- 106.Fornito A, Zalesky A, Bassett DS, Meunier D, Ellison-Wright I, Yucel M, et al. Genetic influences on cost-efficient organization of human cortical functional networks. J Neurosci. 2011;31:3261–3270. doi: 10.1523/JNEUROSCI.4858-10.2011. [DOI] [PMC free article] [PubMed] [Google Scholar]
- 107.Weissenbacher A, Kasess C, Gerstl F, Lanzenberger R, Moser E, Windischberger C. Correlations and anticorrelations in resting-state functional connectivity MRI: a quantitative comparison of preprocessing strategies. Neuroimage. 2009;47:1408–1416. doi: 10.1016/j.neuroimage.2009.05.005. [DOI] [PubMed] [Google Scholar]
- 108.Saad Z, Gotts SJ, Murphy K, Chen G, Jo HJ, Martin A, et al. Trouble at Rest: How Correlation Patterns and Group Differences Become Distorted After Global Signal Regression. Brain Connect. 2012 doi: 10.1089/brain.2012.0080. [DOI] [PMC free article] [PubMed] [Google Scholar]
- 109.Birn RM, Diamond JB, Smith MA, Bandettini PA. Separating respiratory-variation-related fluctuations from neuronal-activity-related fluctuations in fMRI. Neuroimage. 2006;31:1536–1548. doi: 10.1016/j.neuroimage.2006.02.048. [DOI] [PubMed] [Google Scholar]
- 110.Rommelse NN, Geurts HM, Franke B, Buitelaar JK, Hartman CA. A review on cognitive and brain endophenotypes that may be common in autism spectrum disorder and attention-deficit/hyperactivity disorder and facilitate the search for pleiotropic genes. Neurosci Biobehav Rev. 2011;35:1363–1396. doi: 10.1016/j.neubiorev.2011.02.015. [DOI] [PubMed] [Google Scholar]
Associated Data
This section collects any data citations, data availability statements, or supplementary materials included in this article.