

Abstract
The transient receptor potential vanilloid type 1 (TRPV1) is a heat-activated cation channel protein, which contributes to inflammation, acute and persistent pain. Antagonists of human TRPV1 (hTRPV1) represent a novel therapeutic approach for the treatment of pain. Developing various antagonists of hTRPV1, however, has been hindered by the unavailability of a 3D structure of hTRPV1. Recently, the 3D structures of rat TRPV1 (rTRPV1) in the presence and absence of ligand have been reported as determined by cryo-EM. rTRPV1 shares 85.7% sequence identity with hTRPV1. In the present work, we constructed and reported the 3D homology tetramer model of hTRPV1 based on the cryo-EM structures of rTRPV1. Molecular dynamics (MD) simulations, energy minimizations, and prescreen were applied to select and validate the best model of hTRPV1. The predicted binding pocket of hTRPV1 consists of two adjacent monomers subunits, which were congruent with the experimental rTRPV1 data and the cyro-EM structures of rTRPV1. The detailed interactions between hTRPV1 and its antagonists or agonists were characterized by molecular docking, which helped us to identify the important residues. Conformational changes of hTRPV1 upon antagonist/agonist binding were also explored by MD simulation. The different movements of compounds led to the different conformational changes of monomers in hTRPV1, indicating that TRPV1 works in a concerted way, resembling some other channel proteins such as aquaporins. We observed that the selective filter was open when hTRPV1 bound with an agonist during MD simulation. For the lower gate of hTRPV1, we observed large similarities between hTRPV1 bound with antagonist and with agonist. A five-point pharmacophore model based on several antagonists was established, and the structural model was used to screen in silico for new antagonists for hTRPV1. By using the 3D TRPV1 structural model above, the pilot in silico screening has begun to yield promising hits with activity as hTRPV1 antagonists, several of which showed substantial potency.
INTRODUCTION
Transient receptor potential (TRP) channels are among the largest families of ion channels.1,2 There are 28 TRP cation channels in the TRP superfamily, which can be further subdivided into six subfamilies: TRPA (“Ankyrin”: TRPA1), TRPML (“Mucolipin”: TRPML1-TRPML3), TRPP (“Polycystin”: TRPP1-TRPP3), TRPM (“Melastatin”: TRPM1-TRPM8), TRPC (“Canonical”:TRPC1-TRPC7), and TRPV (“Vanilloid”: TRPV1-TRPV6).2–4 Many of these ion channels mediate sensations, such as pain, heat, cold, or warmth, different types of tastes, vision, and pressure.
All 28 TRP channels are tetramers, assembled with 4-fold symmetric architecture.5,6 Each individual monomer (subunit) consists of six trans-membrane segments, ankyrin repeats, linker domain, pre-S1 helix, TRP domain, and c-terminal domain. A pore loop and pore helix are located between S5 and S6, forming the ion permeation pathway. Most TRP channels are cation-selective, and some are highly selective for Ca2+ or Mg2+.2
Transient receptor potential vanilloid type 1 (TRPV1) is a member of the TRPV subfamily,7–9 which includes the six members TRPV1 to TRPV6. TRPV1 is a heat-activated (at 52 °C) cation channel, which can be modulated by inflammatory agents.2 TRPV1 is reported to contribute to acute and chronic pain,10 such as osteoarthritis, neuropathic pain, migraine, inflammatory bowel disease, and bone cancer pain. It is also reported to be involved in pain processing and modulation, thermoregulation, and neurogenesis, among other functions.
Residues that affect the TRPV1 sensitivity of vanilloid ligands, such as RTX, capsaicin, AMG9810, and capsazepine, have been identified mainly in trans-membrane segments 3 and 4 (S3–S4).7,11–13 These results suggest that several residues involved in S3–S4 contribute to the binding pocket of vanilloid compounds, including Tyr511, Met547, and Thr550. Chou et al.7 proposed a hypothetical model of the RTX binding site in hTRPV1, according to the crystal structure of the isolated voltage-sensor domain from KvAP (PDB: 1ORQ).14 Gavva et al.8 proposed structures of capsaicin, AMG9810, and RTX according to their model of the putative vanilloid-binding pocket. Chou and colleagues7 and Wang et al.15 constructed models according to the X-ray crystal structure of the voltage-dependent shaker family K+ channel (PDB: 2R9R).16 These tetrameric models were then used to perform docking to the TRPV1 binding pocket for the agonists capsaicin and resiniferatoxin and for evodiamine, respectively. These models, based on experimental data, visualized the interactions between TRPV1 and their compounds. However, these models were mainly based on the structures of non-TRP family channels. Moreover, their binding pockets were mainly formed by one monomer (subunit) of TRPV1, although this depended somewhat on the ligand.
Recently, Julius and co-workers reported the structures of Rattus norvegicus apo-TRPV1 (rTRPV1), rTRPV1 bound with RTX/DkTx or with capsaicin, by using single particle electron cryo-microscopy.5,6 Apo-rTRPV1 assembled with 4-fold symmetric monomers. The central ion pathway was flanked by the voltage-sensor-like domains. Their apo-rTRPV1 structure exhibited a wide extracellular “mouth” with a short selectivity filter. For the structures of rTRPV1 bound with RTX/DkTx or with capsaicin, Julius et al.6 found that the voltage-sensor-like domains (consisting of trans-membrane segments S1–S4) remained stationary, although these domains move during the activation of voltage-gated channels. The authors thus suggested that TRPV1 and potentially other TRP family members differed in their gating. Julius et al.6 also found that during activation of TRPV1 the major structural rearrangements were in the outer pore, including the selectivity filter, the pore helix, and the hydrophobic constriction at the lower gate. They suggested that a dual gating mechanism can be found in TRPV1. Unfortunately, the resolution was insufficient to reveal in detail the nature of the ligand binding interactions with TRPV1.5
Human TRPV1 (hTRPV1) shares 85.7% sequence identity with rTRPV1. The 2690 compounds with selectivity for hTRPV1, as reported in ChEMBL,17 in general share large similarities. Most of the antagonists of hTRPV1, which represent the predominant therapeutic strategy for utilization of vanilloids in the treatment of pain, share a scaffold and R-groups.18–20 Developing antagonists of hTRPV1 has been hindered by the unavailability of the 3D structure of hTRPV1. The detailed interactions between hTRPV1/rTRPV1 and their ligands cannot therefore be ascertained with certainty, although there has been substantial work using modeled structures.21–24 Of particular interest are the differences between TRPV1 bound with agonists and with antagonists.
We used the cyro-EM derived structure of rTRPV1 to construct the 3D homology tetramer model of hTRPV1 exploiting this new level of structural understanding. Molecular dynamics (MD) simulations, energy minimizations, and prescreen were applied to select and validate the best model of hTRPV1. Our modeled binding pocket in hTRPV1 is formed by segments S3, S4, the S4–S5 linker and S5 of one monomer (or subunit), as well as segments S5 and S6 of the adjacent monomer (subunit), which were congruent with the experimental data and the cyro-EM structures of rTRPV1. We analyzed the scaffold, linker, and R-group for known agonists/antagonists of TRPV1, which may guide the synthesis of new compounds. We explored and compared the detailed interactions between hTRPV1 and its antagonists or agonists by using molecular docking. Conformational changes of hTRPV1, antagonist, and agonist were explored by using MD simulation. Our results showed that different movements of compounds in each monomer led to the different conformational changes of the corresponding monomer in hTRPV1, indicating that TRPV1 may work in a concerted way. An important observation was that the selective filter was open when hTRPV1 bound with an agonist during MD simulation, due to different movements of both compounds and monomers. This finding was congruent with the report by Julius and co-workers.6 The state of the lower gate of hTRPV1 bound with different compounds remained similar. A five-point pharmacophore model based on several antagonists was used to develop some new candidate structural antagonists for hTRPV1. Initial testing of these compounds and our in-house compounds as hTRPV1 antagonists and as agonists was performed. We hope these can help us to understand further the roles and functions of TRPV1.
MATERIALS AND METHODS
Preparation of Cyro-EM Structure of rTRPV1 Proteins
No NMR/crystal structures were available for the human TRPV1 (hTRPV1). However, three structures5,6 of Rattus norvegicus TRPV1 (rTRPV1) were reported in 2013, determined by single particle electron cryo-microscopy. The whole sequence identity between hTRPV1 and rTRPV1 was 85.7%. Detailed alignment is shown in Figure S1 in the Supporting Information. We used the structure of rTRPV1-capsaicin (PDB entry: 3J5R, EM resolution: 4.2 Å)5 to construct the 3D structures of hTRPV1. The reasons for choosing this structure were discussed in the section “Homology Models and Conformation Sampling of hTRPV1”. For comparisons, we also built the apo hTRPV1 models by using the structure of apo-rTRPV1 (PDB entry: 3J5P, EM resolution: 3.275 Å).6
The structure of rTRPV1-capsaicin was downloaded from the Protein Data Bank (http://www.pdb.org/pdb/). SYBYL-X 1.325 was used to prepare the structure of rTRPV1-capsaicin, including residual repair and energy minimization.
Homology Modeling
The intact sequence of hTRPV1 (Q8NER1, 839 residues for one monomer) was downloaded from the UniProtKB/Swiss-Prot (http://www.uniprot.org/uniprot/).
We truncated some residues before Leu112 for the N terminus and some residues after Lys719 for the C terminus. We also truncated 24 residues from Asn604 to Ser627. This truncation was necessary because the corresponding residues were unsolved in the structures of rTRPV1. Therefore, the generated sequence was from Leu112 to Lys603 and fromTyr628 to Lys719 (584 residues for one monomer). We connected Lys603 and Tyr628 to generate a continuous polypeptide sequence. We then aligned the sequence and built the homology model based on this hTRPV1 sequence by using our reported protocol.26
The structures of rTRPV1 show that TRPV1 is a tetramer (four monomers). The alignments showed that the monomers were almost the same. In the present work, we used monomer (subunit) A from rTRPV1 (four chains/monomers total) to construct ten models of hTRPV1, by using Modeller9.12.27 Then we generated ten tetramer hTRPV1 models based on the structure of rTRPV1-capsaicin. For further studies, we selected the best three with the lowest root mean squared deviation (RMSD) and without structural crash.
Energy Minimization and Structural Validation
After obtaining the 3D structures, SYBYL-X 1.3 was used for the energy minimizations. The detailed parameters were described in our previous publications.26,28 ProSA-web Z-scores29 and ProCheck Ramachandran plots30,31 were used for structural stereochemical evaluation of the hTRPV1 models.
Conformational Sampling and Secondary Energy Minimization for the hTRPV1 Model
For selecting the most reasonable structure of hTRPV1, we conducted 10 ns MD simulations for the best three models of hTRPV1. The detailed parameters were described in our previous publications.26,28 We first relaxed all the Cα atoms of hTRPV1 to perform a 5 ns MD simulation. Then we performed another 5 ns MD simulation with flexible Cα atoms of hTRPV1. Five conformations of each hTRPV1 model with the lowest energy were subjected to secondary energy minimization by SYBYL. The detailed parameters can be found in the previous section.
Training Data Set for the Validation of hTRPV1 Models
The National Cancer Institute chemical library (NCI2011) was filtered to eliminate metals or mixtures of isotopes, as well as compounds with unsuitable molecular weights that were <250 or >600. Out of 210,000 filtered compounds, 990 compounds were chosen randomly. The 3D coordinates of these structures were generated using SYBYL 1.3. We used the same procedure to prepare ten-known-active hTRPV1 compounds (Figure S2). Special caution was applied to the protonation state of the ionizable groups of all 1000 ligands assumed to be ionized at a physiological pH of 7.4.
Data Set of Agonists and Antagonists for hTRPV1
2690 chemical structures and their bioactivities (Ki value) for hTRPV1 were retrieved from ChEMBL (https://www.ebi.ac.uk/chembl/). We chose 74 hTRPV1 agonists (Ki for TRPV1 lower than 10 μM) and 734 antagonist (all Ki values for TRPV1 lower than 10 μM) for the studies of scaffold, linkers, and R-groups. The analysis of scaffold used “Scaffold Hunter”32 and “ChemAxon’s Fragmenter” (http://www.chemaxon.com/), that implemented the RECAP33 algorithm. The analyses of linker and R-groups used “Fragmenter” and “Similarity Search” in SYBYL 1.3. The structure and bioactivity information on these compounds are listed in Tables S1 and S2 in the Supporting Information.
Molecular Docking for the Studies of Ligand/hTRPV1 Interaction
A series of dockings were conducted for the hTRPV1 model. The MOLCAD module in SYBYL (version 1.3) was used to define the predicted binding pocket of hTRPV1. Surflex-Dock GeomX (SFXC), a docking program in SYBYL, was used to generate the detailed ligand–receptor interactions, in which the docking score was expressed as –log10(Kd).34 The residues involved in the binding pocket are described in the section “Key Residues in the Potential Binding Pocket of hTRPV1”. The detailed parameters35 of docking can be found in our recent publications.26,28
Molecular Dynamics Simulation
After finishing the dockings, we chose structures of hTRPV1 bound with antagonist/agonist for performing the molecular dynamics (MD) simulations.
We paid special attention to the protonation states of His residues, in which His can be ionized at pH 7.40. VEGA ZZ software (version 2.4.0)36 and PROPKA software (version 3.1)37 were used to calculate the pK values of the protein. In the hTRPV1 model, all histidines were not protonated, due to the predicted pK values that were lower than 7.40 (from 2.52 to 6.85). Four residues were charged in the present work, including Asp−, Glu−, Lys+, and Arg+.
The VMD38 program was used for embedding the protein–ligand complexes into a periodic and pre-equilibrated structure of 1-palmytoyl-2-oleoyl-sn-glycero-3-phosphatidylcholine (POPC). We eliminated the lipid molecules that were within 3 Å of the protein. Then we inserted them into a TIP3P39 water box and eliminated the waters molecules within 3 Å of the protein.
The systems (hTRPV1-RTX/hTRPV1-AMG9810, respectively) included the hTRPV1 model, 149/149 lipid molecules, 19434/19434 water molecules, 0/0 sodium ions, and 4/4 chloride ions for a total of 121513/121461 atoms per periodic cell. The sizes of the water–lipid box were 110 × 110 × 110 Å3/110 × 110 × 110 Å3. Then two-step minimizations were conducted, in which each minimization was run for 50,000 steps. The first one was run with the fixed protein, while the second one was run with flexible protein.
Treating the last frame of the second minimization as the starting point, we conducted 50 ns MD simulations by using the NAMD package40 (version 2.9b1) with a CHARMM2741,42 force field within explicit water. Electrostatics were calculated by using the Particle Mesh Ewald43 (PME) method, which was with a 12 Å nonbonded cutoff and a grid spacing of 1 Å per grid point in each dimension. The van der Waals energies were calculated by using two cutoff values. The switching radius was set to 10 Å. The cutoff radius was set to 12 Å. The temperature and pressure were maintained constant by a Langevin thermostat (310 K) and Langevin barostat (1 atm), respectively. The time step of the MD simulations was set to 1 fs. The data were saved every 10 ps for analysis. VMD software was used to analyze the trajectory from the MD simulation.44
Pharmacophoric Filtering and Virtual Screening for hTRPV1
Structural details from known-active compounds of hTRPV1 were used to derive pharmacophoric filters. The GALAHAD program in SYBYL was used to construct a five-point pharmacophore model based on several antagonists including BCTC, AMG0347, A-784168, and SB705498. We filtered the NCI database with compounds that satisfied specific geometric or physicochemical constraints. The parameters used for the generation of the pharmacophore models were described in our previous publications.26,28
When the pharmacophore model was constructed, we used it to filter the NCI database by submitting a UNITY search in SYBYL. The detailed parameters were described in our recent publications.26,28 After filtering the NCI database, we performed the virtual docking screening for hTRPV1. The detailed docking parameters can be found in our other publications.26,28
BINDING COMPETITION ASSAY AND CA2+ UPTAKE ASSAY
Materials
[3H]Resiniferatoxin ([3H]RTX, 37 Ci/mmol) was provided by PerkinElmer Life Sciences (Boston, MA). Radioactive calcium (Ca-45, specific activity 5–30 Ci/g) was obtained from PerkinElmer. Nonradioactive RTX was obtained from LC laboratories (Waltham, MA). Capsaicin was provided by Sigma-Aldrich (St. Louis, MO).
Stable hTRPV1 Expression Cell Line Subculture
Tet-On induced CHO-hTRPV1 cells were cultured in maintaining medium (F12 supplemented with 10% TET-free FBS [Atlanta Biologicals, GA], 25 mM HEPES, 10 μg/mL blasticidin and 250 μg/mL Geneticin (all from Invitrogen Life Sciences; Grand Island, NY). TRPV1 protein was induced with induction medium (F12 supplemented with 10% FBS, 25 mM HEPES, and 1 μg/mL tetracycline) as described below for ligand binding and Ca uptake measurements.45
RTX Competition Binding Assay
Binding studies with [3H]RTX were carried out as follows. The binding assay mixtures were prepared in 1.5 mL centrifuge tubes and consisted of a fixed concentration (approximately 2 nM) of [3H]RTX (37 Ci/mmol specific activity, PerkinElmer Life Sciences), various concentrations of competing ligands, and 100 μg protein of membranes from induced CHO-hTRPV1 expressing cells (approximately 1–3 × 10⁶ cells) in Dulbecco’s phosphate buffered saline (DPBS, with Ca2+ and Mg2+) for a total volume of 350 μL. The assay mix contained bovine serum albumin at a final concentration of 0.25 mg/mL (Cohn fraction V; Sigma-Aldrich, St. Louis, MO). In each set of experiments, nonspecific binding was determined in the presence of 200 nM nonradioactive RTX. The binding reaction was initiated by placing the assay mixture in a 37 °C shaking water bath for 60 min (~30 rpm). The assay mixture was then chilled on ice for 2–3 min before adding 100 μL of α1-acid glycoprotein (2 mg/mL; Sigma-Aldrich) and mixed thoroughly. The tubes were kept on ice for an additional 10 min. The bound and free ligands were then separated by centrifugation (12,200 rpm for 15 min) in a Beckman Coulter centrifuge Allegra 21R. 200 μL of supernatant was collected for determination of free ligand. The remainder was removed by aspiration. The bottom portion of the tubes containing the membranes was cut off and bound radioactivity determined. Radioactivity was measured by scintillation counting. Data were analyzed using GraphPad Prism. Ki values for compounds were determined by competition for binding of [3H]RTX to the hTRPV1 and represent the mean ± SEM of triplicate binding curves. In each curve, triplicate determinations were performed at each ligand concentration.
Calcium Uptake Assays.45
CHO-hTRPV1 cells were plated in 24-well plates, reaching 40 to 60% confluence in maintaining medium after 24 h. The cells were washed once with Dulbecco’s phosphate buffered saline (DPBS; Invitrogen, Grand Island, NY) to remove antibiotics, and fresh medium with tetracycline (inducing medium) was added to induce TRPV1 expression. Experiments were done approximately 24 h after induction. The cells were at least 90% confluent at the time of the assays.
For agonist Ca2+ uptake assays,45 the inducing medium was aspirated and replaced by DMEM (supplemented with bovine serum albumin (0.25 mg/mL), 45Ca2+ (37 kBq/mL), and 100 μL of increasing concentrations of the nonradioactive ligand for a total volume of 400 μL/well. The cells were incubated for 5 min in a water bath at 37 °C. For uptake measurements by a full agonist, a saturating concentration of capsaicin (3000 nM) was used as a positive control. Immediately after incubation, the assay medium was aspirated, and the cells were washed twice with ice cold DPBS (no Ca2+ and Mg2+). The cells were then lysed in radioimmunoprecipitation assay buffer (50 mM Tris-Cl pH 7.5, 150 mM NaCl, 1% Triton X-100, 1% SDS, and 1% sodium deoxycholate; 400 μL/well) for at least 40 min on a shaker. Aliquots (300 μL) of the cell lysates were counted in a liquid scintillation counter. Background uptake was determined in the absence of either compound or capsaicin. For the antagonism assays, capsaicin (30 nM) was included along with increasing concentrations of the ligand being evaluated. The cells were incubated for 5 min in a water bath at 37 °C. Immediately after incubation, the assay medium was aspirated, and the cells were washed twice with ice-cold DPBS (no Ca2+ and Mg2+). The cells were then lysed in radioimmunoprecipitation assay buffer for at least 40 min on a shaker. Aliquots of the cell lysate were counted in a liquid scintillation counter. Triplicate points at each concentration of ligand were determined in each experiment. Compounds were initially screened at a concentration of 30 μM. Compounds showing greater than 10% agonism/antagonism were evaluated in triplicate experiments. As indicated, full dose response curves for compounds showing activity were performed at least three times. Data was analyzed using GraphPad Prism.
RESULTS
Homology Models and Conformation Sampling of hTRPV1
The homology models of hTRPV1 were constructed according to the structure of rTRPV1-capsaicin (PDB entry: 3J5R, EM resolution: 4.2 Å). The reasons for choosing this structure as the template were as the following. First, Julius et al.6 found that Tyr511 had two distinct rotamers between apo-rTRPV1 and rTRPV1 bound with agonists, wherein the side chain of Tyr511 pointed away from or into the binding pocket. They concluded that vanilloid binding involved an “induced fit” mechanism. Second, they also compared three rTRPV16 structures. In the apo rTRPV1, the pathway was rigid at both the selectivity filter and the lower gate. In the structure of rTRPV1-capsaicin, the selectivity filter remained stable, while the lower gate was markedly expanded. In the structure of rTRPV1-RTX/DkTx, the channel was fully open.
We selected the three best tetramer hTRPV1 models to perform 10 ns MD simulation for the conformational sampling, choosing those models that had the lowest root mean squared deviation (RMSD) and were without structural crash. The RMSDs between our models of hTRPV1 and the rTRPV1 bound with capsaicin were 0.28 Å, 0.36 Å, and 0.39 Å. Five conformations of each model with the lowest energy after the MD simulation were selected to perform the secondary energy minimization. After minimization, the top 3 conformations of each model with the lowest energy were chosen for further validation (prescreen).
The hTRPV1 Ligand Data set for Validating the 3D hTRPV1 Model
We selected 3 hTRPV1 conformations of each model (9 conformations total) to perform the prescreen with the data set of 1000-compounds, which included ten compounds that were the known active compounds for hTRPV1. Then the hit rates (HR) as a given percentage of the data set were calculated. Figure 1 and Figure S3 show the relationships between the number of hit compounds identified and the number of compounds screened (here we selected the best prediction for each model). Here, the x%, a given percentage of the screened data set, was set to 2% (top 20 compounds), 5% (top 50 compounds), and 10% (top 100 compounds).
Figure 1.
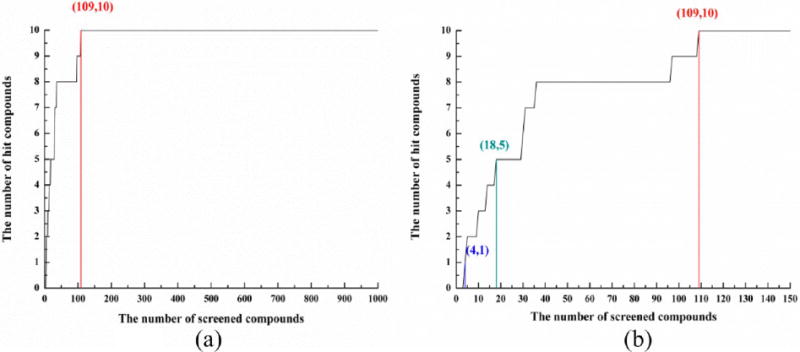
Correlation between the number of hit compounds identified and the number of compounds screened in (a) 1000-compound-data set and (b) top-150-compound-data set (top 15%).
Figure 1 and Figure S3 show the prescreen results of all 3 hTRPV1 models. Although the energies of these models after minimization were very similar (±200 kcals/mol), the hit rates of these models were very different. The 50% hit rates of these three models were within 1.8%, 2.1%, and 15.5% of the screened data set. The 80% hit rates of these models were within 3.6%, 9.7%, and 17.3% of the screened data set (see Figure S3 for more details). We compared these three structures and found the potential reason: the lower the conformational changes for Try511/Thr550, the better the prediction of the data set.
Figure 1a and 1b show the best prediction for the ligand data set. All 10 known active compounds were among the top 109 compounds. The hit rates for different percentages of the screened data set (2%, 5%, and 10%) were 50% (5 compounds), 80% (8 compounds), and 90% (9 compounds), respectively. The 100% hit rate (10 compounds) of this model was within 11% of the screened data set (in the top 109 compounds). This result was acceptable because we selected compounds from the NCI database randomly. The screen data set may include some potential active ligands or flexible ligands.
Furthermore, we conducted the structural evaluation and stereochemical analyses for all three models, using proSA-web Z-scores29 and PROCHECK Ramachandran plots.30,31 The model with the best prescreen results seemed most reasonable, as shown in Figures S4 and S5. The Z-score of the model with the best predicted prescreen result was −6.57, as shown in Figure S4. Ramachandran plots of this model showed that 95.5% (554/580) of all residues were in favored regions; 99.1% (575/580) of all residues were in allowed regions, as shown in Figure S5.
Additionally, we also performed the prescreen with a small data set of 20-compounds, which included ten known active compounds (mentioned previously) and 10 known inactive compounds. Our results showed that the docking scores of 8 known active compounds (80%) were higher than 6.58 (a cutoff value we selected). Moreover, the docking scores of 7 known inactive compounds (70%) were lower than 6.58. These results indicated that our model can distinguish the known active compounds from known inactive ones.
Based on these results, we selected the conformation with the best prediction11,20 as the final 3D model for hTRPV1. The monomer and tetramer structures of hTRPV1 are shown in Figure 2. The 3D coordinates for our hTRPV1 model are in the Supporting Information.
Figure 2.
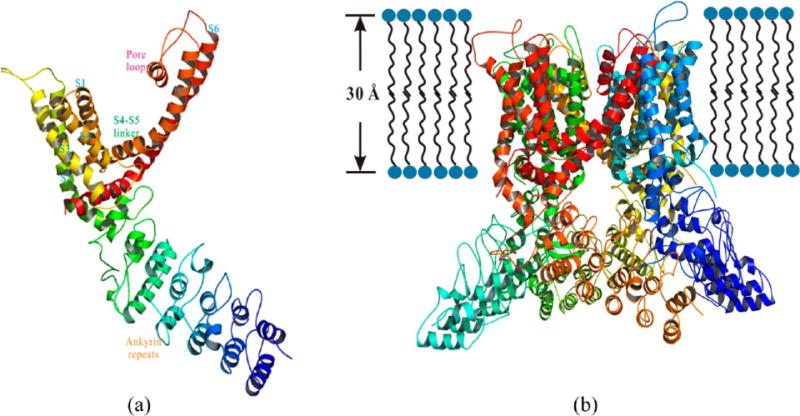
Structural details of (a) monomer or (b) tetramer of hTRPV1, showing views from the sides. A monomer consisted of 584 residues.
Key Residues in the Potential Binding Pocket of hTRPV1
The structures of rTRPV1 bound with RTX/DkTx or with capsaicin lacked sufficient detail to reveal precisely how vanilloids bound. However, from experimental data and electron microscopy (EM) density of RTX/capsaicin, we predicted the potential binding pocket of hTRPV1 by using the MOLCAD module implemented in SYBYL.
The pocket was formed by five trans-membrane domains from two adjacent monomers, including S3, S4, the S4–S5 linker, S5, and S6. The first four domains (S3, S4, the S4–S5 linker, and S5) were in the same monomer (these trans-membrane domain labels are indicated in red). S6 and another S5 domain were from the adjacent monomer (these trans-membrane domain labels are indicated in blue), as shown in Figure 3. The important residues involved in the binding pocket are shown in Figure 3, including Tyr511 (S3), Met514 (S3), Leu518 (S3), Leu547 (S4), Thr550 (S4), Arg557 (S4–S5 linker), Glu570 (S5 of the first monomer), and Leu670 (S6 of the second monomer). These residues were reported to be critical for both agonists and antagonists, including NADA, OLDA, RTX, capsaicin, BCTC, A-425619, AMG9810, SB-366791, capsazepine, and others. An important finding was that the side chain of Tyr511 pointed into the binding pocket in our hTRPV1 model, resembling the structures of rTRPV1- RTX/DkTx or rTRPV1-capsaicin. Our predicted binding pocket and the residues involved in the hTRPV1 pocket were congruent with experimental data and the cyro-EM structures of rTRPV1. (1) Tyr511 was critical for vanilloid sensitivity. Both rTRPV1-Y511A and hTRPV1-Y511A had lower vanilloid sensitivity. The mutation of Y511F was reported to have only a moderate effect for ligand binding. However, the substitution of Cys (Y511C) eliminated the capsaicin sensitivity. (2) Met547 was reported to be a key contributor to RTX binding of TRPV1. The mutation of M547L accounted for the species difference in RTX binding. The M547A mutation in rTRPV1 reduced RTX affinity to the same degree as M547L (30-fold). (3) Ca2+-uptake experiments revealed a 10-fold loss in sensitivity to capsaicin of rTRPV1-T550I and a 40-fold loss in sensitivity of hTRPV1-T550I. Moreover, the mutation of T550I significantly reduced the binding of [3H]RTX in transfected cells of rTRPV1. (4) Other residues including Met514, Leu518, and Leu670 were also reported to contribute to the binding pocket of TRPV1.
Figure 3.
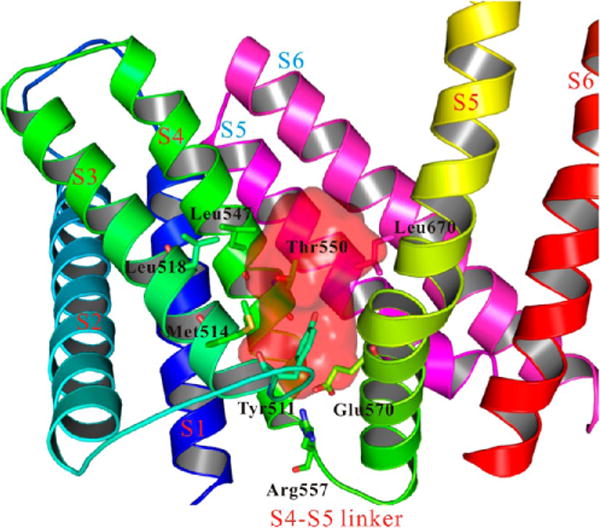
Predicted binding pocket of hTRPV1. The pocket was formed by four trans-membrane domains from two monomers. The pocket was highlighted in red color, while the trans-membrane domains from different monomers were indicated by lettering in two different colors (red and blue). The important residues were shown in sticks, including Tyr511, Met514, Leu518, Leu547, Thr550, Arg557, Glu570, and Leu670.
DISCUSSION
Structural Analysis of Known hTRPV1 Compounds
2690 chemical structures and their bioactivity (Ki value) to TRPV1 were retrieved from ChEMBL (https://www.ebi.ac.uk/chembl/). Multiple compounds have entered clinical development as shown in Table 1, including agonists and antagonists. Almost all the compounds related to pain, and the numbers of antagonists entered in clinical development were more than those of agonists. From ChEMBL, the number of compounds with marked-agonist-activities was 334, compared to 1489 with marked-antagonist-activities. In the present work, we selected 74 TRPV1 agonists (Ki for TRPV1 lower than 10 μM) and 734 antagonist (all with Ki values for TRPV1 lower than 10 μM) for further studies, including scaffolds, linkers, and R-groups of the compounds.
Table 1.
Reported Compounds Currently in Development or Being Marketeda
| drug | effect on TRPV1 | condition | phase |
|---|---|---|---|
| capsaicin | agonist | dysphagia, aspiration, swallow response, videofluoroscopy, sensorial neurostimulation | phase 2 |
| resiniferatoxin | agonist | pain/cancer | phase 1 |
| intrathecal resiniferatoxin | agonist | pain, intractable | phase 2 |
| civamide nasal spray | agonist | dry eye | phase 2 |
| civamide nasal solution | agonist | episodic cluster headache | phase 3 |
| 30% mannitol in vehicle cream | antagonist | pain | efficacy study |
| JNJ-39439335 | antagonist | pain | phase 1 |
| SYL1001 | antagonist | ocular pain | phase 1 |
| AZD1386 | antagonist | pain | phase 2 |
| DWP05195 | antagonist | postherpetic neuralgia | phase 2 |
| SB-705498 | antagonist | migraine, acute | phase 2 |
| SB-705498 | antagonist | toothache | phase 2 |
| SB-705498 | antagonist | nonallergic rhinitis | phase 2 |
| SB-705498 | antagonist | dermatitis, atopic | phase 1 |
| SB-705498 | antagonist | irritable colon, fecal urgency, irritable bowel syndrome | phase 2 |
| XEN-D0501 | antagonist | chronic obstructive pulmonary disease | phase 2 |
| XEN-D0501 | antagonist | chronic idiopathic cough | phase 2 |
These data are from ClinicalTrials.gov, a service of the U.S. National Institutes of Health.
Figures 4 and 5 show the results of agonists and antagonists. The numbers represented the counts of fragments that were found in agonists/antagonists. The modifications of the benzene ring for antagonists were more varied than for agonists. Moreover, for agonists, the lengths of linkers were 2–3 carbons. However, for antagonists, the lengths of linkers were more than 3 carbons, and more than 327 structures had a 4-carbon-linker. The R-groups also differed greatly between agonists and antagonists. We hope that the comparisons of structural properties between agonists and antagonists will help us to understand more about the structure activity relations for TRPV1 ligands and will suggest novel structural solutions providing agonists/antagonists. In particular, a critical issue in the field is the development of antagonists which can dissociate antagonism from generation of hyperthermia. A further critical issue is that vanilloid structure activity relations can be modulated by the signaling state of the cell.24 Design of ligands selective for a specific signaling environment may provide the opportunity for establishing a local therapeutic response, e.g. at a site of inflammation, upon systemic treatment.
Figure 4.
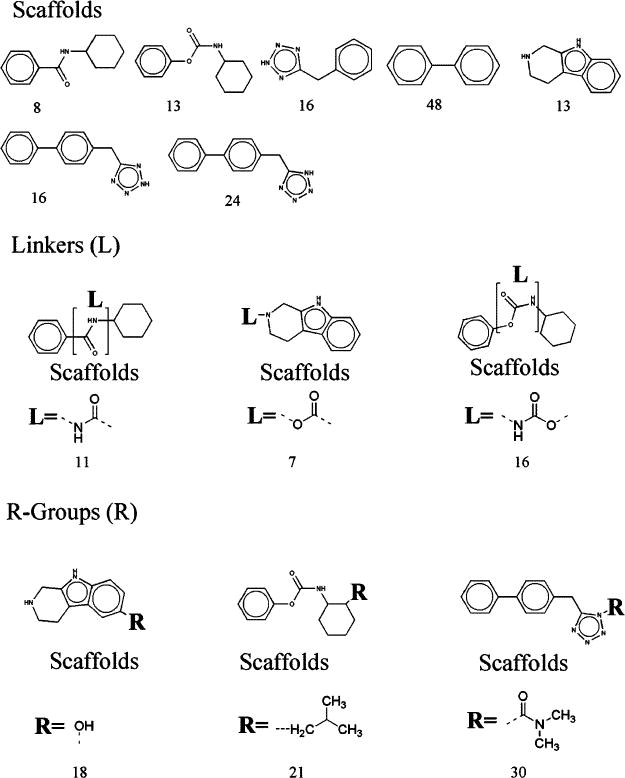
Analysis of scaffolds, linkers, and R-groups for 74 agonists. The numbers represented the counts that were involved in 74 agonists.
Figure 5.
Analysis of scaffolds, linkers, and R-groups for 734 antagonists. The numbers represented the counts that were involved in 734 antagonists.
Binding Modes of Agonists-RTX and Capsaicin
We docked two agonists, RTX and capsaicin, into our hTRPV1 model, as shown in Figure 6.
Figure 6.
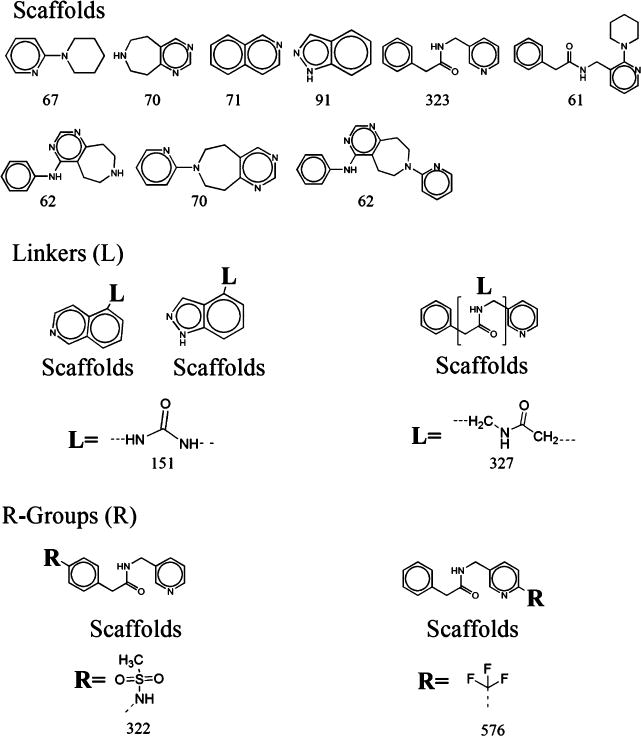
Detailed binding modes of (a) RTX and (b) capsaicin with hTRPV1. Two residues, Tyr511 and Thr550, formed strong hydrogen bonds with the agonists.
Comparing Figure 6a with 6b, we found many similarities of the binding between these two compounds. First, the polar or charged groups of the agonists were in the bottom part of the binding pocket, facing the hydrophilic regions formed by Ser512 (not shown), Tyr554 (not shown), Arg557, and Glu570. Second, several residues including Met514, Leu515 (not shown), Tyr511, and Leu670 formed strong hydrophobic interactions with these two compounds. Third, two residues including Tyr511 and Thr550 formed strong hydrogen bonds with these two compounds in the middle of the binding pocket. Several hydrophobic residues including Leu518, Leu547, and Ala666 (not shown) formed hydrophobic interactions with them in the top of the binding pocket.
Our binding modes of these two agonists were congruent with the electron microscopy (EM) map reported by Julius and co-workers.5 Although they did not have enough detail to reveal precisely how vanilloids bound, residues in close proximity can be observed. Their EM map indicated the potential poses of RTX and capsaicin. The binding pose of these two agonists in our hTRPV1 model matched with the EM map well. Our docking results were also congruent with the docking results of Lee and co-workers,23 building their homology model of rTRPV1 based on voltage-dependent shaker family K+ channel (PDB: 2R9R). The capsaicin bound to their model shared a similar pose with our results.
Binding Modes of 8 Antagonists
We also selected 8 antagonists, including A-784168, A-425619, AMG2674, AMG0347, AMG9810, BCTC, JNJ17203212, and SB705498, to dock into our hTRPV1 model. The docking results are shown in Figure 7 and Figure S6.
Figure 7.
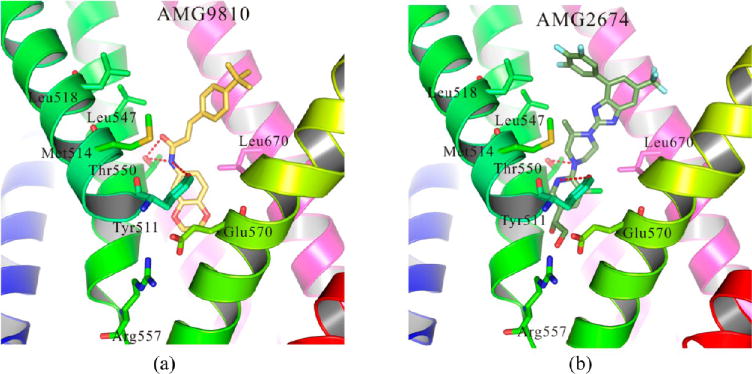
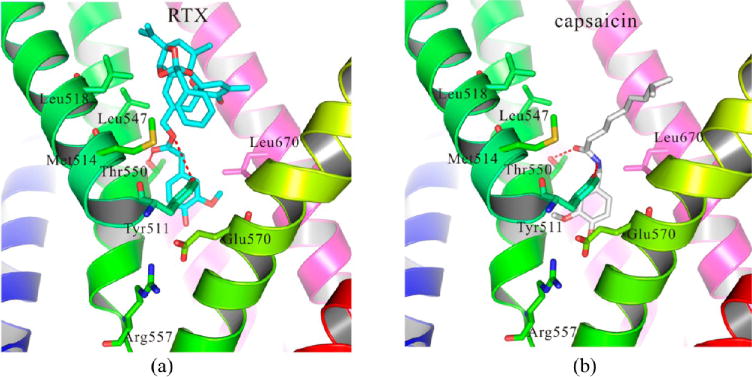
Detailed binding modes of 2 antagonists with hTRPV1, including (a) AMG9810 and (b) AMG2674. Two residues, Tyr511 and Thr550, formed strong hydrogen bonds with the antagonists. The binding modes of other six antagonists with hTRPV1 can be found in S6.
According to our results, most residues involved in the binding pocket had similar roles for the recognition of antagonists. (1) Ser512 (not shown), Arg557, and Glu570 formed a hydrophilic pocket that interacted with the polar/charged groups of the antagonists. (2) Thr550 and/or Tyr511 also formed strong hydrogen bonds with these 8 compounds. (3) Several hydrophobic residues formed strong hydrophobic interactions with all these antagonists, including Met514, Leu515 (not shown), Leu518, Leu547, Ala666 (not shown), and Leu670. The agonists and antagonists therefore shared the same binding pocket and similar binding interactions, which were congruent with the findings of GPCRs.46,47 Our docking results were congruent with the findings by Kim and coworkers.21,22 They built a human TRPV1 model based on their rat TRPV1 model and conducted the dockings with their antagonist 3R (a chiral simplified resiniferatoxin analogue), compound 2, and 49S (2-piperidinyl derivative). Their docking results with these antagonists shared large similarities with the docking results of our hTRPV1 model. Our docking results were also supported by the findings of the same group as reported by Thorat and co-workers.48 They docked their compound 53S (antagonist, a 2-(3-fluoro-4-methylsulfonylaminophenyl)-propanamide derivative) into their model, which shared a similar binding mode with our results.
RMSD and RMSF for hTRPV1 Bound with Antagonists/Agonists from MD Simulations
In order to compare the conformational changes of hTRPV1 bound with different compounds, we performed 50 ns MD simulations for hTRPV1-AMG9810 or hTRPV1-RTX.
The overall stability of the protein throughout the molecular dynamics simulations was monitored by the root-mean-square deviation (RMSD) of Cα, as shown in Figure 8a. We found that these two systems remained stable during the 50 ns MD simulations. The RMSD values reached plateau values of approximately 5 Å after 20 ns. Therefore, 50 ns was a reasonable time scale for our purpose of comparing the differences between hTRPV1 bound with antagonist and hTRPV1 bound with agonist. To investigate the influence of compounds on the overall flexibility of hTRPV1, the root-mean-square fluctuations (RMSF) of the Cα were also calculated, as shown in Figure 8b. These two systems shared qualitatively similar profiles of RMSF for the corresponding monomer. When we compared four monomers (or four subunits) in each hTRPV1, the RMSF of each monomer was different, as shown in Figure 8b. These results suggest that TRPV1 works with concerted movements (not in a synchronous way), akin to some other proteins, including aquaporins49–51 and FocA.52 The following discussion elaborates in detail on these findings.
Figure 8.
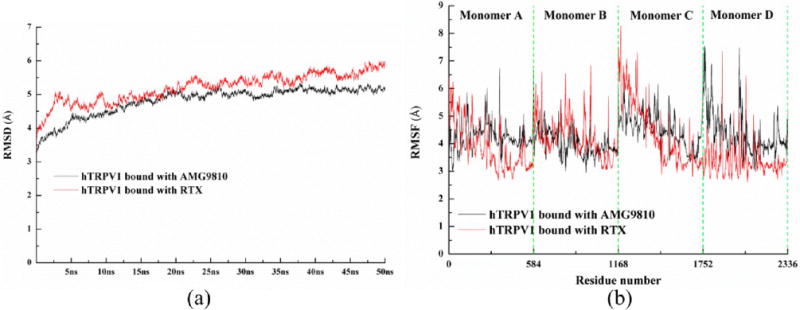
(a) Time evolutions for the deviation of hTRPV1 bound with AMG9810 (antagonist, highlighted in black color) and bound with RTX (agonist, highlighted in red color) during 50 ns MD simulations, (b) calculated RMSF of Cα atoms vs protein residue number for hTRPV1 bound with AMG9810 (antagonist, highlighted in black color) and bound with RTX (agonist, highlighted in red color).
Interactions between hTRPV1 and Antagonists/Agonists from MD Simulations
We compared the changes of binding modes and interactions of AMG9810 and of RTX after MD simulations.
Figures 9a, 9b, and S7 show the detailed interactions between hTRPV1 and these compounds. Figures 9c and 9d show the important hydrogen bonds between the receptor and ligands. We selected the interactions of monomer D and its compounds for further discussion. The deviations/fluctuations of monomer D were the most different. The four AMG9810 molecules (antagonist, one monomer bound one antagonist) remained stable during the MD simulations, which were shown in Figure S7a. When compared with the original positions of AMG9810 in each monomer, the deviations (RMSD) of AMG9810 ranged from 0.2 to 0.4 Å. Two residues formed strong hydrogen bonds with AMG9810, including Tyr511 and Thr550, as shown in Figure 9c. Several hydrophobic residues, including Met514, Leu515, Leu518, Leu547, and Leu670, formed strong hydrophobic interactions with AMG9810. The interactions between the other three monomers (monomer A, B, and C) are presented in Figure S7a in the Supporting Information.
Figure 9.
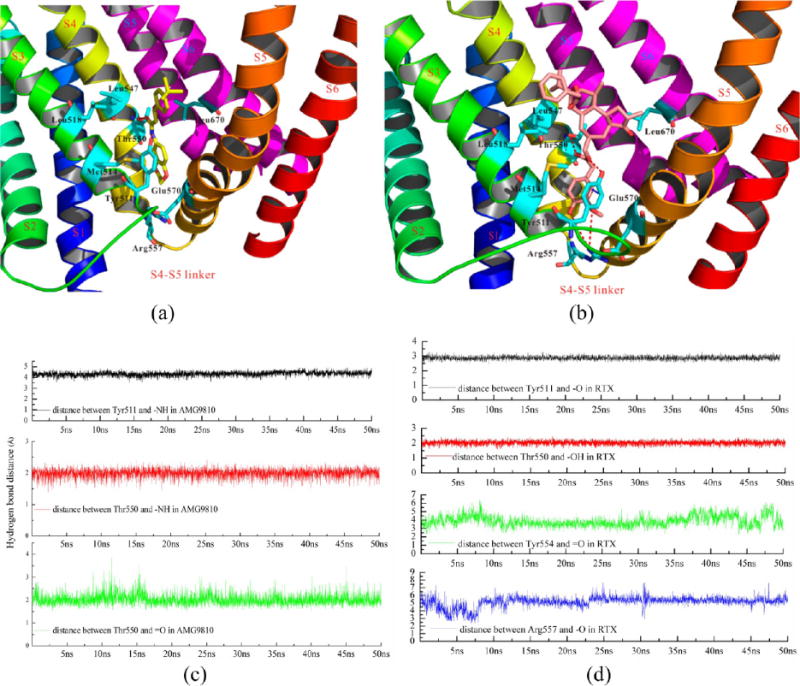
(a) The detailed interactions between hTRPV1 and AMG9810 after 50 ns MD simulation, (b) the detailed interactions between hTRPV1 and RTX after 50 ns MD simulation, (c) the hydrogen bonds between hTRPV1 and AMG9810 during MD, and (d) the hydrogen bonds between hTRPV1 and RTX during MD. We selected the monomer D for clarity. The deviations/fluctuations of monomer D showed the most differences.
RTX (agonist) fluctuated greatly during the MD simulation. Three RTX molecules (in monomers A, B, and D) fluctuated more, with deviations (RMSD) of RTX that ranged from 0.8 to 1.3 Å. Two residues, including Tyr511 and Thr550, also formed strong hydrogen bonds with RTX during the MD simulations. Two additional residues, Tyr554 and Arg557, also formed hydrophilic interactions with RTX, as shown in Figure 9d. Met514, Leu515, Leu518, Leu547, and Leu670 also formed strong hydrophobic interactions with RTX. Detailed interactions in the other monomers are in Figure S7b.
We found larger changes with agonists than with antagonists, similar to the findings with GPCRs.28,44 We suggest that the flexible structure of RTX may be the reason. First, comparing the structure of RTX with AMG9810, we found that RTX seemed more flexible. Second, comparing the binding pose of RTX with AMG9810, our results showed that RTX was exposed to the lipids, while AMG9810 was “captured” in the binding pocket. So, RTX can move against the central pore of hTRPV1, while AMG9810 cannot (see the discussion in the following sections). This finding is reminiscent of the larger effect on structure activity observed for agonists as compared to antagonists upon altering the state of TRPV1 phosphorylation.24 The strong conformational changes of agonists led to large movements of corresponding monomers. The pore profiles were thereby affected more for the agonist-bound than for the antagonist-bound hTRPV1. More details are in the following discussion.
Conformational Changes of hTRPV1 and Residual Rearrangements of hTRPV1 Bound with Agonists as Determined by the MD Simulations
We compared the conformational changes of hTRPV1 bound with different compounds. We also compared the residual rearrangements of hTRPV1 bound with different compounds.
We first aligned each monomer with the monomer A of hTRPV1 before MD simulation, as shown in Figure S8a (the alignments for antagonist-bound) and S8b (the alignments for agonist-bound). The monomer highlighted in gray color was the monomer A before MD simulation, while the colored monomers were the monomers after MD simulation. In Figure S8a, the conformational changes of the four monomers bound with antagonists were stable. The voltage-sensor-like domains (S1–S4) moved toward the central pore of hTRPV1. The pore helix between S5 and S6 did not show large conformational changes. However, in Figure S8b, the conformational changes of the four monomers bound with agonists deviated greatly. Important results were the outward movements of the four monomers and the strong deviations of the pore helix, shown in Figure S8b.
We also calculated the RMSD of Cα from the four monomers (or subunits) in hTRPV1 bound with AMG9810 or with RTX, as listed in Tables S3 and S4 in the Supporting Information. hTRPV1 bound with agonist showed large conformational changes. When comparing the monomers in each of the two hTRPV1 complexes, a clear finding was that the four monomers (or subunits) had different conformational changes either in the complex with the bound antagonist or the bound agonist. Details are shown in Figure S8. These results resembled those for some other channel proteins, such as aquaporins49–51 and FocA.52 The TRPV1 therefore may work in a concerted but not synchronous way.
Figure S9 shows the alignments of tetrameric hTRPV1 bound with different compounds, Some monomers of hTRPV1 bound with agonists moved outward against the central pore, in contrast to the behavior of hTRPV1 bound with antagonists.
Figure 10 shows the clarified alignments of monomer D. Monomer D bound with RTX (highlighted in red) moved against the central pore. Figure 10 also shows the residual rearrangements. The segments of S1–S6 in the complex with agonist-bound moved outward, causing the similar movements of residues (highlighted in red). A special finding was that trans-membrane segments S1–S4 remained stationary, although they moved during the activation (bound with agonist) of voltage-gated channels. Our results were congruent with the report by Julius and co-workers.6
Figure 10.
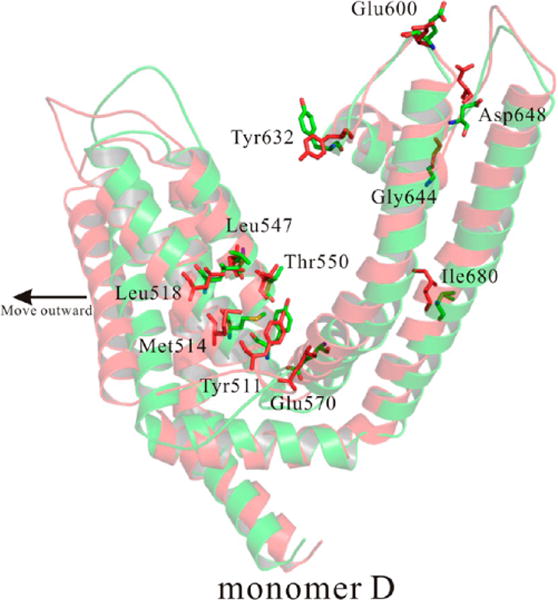
Outward movements and residual rearrangements for monomer D bound with RTX from MD simulations. Monomer D bound with RTX was highlighted in red, while monomer D bound with AMG9810 was highlighted in green. Important residues were shown as sticks.
The hTRPV1 bound with different compounds had different conformational changes, leading to different residual rearrangements, which further affected the profiles of the central pore according to the following details.
Pore Profiles for hTRPV1 Bound with Antagonist/Agonist from MD Simulations
We used the HOLE53 program to visualize the solvent-accessible pathway along the pore, shown in Figure 11. For comparisons, we also used the structure of apo-rTRPV1 (PDB entry: 3J5P, EM resolution: 3.275 Å)6 to build the apo hTRPV1 model.
Figure 11.
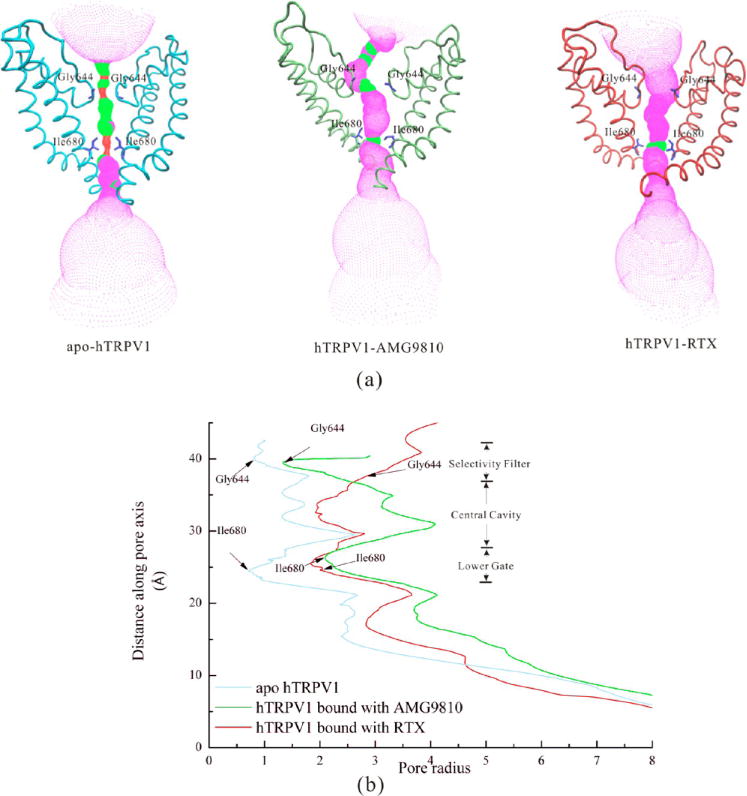
Comparisons of (a) the solvent-accessible pathway and (b) the pore radius along the channel for apo hTRPV1, hTRPV1-AMG9810 (50th ns conformation), and hTRPV1-RTX (50th ns conformation). Two residues for the selectivity filter (Gly644) and the lower gate (Ile680) were shown as sticks. The HOLE program was applied to calculate the radius, while VMD was used for visualization. The red color represents highly constricted regions. The magenta color represents the open regions. The green color represents regions intermediate between constricted and open.
Figure 11a shows the solvent-accessible pathway along the channel for apo hTRPV1, hTRPV1-AMG9810 (50th ns conformation), and hTRPV1-RTX (50th ns conformation). Figure 11b shows the pore radius along the channel for these three structures. Two residues for the selectivity filter and lower gate were shown as sticks, including Gly644 and Ile680.
In the structure of apo hTRPV1, the pathway was constricted at both the selective filter (radius was ~0.85 Å) and the lower gate (radius was ~0.82 Å). This result was congruent with the report of the apo rTRPV1 by Julius5 and co-workers. Their radii for the selectivity filter and the lower gate were ~0.75 Å and ~1.0 Å, respectively.
In the structure of hTRPV1 bound with antagonist-AMG9810 (50th ns conformation), we showed that the radius of the selectivity filter was ~1.3 Å, a little bigger than that of apo hTRPV1 (~0.85 Å). The radius of the lower gate was (~2.1 Å), markedly bigger than that of the apo hTRPV1, which was also similar to that of rTRPV1-capsain (~2.0 Å). According to our results, the selectivity filter was still constricted with the antagonists bound.
In the structure of hTRPV1 bound with agonist-RTX (50th ns conformation), our results showed that both the radii of the selectivity filter (~2.7 Å) and the lower gate (~1.9 Å) were bigger than that of apo hTRPV1. The radius of our selectivity filter also agreed with the finding of rTRPV1-RTX/DkTx by Julius and co-workers (~2.5 Å).5 The radius of the lower gate was smaller than that of rTRPV1-RTX/DkTx (~3.0 Å) but similar to that of rTRPV1-capsaicin (~2.0 Å), both of which were reported by Julius and co-workers.5 We suggest that the gating of the selectivity filter and lower gate were not synchronous, and the selectivity filter was first gated in the agonist-bound state, revealing a dual gating mechanism.
Comparing hTRPV1 bound with the antagonist AMG9810 and that bound with the agonist RTX, we showed that the main difference was at the selective filter. The selective filter was open when hTRPV1 was bound with agonist. Figure 12 shows the conformational changes of the pore profile at different times of simulation. We selected the results from 30 to 50 ns (after equilibration). We showed that the selective filter gradually opened during the MD simulation upon binding RTX. Figure 12b shows the details. The selective filter did not change much when hTRPV1 bound with AMG9810, as shown in Figure 12a.
Figure 12.
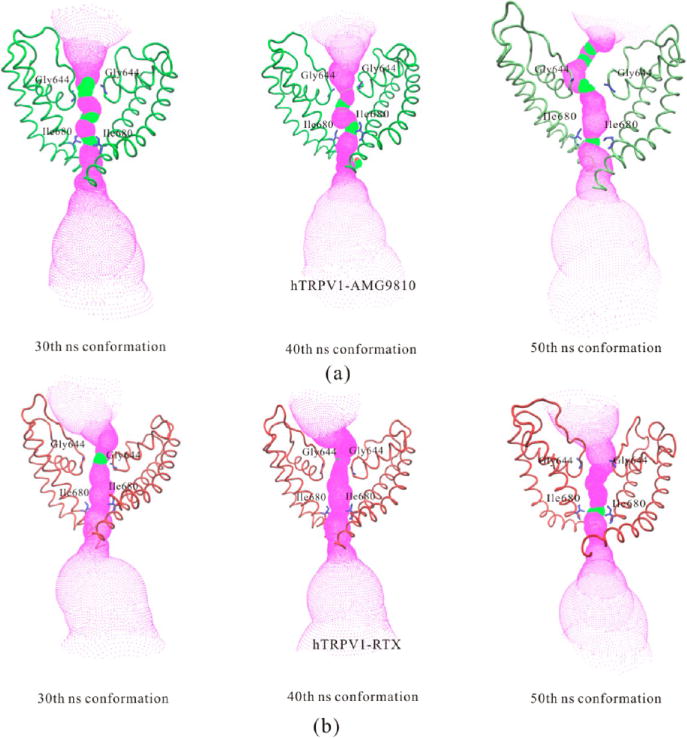
Comparisons of the solvent-accessible pathway for (a) hTRPV1-AMG9810 and (b) hTRPV1-RTX at different simulation times.
Due to different conformational changes of compounds and residual rearrangements in the segments, the profiles of the central pore and the gating phenomenon differed for hTRPV1 bound with different compounds.
Allosteric Binding Pocket for hTRPV1
As we discussed in the previous section, four predicted pockets were in the tetramer hTRPV1 model, as shown in Figure S10 in the Supporting Information. Each predicted binding pocket was formed by five trans-membrane domains from two adjacent monomers, including S3, S4, S4–S5 linker, S5, and S6. An important observation was that the binding pockets of hTRPV1 differed from the traditional orthosteric binding site because they were exposed to the lipids, as shown in Figure S10. Our MD simulation showed that both AMG9810 (antagonist) and RTX (agonist) were close to the lipid molecules (~5.4 and 5.7 Å for these two compounds, respectively). All the results showed that these were allosteric binding pockets. Our findings were congruent with the reports by Julius and co-workers.5,6 In their apo structure of rTRPV1, they observed some density in the same site as the agonists, possibly corresponding to a detergent molecule or lipid. They suggested that this binding site of ligands was in exchange with lipid molecules. This hypothesis was supported by experimental data, suggesting that TRPV1 can be activated by lipophilic or lipid molecules, such as diacylglycerols and anandamide. Consistently, some studies already showed a shared binding site for RTX and anandamide and partial activation of TRPV1 by diacylglycerol.54,55
Pharmacophore Model and Virtual Screen For hTRPV1
The GALAHAD program in SYBYL was used to construct a five-point pharmacophore model based on several antagonists, including BCTC, AMG0347, A-784168, and SB705498. For clarity we chose BCTC as the example, as shown in Figure 13.
Figure 13.
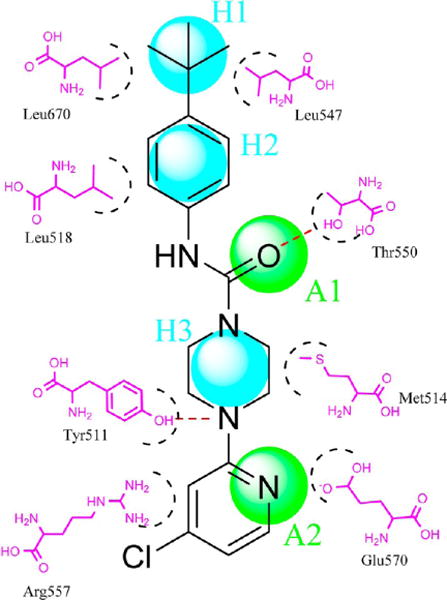
Two-dimensional pharmacophore model H3A2 showed three hydrophobic or hydrophobic aromatic centers (H) and two H-bond acceptors (A). The model was based on several antagonists, including BCTC, AMG0347, A-784168, and SB705498. Distance restrictions of this pharmacophore model are listed in Table 2.
In our pharmacophore model, we defined two H-bond acceptors (A) and three hydrophobic or hydrophobic aromatic centers (H). The distance restrictions of pharmacophore model are shown in Table 2. The pharmacophore model agreed with the interactions of both agonists and antagonists. More details were described in the previous sections. This model was applied to filter the NCI database. A set of 210,000 NCI compounds was thereby narrowed down to 15,672 compounds.
Table 2.
Distance Restrictions of the Pharmacophore Model Presented in Our Work
| H1-H2a distance 1b | H2-A1 distance 2 | A1-H3 distance 3 | H3-A2 distance 4 | A2-H1 distance 5 |
|---|---|---|---|---|
| 2.9 | 4.0 | 3.9 | 3.4 | 12.6 |
A, hydrogen bond acceptor, H, hydrophobic or hydrophobic aromatic center.
The distances were depicted in Å with an error range of ±1 Å.
A virtual docking screen was carried out on the optimized 3D chemical compound library (15,672 compounds). We selected some compounds with higher docking score (>8.0) from NCI for testing. See the results in the following section.
Potential Inhibitors from in Silico Screening Validated our TRPV1 Model
For an initial evaluation of the utility of the model for identifying novel structures with hTRPV1 activity, we examined a panel of 6 in-house compounds and 32 others from NCI or from commercial sources. Our in-house compounds were selected on the basis of the docking score (higher than 8.0). 32 others were selected on the basis of our pharmacophore model and the virtual docking screening. Of the six in-house compounds, one (Figure 14a, XIE1-203Y) antagonized capsaicin stimulation of hTRPV1 by 12.7 ± 1.0% at 30 μM. Among the other compounds, 2 gave 98.2 ± 2.7% (Figure 14b, compound 1) and 79.9 ± 4.9% (Figure 14c compound 2) inhibition at 30 μM. These compounds yielded Ki values for capsaicin antagonism of 2.60 ± 0.62 (Figure 14d, compound 1) and 4.50 ± 0.88 (Figure 14e, compound 2) μM, respectively. They likewise inhibited [3H]RTX binding to hTRPV1 with Ki values of 1.11 ± 0.21 and 5.20 ± 0.32 μM, respectively. We also presented the detailed interactions between hTRPV1 and these two compounds, as shown in Figure 14f and 14g. Compared with the known agonists and antagonists, these two compounds shared large similarities. Our results showed that both Tyr511 and Thr550 formed strong hydrogen bonds with these two compounds. Two residues, in particular Met514 and Leu547, formed strong hydrophobic interactions with compounds 1 and 2. Different from the results with the known compounds, our results showed that Arg557 also formed strong hydrogen bonds with compounds 1 and 2. Additionally, our results showed that our in-house compound (XIE1-203Y) did not show good inhibition and binding affinity. We docked the in-house compound XIE1-203Y into our model, and we found that XIE1-203Y cannot form a hydrogen bond (>5.8 Å) with Thr550, although Thr550 plays a key role for the recognition of compounds for TRPV1. These compounds from in silico screening further validated our model.
Figure 14.
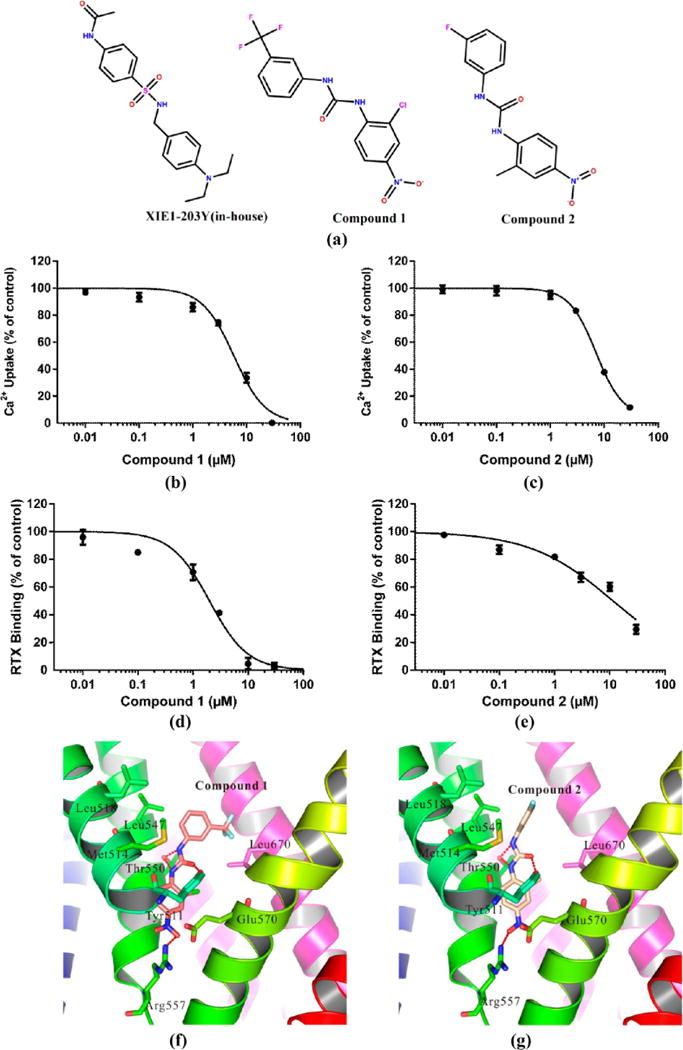
Chemical structures of potential inhibitors from in silico screening. Of the six in-house compounds, one (part a, XIE1-203Y) antagonized capsaicin stimulation of hTRPV1 by 12.7 ± 1.0% at 30 μM. Among the other compounds, 2 gave 98.2 ± 2.7% (part b, compound 1) and 79.9 ± 4.9% (part c compound 2) inhibition at 30 μM. These compounds yielded Ki values for capsaicin antagonism of 2.60 ± 0.62 (part d, compound 1) and 4.50 ± 0.88 (part e, compound 2) μM, respectively. They likewise inhibited [3H]RTX binding to hTRPV1 with Ki values of 1.11 ± 0.21 and 5.20 ± 0.32 μM, respectively. Curves are from representative experiments. Values represent the mean ± SEM of triplicate experiments. The detailed interactions between hTRPV1 and these two compounds are shown in parts f and g.
CONCLUSIONS
The capsaicin receptor (TRPV1) is one member of the TRPV family of nonselective cation channels. TRPV1 is reported to play a key role in many sensory functions and represents an attractive therapeutic target for numerous indications.
In this work, we constructed and reported the 3D homology tetramer model of hTRPV1 derived from the cryo-EM structures of rTRPV1 reported by Julius and co-workers (~2.5 Å).5 Several computational techniques were applied to select and validate the best model of hTRPV1, including MD simulation and molecular docking. The predicted binding pocket of hTRPV1 consisted of two adjacent monomers (subunit), including S3, S4, S4–S5 linker, S5, and S6, which were congruent with the experimental data and the cyro-EM structures of rTRPV1. We analyzed the scaffolds, linkers, and R-groups for known agonists/antagonists of hTRPV1 to learn more about the active compounds of TRPV1. We further explored the detailed interactions between hTRPV1 and its antagonists/agonists by using molecular docking. We then performed MD simulations to assess the conformational changes of hTRPV1 upon antagonist/agonist binding. Our results showed that different compounds led to the different conformational changes of the monomers in hTRPV1. TRPV1 therefore worked in a concerted way, resembling some other channel proteins such as aquaporins. Due to different movements of both compounds and monomers, we made the important observation that the selective filter was open when hTRPV1 bound with an agonist, while the selective filter was constricted when hTRPV1 bound with an antagonist. Our results of hTRPV1 bound with agonists were congruent with the report of cyro-EM structures of rTRPV1 and also showed differences for hTRPV1 bound with different compounds. For the lower gate of hTRPV1 bound with different compounds, we observed that they were similar to each other. A five-point pharmacophore model based on several reported antagonists and virtual docking screening was successfully used to identify and experimentally confirmed several novel antagonists for hTRPV1. In return, the results also confirm the 3D structural model of hTRPV1. Furthermore, our new 3D hTRPV1 structural model based on recent rTRPV1 data provides better understanding of the structural and functional roles of TRPV1 and should also facilitate the future structure-based design of novel TRPV1 antagonists with therapeutic potential.
Supplementary Material
Acknowledgments
The project is supported by funding to the Xie laboratory from the NIH NIDA (P30 DA035778A1) and NIH (R01 DA025612) and in part by the Intramural Program of the Center for Cancer Research, National Cancer Institute, NIH (Project Z1A BC 005270). We also thank our lab member Ms. Guanxing Hu for collecting data on the compounds reported or marketed.
Footnotes
Supporting Information
Figure S1 shows the sequence alignment between hTRPV1 and rTRPV1. Figure S2 shows 10 active compounds for the hTRPV1 prescreen. Figure S3 shows the correlation between the number of hit compounds identified and the number of compounds screened for two other hTRPV1 models. Figure S4 shows the overall model quality of hTRPV1 model constructed by rTRPV1. Figure S5 shows Ramachandran plots of the hTRPV1 model constructed by rTRPV1. Figure S6 shows the detailed binding modes of other six antagonists with hTRPV1. Figure S7 shows the alignments of four bound AMG9810 molecules and four bound RTX molecules after MD simulation. Figure S8 shows the alignments of four monomers (or subunits) of hTRPV1 bound with AMG9810/RTX. Figure S9 shows the alignments of hTRPV1 bound with AMG9810 and bound with RTX. Figure S10 shows four allosteric binding pockets in the tetramer hTRPV1 model. Table S1 shows a list of structure and bioactivity information on 74 agonists for hTRPV1. Table S2 shows a list of structure and bioactivity information on 734 antagonists for hTRPV1. Table S3 shows the Cα RMSD of the four monomers (or subunits) in hTRPV1 bound with AMG9810. Table S4 shows the Cα RMSD of the four monomers (or subunits) in hTRPV1 bound with RTX. This material is available free of charge via the Internet at http://pubs.acs.org.
Notes
The authors declare no competing financial interest.
References
- 1.Ryu H, Jin M-K, Kim SY, Choi H-K, Kang S-U, Kang DW, Lee J, Pearce LV, Pavlyukovets VA, Morgan MA, Blumberg PM, Lee J. Stereospecific High-Affinity TRPV1 Antagonists: Chiral N-(2-Benzyl-3-Pivaloyloxypropyl) 2-[4-(Methylsulfonylamino) Phenyl] Propionamide Analogues. J Med Chem. 2007;51:57–67. doi: 10.1021/jm701049p. [DOI] [PubMed] [Google Scholar]
- 2.Winter Z, Buhala A, Ötvös F, Jósvay K, Vizler C, Dombi G, Szakonyi G, Oláh Z. Functionally Important Amino Acid Residues in the Transient Receptor Potential Vanilloid 1 (TRPV1) Ion Channel–an Overview of the Current Mutational Data. Mol Pain. 2013;9:30. doi: 10.1186/1744-8069-9-30. [DOI] [PMC free article] [PubMed] [Google Scholar]
- 3.Venkatachalam K, Montell C. TRP Channels. Annu Rev Biochem. 2007;76:387–417. doi: 10.1146/annurev.biochem.75.103004.142819. [DOI] [PMC free article] [PubMed] [Google Scholar]
- 4.O’Neill J, Brock C, Olesen AE, Andresen T, Nilsson M, Dickenson AH. Unravelling the Mystery of Capsaicin: a Tool to Understand and Treat Pain. Pharmacol Rev. 2012;64:939–971. doi: 10.1124/pr.112.006163. [DOI] [PMC free article] [PubMed] [Google Scholar]
- 5.Cao E, Liao M, Cheng Y, Julius D. TRPV1 Structures in Distinct Conformations Reveal Activation Mechanisms. Nature. 2013;504:113–118. doi: 10.1038/nature12823. [DOI] [PMC free article] [PubMed] [Google Scholar]
- 6.Liao M, Cao E, Julius D, Cheng Y. Structure of the TRPV1 Ion Channel Determined by Electron Cryo-Microscopy. Nature. 2013;504:107–112. doi: 10.1038/nature12822. [DOI] [PMC free article] [PubMed] [Google Scholar]
- 7.Chou MZ, Mtui T, Gao Y-D, Kohler M, Middleton RE. Resiniferatoxin Binds to the Capsaicin Receptor (TRPV1) near the Extracellular Side of the S4 Transmembrane Domain. Biochemistry. 2004;43:2501–2511. doi: 10.1021/bi035981h. [DOI] [PubMed] [Google Scholar]
- 8.Immke DC, Gavva NR. The TRPV1 Receptor and Nociception. Semin Cell Dev Biol. 2006;17:582–591. doi: 10.1016/j.semcdb.2006.09.004. [DOI] [PubMed] [Google Scholar]
- 9.Thomas KC, Ethirajan M, Shahrokh K, Sun H, Lee J, Cheatham TE, Yost GS, Reilly CA. Structure-Activity Relationship of Capsaicin Analogs and Transient Receptor Potential Vanilloid 1-Mediated Human Lung Epithelial Cell Toxicity. J Pharmacol Exp Ther. 2011;337:400–410. doi: 10.1124/jpet.110.178491. [DOI] [PMC free article] [PubMed] [Google Scholar]
- 10.Basbaum AI, Bautista DM, Scherrer G, Julius D. Cellular and Molecular Mechanisms of Pain. Cell. 2009;139:267–284. doi: 10.1016/j.cell.2009.09.028. [DOI] [PMC free article] [PubMed] [Google Scholar]
- 11.Jordt S-E, Tominaga M, Julius D. Acid Potentiation of the Capsaicin Receptor Determined by a Key Extracellular Site. Proc Natl Acad Sci USA. 2000;97:8134–8139. doi: 10.1073/pnas.100129497. [DOI] [PMC free article] [PubMed] [Google Scholar]
- 12.Gavva NR, Klionsky L, Qu Y, Shi L, Tamir R, Edenson S, Zhang T, Viswanadhan VN, Toth A, Pearce LV, Vanderah TW, Porreca F, Blumberg PM, Lile J, Sun Y, Wild K, Louis JC, Treanor JJ. Molecular Determinants of Vanilloid Sensitivity in TRPV1. J Biol Chem. 2004;279:20283–20295. doi: 10.1074/jbc.M312577200. [DOI] [PubMed] [Google Scholar]
- 13.Phillips E, Reeve A, Bevan S, McIntyre P. Identification of Species-Specific Determinants of the Action of the Antagonist Capsazepine and the Agonist PPAHV on TRPV1. J Biol Chem. 2004;279:17165–17172. doi: 10.1074/jbc.M313328200. [DOI] [PubMed] [Google Scholar]
- 14.Jiang Y, Lee A, Chen J, Ruta V, Cadene M, Chait BT, MacKinnon R. X-Ray Structure of a Voltage-Dependent K+ Channel. Nature. 2003;423:33–41. doi: 10.1038/nature01580. [DOI] [PubMed] [Google Scholar]
- 15.Wang Z, Sun L, Yu H, Zhang Y, Gong W, Jin H, Zhang L, Liang H. Binding Mode Prediction of Evodiamine within Vanilloid Receptor TRPV1. Int J Mol Sci. 2012;13:8958–8969. doi: 10.3390/ijms13078958. [DOI] [PMC free article] [PubMed] [Google Scholar]
- 16.Long SB, Tao X, Campbell EB, MacKinnon R. Atomic Structure of a Voltage-Dependent K+ Channel in a Lipid Membrane-Like Environment. Nature. 2007;450:376–382. doi: 10.1038/nature06265. [DOI] [PubMed] [Google Scholar]
- 17.Gaulton A, Bellis LJ, Bento AP, Chambers J, Davies M, Hersey A, Light Y, McGlinchey S, Michalovich D, Al-Lazikani B, Overington JP. ChEMBL: A Large-Scale Bioactivity Database for Drug Discovery. Nucleic Acids Res. 2012;40:D1100–D1107. doi: 10.1093/nar/gkr777. [DOI] [PMC free article] [PubMed] [Google Scholar]
- 18.Chizh BA, O’Donnell MB, Napolitano A, Wang J, Brooke AC, Aylott MC, Bullman JN, Gray EJ, Lai RY, Williams PM, Appleby JM. The Effects of the TRPV1 Antagonist SB-705498 on TRPV1 Receptor-Mediated Activity and Inflammatory Hyperalgesia in Humans. Pain. 2007;132:132–141. doi: 10.1016/j.pain.2007.06.006. [DOI] [PubMed] [Google Scholar]
- 19.Gomtsyan A, Bayburt EK, Schmidt RG, Surowy CS, Honore P, Marsh KC, Hannick SM, McDonald HA, Wetter JM, Sullivan JP, Jarvis MF, Faltynek CR, Lee CH. Identification of (R)-1-(5-Tert-Butyl-2,3-Dihydro-1H-Inden-1-yl)-3-(1H-Indazol-4-yl) Urea (ABT-102) as a Potent TRPV1 Antagonist for Pain Management. J Med Chem. 2008;51:392–395. doi: 10.1021/jm701007g. [DOI] [PubMed] [Google Scholar]
- 20.Gavva NR, Tamir R, Qu Y, Klionsky L, Zhang T, Immke D, Wang J, Zhu D, Vanderah TW, Porreca F, Doherty EM, Norman MH, Wild KD, Bannon AW, Louis JC, Treanor JJ. AMG 9810 [(E)-3-(4-t-Butylphenyl)-N-(2, 3-Dihydrobenzo [b][1, 4]dioxin-6-yl) Acrylamide], a Novel Vanilloid Receptor 1 (TRPV1) Antagonist with Antihyperalgesic Properties. J Pharmacol Exp Ther. 2005;313:474–484. doi: 10.1124/jpet.104.079855. [DOI] [PubMed] [Google Scholar]
- 21.Kim MS, Ki Y, Ahn SY, Yoon S, Kim S-E, Park H-G, Sun W, Son K, Cui M, Choi S, Pearce LV, Esch TE, DeAndrea-Lazarus IA, Blumberg PM, Lee J. Asymmetric Synthesis and Receptor Activity of Chiral Simplified Resiniferatoxin (sRTX) Analogues as Transient Receptor Potential Vanilloid 1 (TRPV1) Ligands. Bioorg Med Chem Lett. 2014;24:382–385. doi: 10.1016/j.bmcl.2013.10.064. [DOI] [PMC free article] [PubMed] [Google Scholar]
- 22.Kim MS, Ryu H, Kang DW, Cho S-H, Seo S, Park YS, Kim M-Y, Kwak EJ, Kim YS, Bhondwe RS, Kim HS, Park SG, Son K, Choi S, DeAndrea-Lazarus IA, Pearce LV, Blumberg PM, Frank R, Bahrenberg G, Stockhausen H, Kogel BY, Schiene K, Christoph T, Lee J. 2-(3-Fluoro-4-Methylsulfonylaminophenyl) Propanamides as Potent Transient Receptor Potential Vanilloid 1 (TRPV1) Antagonists: Structure–Activity Relationships of 2-Amino Derivatives in the N-(6-Trifluoromethylpyridin-3-ylmethyl) C-Region. J Med Chem. 2012;55:8392–8408. doi: 10.1021/jm300780p. [DOI] [PMC free article] [PubMed] [Google Scholar]
- 23.Lee JH, Lee Y, Ryu H, Kang DW, Lee J, Lazar J, Pearce LV, Pavlyukovets VA, Blumberg PM, Choi S. Structural Insights into Transient Receptor Potential Vanilloid Type 1 (TRPV1) from Homology Modeling, Flexible Docking, and Mutational Studies. J Comput-Aided Mol Des. 2011;25:317–327. doi: 10.1007/s10822-011-9421-5. [DOI] [PMC free article] [PubMed] [Google Scholar]
- 24.Pearce LV, Toth A, Ryu H, Kang DW, Choi H-K, Jin M-K, Lee J, Blumberg PM. Differential Modulation of Agonist and Antagonist Structure Activity Relations for Rat TRPV1 by Cyclosporin A and Other Protein Phosphatase Inhibitors. Naunyn-Schmiedeberg’s Arch. Pharmacol. 2008;377:149–157. doi: 10.1007/s00210-007-0258-3. [DOI] [PMC free article] [PubMed] [Google Scholar]
- 25.SYBYL-X 1.3. Tripos International; 1699 South Hanley Rd., St. Louis, Missouri, 63144, USA: 2010. [Google Scholar]
- 26.Xie XQ, Chen JZ, Billings EM. 3D Structural Model of the G-Protein-Coupled Cannabinoid CB2 Receptor. Proteins. 2003;53:307–319. doi: 10.1002/prot.10511. [DOI] [PubMed] [Google Scholar]
- 27.Martí-Renom MA, Stuart AC, Fiser A, Sánchez R, Melo F, Šali A. Comparative Protein Structure Modeling of Genes and Genomes. Annu Rev Biophys Biomol Struct. 2000;29:291–325. doi: 10.1146/annurev.biophys.29.1.291. [DOI] [PubMed] [Google Scholar]
- 28.Feng Z, Alqarni MH, Yang P, Tong Q, Chowdhury A, Wang L, Xie X-Q. Modeling, Molecular Dynamics Simulation and Mutation Validation for Structure of Cannabinoid Receptor 2 Based on Known Crystal Structures of GPCRs. J Chem Inf Model. 2014;54:2483–2499. doi: 10.1021/ci5002718. [DOI] [PMC free article] [PubMed] [Google Scholar]
- 29.Wiederstein M, Sippl MJ. ProSA-Web: Interactive Web Service for the Recognition of Errors in Three-Dimensional Structures of Proteins. Nucleic Acids Res. 2007;35:W407–W410. doi: 10.1093/nar/gkm290. [DOI] [PMC free article] [PubMed] [Google Scholar]
- 30.Laskowski RA, MacArthur MW, Moss DS, Thornton JM. PROCHECK: a Program to Check the Stereochemical Quality of Protein Structures. J Appl Crystallogr. 1993;26:283–291. [Google Scholar]
- 31.Lovell SC, Davis IW, Arendall WB, de Bakker PI, Word JM, Prisant MG, Richardson JS, Richardson DC. Structure Validation by Cα Geometry: ϕ, ψ and Cβ Deviation. Proteins. 2003;50:437–450. doi: 10.1002/prot.10286. [DOI] [PubMed] [Google Scholar]
- 32.Wetzel S, Klein K, Renner S, Rauh D, Oprea TI, Mutzel P, Waldmann H. Interactive Exploration of Chemical Space with Scaffold Hunter. Nat Chem Biol. 2009;5:581–583. doi: 10.1038/nchembio.187. [DOI] [PubMed] [Google Scholar]
- 33.Lewell XQ, Judd DB, Watson SP, Hann MM. RECAP Retrosynthetic Combinatorial Analysis Procedure: A Powerful New Technique for Identifying Privileged Molecular Fragments with Useful Applications in Combinatorial Chemistry. J Chem Inf Comput Sci. 1998;38:511–522. doi: 10.1021/ci970429i. [DOI] [PubMed] [Google Scholar]
- 34.Jain AN. Scoring Noncovalent Protein-Ligand Interactions: a Continuous Differentiable Function Tuned to Compute Binding Affinities. J Comput-Aided Mol Des. 1996;10:427–440. doi: 10.1007/BF00124474. [DOI] [PubMed] [Google Scholar]
- 35.Chen J-Z, Wang J, Xie X-Q. GPCR Structure-Based Virtual Screening Approach for CB2 Antagonist Search. J Chem Inf Model. 2007;47:1626–1637. doi: 10.1021/ci7000814. [DOI] [PubMed] [Google Scholar]
- 36.Pedretti A, Villa L, Vistoli G. VEGA: a Versatile Program to Convert, Handle and Visualize Molecular Structure on Windows-Based PCs. J Mol Graphics Modell. 2002;21:47–49. doi: 10.1016/s1093-3263(02)00123-7. [DOI] [PubMed] [Google Scholar]
- 37.Søndergaard CR, Olsson MH, Rostkowski M, Jensen JH. Improved Treatment of Ligands and Coupling Effects in Empirical Calculation and Rationalization of pKa Values. J Chem Theory Comput. 2011;7:2284–2295. doi: 10.1021/ct200133y. [DOI] [PubMed] [Google Scholar]
- 38.Hsin J, Arkhipov A, Yin Y, Stone JE, Schulten K. Using VMD: an Introductory Tutorial. Curr Protoc Bioinf. 2008;24:5.7. 1–5.7. 48. doi: 10.1002/0471250953.bi0507s24. [DOI] [PMC free article] [PubMed] [Google Scholar]
- 39.Jorgensen WL, Chandrasekhar J, Madura JD, Impey RW, Klein ML. Comparison of Simple Potential Functions for Simulating Liquid Water. J Chem Phys. 1983;79:926. [Google Scholar]
- 40.Kalé L, Skeel R, Bhandarkar M, Brunner R, Gursoy A, Krawetz N, Phillips J, Shinozaki A, Varadarajan K, Schulten K. NAMD2: Greater Scalability for Parallel Molecular Dynamics. J Comput Phys. 1999;151:283–312. [Google Scholar]
- 41.Brooks BR, Bruccoleri RE, Olafson BD. CHARMM: A Program for Macromolecular Energy, Minimization, and Dynamics Calculations. J Comput Chem. 1983;4:187–217. [Google Scholar]
- 42.MacKerell AD, Bashford D, Bellott M, Dunbrack RL, Evanseck JD, Field MJ, Fischer S, Gao J, Guo H, Ha S, Joseph-McCarthy D, Kuchnir L, Kuczera K, Lau FT, Mattos C, Michnick S, Ngo T, Nguyen DT, Prodhom B, Reiher WE, Roux B, Schlenkrich M, Smith JC, Stote R, Straub J, Watanabe M, Wiorkeiwicz-Kuczera J, Yin D, Karplus M. All-atom Empirical Potential for Molecular Modeling and Dynamics Studies of Proteins. J Phys Chem B. 1998;102:3586–3616. doi: 10.1021/jp973084f. [DOI] [PubMed] [Google Scholar]
- 43.Essmann U, Perera L, Berkowitz ML, Darden T, Lee H, Pedersen LG. A Smooth Particle Mesh Ewald Method. J Chem Phys. 1995;103:8577–8593. [Google Scholar]
- 44.Feng Z, Hou T, Li Y. Studies on the Interactions between β2 Adrenergic Receptor and Gs Protein by Molecular Dynamics Simulations. J Chem Inf Model. 2012;52:1005–1014. doi: 10.1021/ci200594d. [DOI] [PubMed] [Google Scholar]
- 45.van Veghel D, Cleynhens J, Pearce LV, Blumberg PM, Van Laere K, Verbruggen A, Bormans G. Synthesis and Biological Evaluation of [11C] SB366791: A New PET-Radioligand for in vivo Imaging of the TRPV1 Receptor. Nucl Med Biol. 2013;40:141–147. doi: 10.1016/j.nucmedbio.2012.08.011. [DOI] [PMC free article] [PubMed] [Google Scholar]
- 46.Xu F, Wu H, Katritch V, Han GW, Jacobson KA, Gao Z-G, Cherezov V, Stevens RC. Structure of an Agonist-Bound Human A2A Adenosine Receptor. Science. 2011;332:322–327. doi: 10.1126/science.1202793. [DOI] [PMC free article] [PubMed] [Google Scholar]
- 47.Rasmussen SG, DeVree BT, Zou Y, Kruse AC, Chung KY, Kobilka TS, Thian FS, Chae PS, Pardon E, Calinski D, Mathiesen JM, Shah ST, Lyons JA, Caffrey M, Gellman SH, Steyaert J, Skiniotis G, Weis WI, Sunahara RK, Kobilka BK. Crystal Structure of the β2 Adrenergic Receptor-Gs Protein Complex. Nature. 2011;477:549–555. doi: 10.1038/nature10361. [DOI] [PMC free article] [PubMed] [Google Scholar]
- 48.Thorat SA, Kang DW, Ryu H, Kim MS, Kim HS, Ann J, Ha T, Kim S-E, Son K, Choi S, Blumberg PM, Frank R, Bahrenberg G, Schiene K, Christoph T, Lee J. 2-(3-Fluoro-4-Methylsulfonylaminophenyl) Propanamides as Potent TRPV1 Antagonists: Structure Activity Relationships of the 2-oxy Pyridine C-Region. Eur J Med Chem. 2013;64:589–602. doi: 10.1016/j.ejmech.2013.04.003. [DOI] [PMC free article] [PubMed] [Google Scholar]
- 49.Garate J-A, English NJ, MacElroy J. Human Squaporin 4 Gating Dynamics in DC and AC Electric Fields: a Molecular Dynamics Study. J Chem Phys. 2011;134:055110. doi: 10.1063/1.3529428. [DOI] [PubMed] [Google Scholar]
- 50.Zhu F, Tajkhorshid E, Schulten K. Pressure-Induced Water Transport in Membrane Channels Studied by Molecular Dynamics. Biophys J. 2002;83:154–160. doi: 10.1016/S0006-3495(02)75157-6. [DOI] [PMC free article] [PubMed] [Google Scholar]
- 51.Xin L, Su H, Nielsen CH, Tang C, Torres J, Mu Y. Water Permeation Dynamics of AqpZ: A Tale of Two States. BBA, Biochim Biophys Acta, Biomembr. 2011;1808:1581–1586. doi: 10.1016/j.bbamem.2011.02.001. [DOI] [PubMed] [Google Scholar]
- 52.Feng Z, Hou T, Li Y. Concerted Movement in pH-Dependent Gating of FocA from Molecular Dynamics Simulations. J Chem Inf Model. 2012;52:2119–2131. doi: 10.1021/ci300250q. [DOI] [PubMed] [Google Scholar]
- 53.Smart OS, Neduvelil JG, Wang X, Wallace B, Sansom MS. HOLE: a Program for the Analysis of the Pore Dimensions of Ion Channel Structural Models. J Mol Graphics Modell. 1996;14:354–360. doi: 10.1016/s0263-7855(97)00009-x. [DOI] [PubMed] [Google Scholar]
- 54.Woo DH, Jung SJ, Zhu MH, Park C-K, Kim YH, Oh SB, Lee CJ. Direct Activation of Transient Receptor Potential Vanilloid 1 (TRPV1) by Diacylglycerol (DAG) Mol Pain. 2008;4:42–56. doi: 10.1186/1744-8069-4-42. [DOI] [PMC free article] [PubMed] [Google Scholar]
- 55.Zygmunt PM, Petersson J, Andersson DA, Chuang H-h, Sørgård M, Di Marzo V, Julius D, Högestatt ED. Vanilloid Receptors on Sensory Nerves Mediate the Vasodilator Action of Anandamide. Nature. 1999;400:452–457. doi: 10.1038/22761. [DOI] [PubMed] [Google Scholar]
Associated Data
This section collects any data citations, data availability statements, or supplementary materials included in this article.