

Abstract
Telocytes (TCs) are described as a particular type of cells of the interstitial space (www.telocytes.com). Their main characteristics are the very long telopodes with alternating podoms and podomers. Recently, we performed a comparative proteomic analysis of human lung TCs with fibroblasts, demonstrating that TCs are clearly a distinct cell type. Therefore, the present study aims to reinforce this idea by comparing lung TCs with endothelial cells (ECs), since TCs and ECs share immunopositivity for CD34. We applied isobaric tag for relative and absolute quantification (iTRAQ) combined with automated 2-D nano-ESI LC-MS/MS to analyse proteins extracted from TCs and ECs in primary cell cultures. In total, 1609 proteins were identified in cell cultures. 98 proteins (the 5th day), and 82 proteins (10th day) were confidently quantified (screened by two-sample t-test, P < 0.05) as up- or down-regulated (fold change >2). We found that in TCs there are 38 up-regulated proteins at the 5th day and 26 up-regulated proteins at the 10th day. Bioinformatics analysis using Panther revealed that the 38 proteins associated with TCs represented cellular functions such as intercellular communication (via vesicle mediated transport) and structure morphogenesis, being mainly cytoskeletal proteins and oxidoreductases. In addition, we found 60 up-regulated proteins in ECs e.g.: cell surface glycoprotein MUC18 (15.54-fold) and von Willebrand factor (5.74-fold). The 26 up-regulated proteins in TCs at 10th day, were also analysed and confirmed the same major cellular functions, while the 56 down-regulated proteins confirmed again their specificity for ECs. In conclusion, we report here the first extensive comparison of proteins from TCs and ECs using a quantitative proteomics approach. Our data show that TCs are completely different from ECs. Protein expression profile showed that TCs play specific roles in intercellular communication and intercellular signalling. Moreover, they might inhibit the oxidative stress and cellular ageing and may have pro-proliferative effects through the inhibition of apoptosis. The group of proteins identified in this study needs to be explored further for the role in pathogenesis of lung disease.
Keywords: telocytes, microvascular endothelial cells, proteomics, iTRAQ, LC-MS/MS, lung, intercellular signalling
Introduction
Telocytes (TCs) were identified as a new cell type of the stromal space [1] (details at www.telocytes.com). TCs were described in the trachea and lungs [2–5], besides other important locations: heart [6–9], female reproductive system [10–13], skin [14,15], digestive system [16–19], liver [20], urinary tract [21,22], prostate [23,24], skeletal muscle and neuromuscular spindles [25,26], eye [27], etc. Ultrastructurally, TCs are defined and easily to distinguish by their extremely long telopodes (tens up to hundreds of micrometres), an alternation of podoms and podomeres.
Recently, electrophysiological properties were described for TCs [28–30], their microarray-based gene expression analysis and microRNA signature were established [31,32] and some of their genomic features were revealed [33]. In a previous study, we reported the proteomic profile differences between TCs and fibroblasts [34].
Since their description, it became clear that TCs develop a 3D network through the organ interstitial space and are frequently detected in close relationships with organ-specific structures, blood capillaries, nerve endings and even with stem cells niches and immune cells [11,16,29]. Numerous studies have described the unusual immunophenotype of the TCs providing a list of molecular markers such as CD34, PDGFR α and β, CD117 [20,25,35–37]. Some of these markers are also expressed on endothelial cells (low level of CD34) and on pericytes (PDGFR α and β). However ECs co-express CD31 and pericytes co-express α-SMA, while TCs do not [25]. These similarities might be suggestive for a common mesodermal pre-cursor for TCs, ECs and for a perivascular origin of mesenchymal stem cells (for reviews see 38–42).
It is largely accepted that ECs in culture are subjected to phenotypic drift because of the lack of in vivo typical conditions [43], mainly oxygen exposure which is higher in vitro. These aspects together with the fact that proteomic studies also point out the differences between venous and arterial ECs [44] should lead us to the idea that in vitro culture studies should be viewed with circumspection without out-looking in vivo physiological influences. A study by Nguyen et al., regarding differential proteomic analysis of lymphatic, venous and arterial endothelial cells extracted from bovine mesenteric vessels underline the lack of substantial overlap between results from different research groups [45].
The present study shows the proteomic analysis of the TCs, by comparing them with ECs using iTRAQ labelling to identify the differentially expressed proteins. We think that the identification of a panel of 98 proteins at 5th day, and 82 proteins at 10th day in cell cultures, may represent the most differentially expressed proteins between TCs and ECs. We found that 38 proteins were overexpressed in TCs compared to ECs (at 5th day) and that 26 proteins were overexpressed in TCs compared to ECs (at 10th day). Bioinformatics analysis of the up-regulated proteins came again to confirm the involvement of TCs in intercellular communication, oxidative stress and cellular ageing. Also, TCs may have pro-proliferative effects through the inhibition of apoptosis.
Material and methods
Cell lines and tissue sampling
Human lung samples were obtained from the patients undergoing surgery for lung cancer. Lung fragments were removed from normal tissue area located at least at 15 cm from the tumour tissue. All tissue samples were obtained in accordance with a protocol approved by the Ethical Evaluation Committee of Zhongshan Hospital, Fudan University, Shanghai, China. Samples were processed within 30 min. from surgery. Cells were cultured using the protocol previously described [34]. Human pulmonary microvascular endothelial cell line was obtained from ScienCell Research Laboratories (Cat. no. 3000; Carlsbad, CA, USA).
Cell culture and lysis
Cells from primary culture were used for the experiments. Cells (1 × 10⁵) were placed in 10-cm dishes with 10 ml high glucose DMEM (Gibco, Grand Island, NY, USA) complete medium, including 10% foetal calf serum (Gibco, Grand Island, NY, USA), 100 UI/ml penicillin and 0.1 mg/ml streptomycin (Sigma Chemical, St. Louis, MO, USA) in a humidified atmosphere of 5% CO2 at 370°C. Confluent cells were trypsinized at day 5 and day 10 respectively. Approximately 106 cells from day 5 or day 10 were re-suspended in a solution of 9.5 moles/l urea, 1% dithiothreitol, 40 mg/ml protease inhibitor cocktail, 0.2 mmoles/l Na2VO3 and 1 mmole/l NaF. The mixture was incubated and stirred by end-over-end rotation at 4°C for 60 min. The resultant suspension was centrifuged at 40,000 × g for 1 hr at 15°C. The supernatant was stored in small aliquots at −80°C, and the protein concentration was determined using a modified Bradford method.
Automated 2-D nano-ESI LC-MS/MS analysis of peptides
Proteins extracted from primary cultures of TCs and EC were analysed by automated 2-dimensional nano-electrospray ionization liquid chromatography tandem mass spectrometry as was previously described [46,47].
Sample preparation
The samples were ground in liquid nitrogen. One millilitre of lysis buffer (8 M urea, 1× Protease Inhibitor Cocktail (Roche Ltd. Basel, Switzerland)) was added to sample, followed by sonication on ice and centrifugation at 29,000 × g for 10 min. at 4°C. The supernatant was transferred to a fresh tube, and stored at −80°C until needed.
iTRAQ labelling and protein digestion
For each sample, proteins were precipitated with ice-cold acetone, and then were redissolved in the dissolution buffer (0.5 M triethylammonium bicarbonate, 0.1% SDS). Then proteins were quantified by BCA protein assay, and 100 μg of protein was tryptically digested and the resultant peptide mixture was labelled using chemicals from the iTRAQ reagent kit (Applied Biosystems, Foster City, CA, USA). Disulphide bonds were reduced in 5 mM Tris-(2-carboxyethy) phosphine for 1 hr at 60°C, followed by blocking cysteine residues in 10 mM methyl methanethiosulfonate for 30 min. at room temperature, before digestion with sequence-grade modified trypsin (Promega, Madison, WI, USA). For labelling, each iTRAQ reagent was dissolved in 50 μl of isopropanol and added to the respective peptide mixture.
Proteins were labelled with the iTRAQ tags as follows: Pulmonary microvascular endothelial cells (5 days) - 113 isobaric tag, TCs (5 days) - 116 isobaric tag, Pulmonary microvascular endothelial cells (10 days) - 117 isobaric tag, TCs (10 days) - 121 isobaric tag. The labelled samples were combined and dried in vacuo. A SepPac™ C18 cartridge (1 cm3/50 mg; Waters Corporation, Milford, MA, USA) was used to remove the salt buffer and then was dried in a vacuum concentrator for the next step.
High pH reverse phase separation
Using a described protocol [48], the peptide mixture was redissolved in the buffer A (buffer A: 20 mM ammonium formate in water, pH 10.0, adjusted with ammonium hydroxide), and then fractionated by high pH separation using a Aquity UPLC system (Waters Corporation) connected to a reverse phase column (XBridge C18 column, 2.1 mm × 150 mm, 3.5 μm, 300 Å; Waters Corporation). High pH separation was performed with a linear gradient. Starting from 2% B to 40% B in 45 min. (B: 20 mM ammonium formate in 90% ACN, pH 10.0, adjusted with ammonium hydroxide). The column was re-equilibrated at initial conditions for 15 min. The column flow rate was maintained at 200 μl/min. and column temperature was maintained at room temperature. Fourteen fractions were collected, and each fraction was dried in a vacuum concentrator for the next step.
Low pH nano-HPLC-MS/MS analysis
The peptides were re-suspended with 80 μl solvent C (C: water with 0.1% formic acid; D: ACN with 0.1% formic acid), separated by nanoLC and analysed by on-line electrospray tandem mass spectrometry. The experiments were performed on a Nano Aquity UPLC system (Waters Corporation) connected to an LTQ Orbitrap XL mass spectrometer (Thermo Electron Corp., Bremen, Germany) equipped with an online nanoelectrospray ion source (Michrom Bioresources, Auburn, CA, USA). 20 μl peptide sample was loaded onto the Thermo Scientific Acclaim PepMap C18 column (100 μm × 2 cm, 3 μm particle size), with a flow of 10 μl/min. for 5 min. and subsequently separated on the analytical column (Acclaim PepMap C18, 75 μm × 15 cm) with a linear gradient, from 5% D to 45% D in 165 min. The column was re-equilibrated at initial conditions for 15 min. The column flow rate was maintained at 300 nl/min. and column temperature was maintained at 35°C. The electrospray voltage of 1.9 kV versus the inlet of the mass spectrometer was used.
LTQ Orbitrap XL mass spectrometer was operated after a protocol previously described [34].
Database searching and criteria
Protein identification and quantification for the iTRAQ experiment was performed with the ProteinPilot software version 4.0 (Applied Biosystems). The database was the Human UniProtKB/Swiss-Prot database (Release 2011_10_15, with 20248 sequences). The Paragon Algorithm in ProteinPilot software was used for peptide identification and isoform specific quantification. The detailed method of ProteinPilot analysis was described previously [34]. For iTRAQ quantification, the peptide for quantification was automatically selected by Pro Group algorithm (at least two peptides with 99% confidence) to calculate the reporter peak area, error factor and P-value. For the selection of differentially expressed proteins, we considered the following situation: (1) the proteins must contain at least two unique high-scoring peptides; (2) the proteins must have a P < 0.05, and the proteins identified with mass tag changes ratio must be ≥1.3 or ≤0.75. Differentially expressed proteins were screened by two-sample t-test (P < 0.05) and fold change (>2), based on the bioinformatics analysis.
The biological interpretation of the results was aided by PANTHER (Protein ANalysis THrough Evolutionary Relationships) Classification System annotations (http://www.pantherdb.org/).
Heat maps were created after MS/MS fragmentation spectra were analysed using PEAKS search engine tool (PEAKS Studio 7; Bioinformatics Solutions Inc., Waterloo, ON, Canada).
We also used the Search Tool for the Retrieval of Interacting Genes/Proteins (STRING) (http://www.string-db.org/) database of physical and functional interactions to evaluate the interactions among the up-regulated proteins of the TCs and ECs. Bonferroni correction was used as a conservative method to control the family wise error rate when highlighting proteins involved in different biological processes.
Results
Quantitative proteomics has been used to evaluate the differentially expressed proteins in TCs and ECs. We compared the protein expression profiles between those two cell types, at different moments in time (5th day and 10th day in cell culture). In particular, we identified a total of 1609 proteins of which 98 satisfied our filtering criteria of proteins that exhibited fold changes ≥2 in TCs versus ECs at day 5 (Table1), and 82 proteins in TCs versus ECs at day 10 (Table2), respectively.
Table 1.
Selected list of top 98 proteins identified with more than twofold change in TCs versus ECs at 5th day sorted by iTRAQ ratio and presenting the number of peptides hits
| Accession | Protein name | Peptides (95%) | %Cov (95) | iTRAQ ratio ECs:TCs | Fold enrichment in TCs | P |
|---|---|---|---|---|---|---|
| MYH14_HUMAN | Myosin-14 | 18 | 7.67 | 0.053 | 18.84 | 0.0002 |
| SODM_HUMAN | Superoxide dismutase [Mn], mitochondrial | 10 | 35.14 | 0.069 | 14.59 | 0.0002 |
| ASAH1_HUMAN | Acid ceramidase | 2 | 5.82 | 0.131 | 7.63 | 0.0315 |
| EVPL_HUMAN | Envoplakin | 1 | 0.79 | 0.161 | 6.22 | 0.0346 |
| EPIPL_HUMAN | Epiplakin | 17 | 16.07 | 0.167 | 5.99 | 0.0250 |
| HBB_HUMAN | Haemoglobin subunit beta | 2 | 15.65 | 0.219 | 4.56 | 0.0466 |
| HBA_HUMAN | Haemoglobin subunit alpha | 2 | 16.90 | 0.244 | 4.09 | 0.0055 |
| THIM_HUMAN | 3-ketoacyl-CoA thiolase, mitochondrial | 12 | 33.50 | 0.245 | 4.08 | 0.0186 |
| SQRD_HUMAN | Sulphide:quinone oxidoreductase, mitochondrial | 9 | 19.78 | 0.245 | 4.08 | 0.0015 |
| LMO7_HUMAN | LIM domain only protein 7 | 3 | 2.02 | 0.246 | 4.06 | 0.0246 |
| FRIL_HUMAN | Ferritin light chain | 1 | 8.57 | 0.252 | 3.97 | 0.0178 |
| ALDH2_HUMAN | Aldehyde dehydrogenase, mitochondrial | 5 | 10.06 | 0.253 | 3.96 | 0.0152 |
| TAGL_HUMAN | Transgelin | 15 | 75.12 | 0.258 | 3.88 | 0.0058 |
| ACADV_HUMAN | Very long-chain specific acyl-CoA dehydrogenase, mitochondrial | 6 | 9.62 | 0.301 | 3.33 | 0.0325 |
| TPSN_HUMAN | Tapasin | 3 | 5.13 | 0.318 | 3.14 | 0.0292 |
| PGRC1_HUMAN | Membrane-associated progesterone receptor component 1 | 4 | 18.97 | 0.328 | 3.04 | 0.0068 |
| SUCA_HUMAN | Succinyl-CoA ligase [GDP-forming] subunit alpha, mitochondrial | 5 | 17.63 | 0.344 | 2.90 | 0.0018 |
| ICAM1_HUMAN | Intercellular adhesion molecule 1 | 6 | 14.66 | 0.374 | 2.67 | 0.0021 |
| TFR1_HUMAN | Transferrin receptor protein 1 | 5 | 5.79 | 0.378 | 2.65 | 0.0073 |
| NLTP_HUMAN | Non-specific lipid-transfer protein | 9 | 12.43 | 0.390 | 2.57 | 0.0013 |
| CO1A1_HUMAN | Collagen alpha-1(I) chain | 4 | 3.01 | 0.407 | 2.46 | 0.0290 |
| AT1A1_HUMAN | Sodium/potassium-transporting ATPase subunit alpha-1 | 17 | 18.77 | 0.412 | 2.43 | 0.0000 |
| COX5B_HUMAN | Cytochrome c oxidase subunit 5B, mitochondrial | 4 | 34.11 | 0.438 | 2.28 | 0.0042 |
| DHB4_HUMAN | Peroxisomal multifunctional enzyme type 2 | 11 | 25.00 | 0.442 | 2.26 | 0.0000 |
| MYH10_HUMAN | Myosin-10 | 45 | 19.59 | 0.445 | 2.25 | 0.0240 |
| KAD3_HUMAN | GTP:AMP phosphotransferase, mitochondrial | 2 | 10.57 | 0.451 | 2.22 | 0.0107 |
| CO4A_HUMAN | Complement C4-A | 4 | 2.52 | 0.460 | 2.17 | 0.0215 |
| COX5A_HUMAN | Cytochrome c oxidase subunit 5A, mitochondrial | 6 | 58.67 | 0.470 | 2.13 | 0.0015 |
| DLDH_HUMAN | Dihydrolipoyl dehydrogenase, mitochondrial | 10 | 27.50 | 0.472 | 2.12 | 0.0047 |
| ALBU_HUMAN | Serum albumin | 11 | 14.45 | 0.473 | 2.11 | 0.0098 |
| A2MG_HUMAN | Alpha-2-macroglobulin | 7 | 4.34 | 0.476 | 2.10 | 0.0268 |
| ETHE1_HUMAN | Protein ETHE1, mitochondrial | 2 | 9.45 | 0.480 | 2.08 | 0.0370 |
| KAD2_HUMAN | Adenylate kinase 2, mitochondrial | 8 | 41.42 | 0.487 | 2.05 | 0.0004 |
| ERGI1_HUMAN | Endoplasmic reticulum-Golgi intermediate compartment protein 1 | 4 | 18.97 | 0.488 | 2.05 | 0.0258 |
| ERP29_HUMAN | Endoplasmic reticulum resident protein 29 | 7 | 28.74 | 0.490 | 2.04 | 0.0015 |
| GRP75_HUMAN | Stress-70 protein, mitochondrial | 32 | 40.94 | 0.493 | 2.03 | 0.0114 |
| ETFA_HUMAN | Electron transfer flavoprotein subunit alpha, mitochondrial | 10 | 38.44 | 0.494 | 2.02 | 0.0002 |
| CH60_HUMAN | 60 kD heat shock protein, mitochondrial | 60 | 62.30 | 0.496 | 2.02 | 0.0011 |
| Accession | Protein name | Peptides (95%) | %Cov (95) | iTRAQ ratio ECs:TCs | Fold enrichment in ECs | P |
|---|---|---|---|---|---|---|
| PUR6_HUMAN | Multifunctional protein ADE2 | 4 | 6.59 | 2.007 | 2.01 | 0.0375 |
| G6PI_HUMAN | Glucose-6-phosphate isomerase | 4 | 7.35 | 2.019 | 2.02 | 0.0029 |
| RS13_HUMAN | 40S ribosomal protein S13 | 5 | 29.80 | 2.025 | 2.02 | 0.0035 |
| PROF1_HUMAN | Profilin-1 | 23 | 75.71 | 2.026 | 2.03 | 0.0004 |
| TXND5_HUMAN | Thioredoxin domain-containing protein 5 | 15 | 40.51 | 2.030 | 2.03 | 0.0011 |
| LEG1_HUMAN | Galectin-1 | 27 | 91.11 | 2.053 | 2.05 | 0.0001 |
| ARC1B_HUMAN | Actin-related protein 2/3 complex subunit 1B | 2 | 5.11 | 2.056 | 2.06 | 0.0126 |
| AMPN_HUMAN | Aminopeptidase N | 7 | 7.03 | 2.061 | 2.06 | 0.0162 |
| LDHB_HUMAN | L-lactate dehydrogenase B chain | 8 | 23.35 | 2.094 | 2.09 | 0.0021 |
| ACLY_HUMAN | ATP-citrate synthase | 11 | 11.08 | 2.096 | 2.10 | 0.0004 |
| THIO_HUMAN | Thioredoxin | 5 | 51.43 | 2.115 | 2.11 | 0.0022 |
| GDIB_HUMAN | Rab GDP-dissociation inhibitor beta | 5 | 14.83 | 2.118 | 2.12 | 0.0007 |
| EEA1_HUMAN | Early endosome antigen 1 | 4 | 2.62 | 2.140 | 2.14 | 0.0111 |
| TGM2_HUMAN | Protein-glutamine gamma-glutamyltransferase 2 | 18 | 21.25 | 2.145 | 2.15 | 0.0351 |
| RL19_HUMAN | 60S ribosomal protein L19 | 3 | 14.80 | 2.207 | 2.21 | 0.0133 |
| COF1_HUMAN | Cofilin-1 | 21 | 71.69 | 2.210 | 2.21 | 0.0138 |
| FLNB_HUMAN | Filamin-B | 96 | 41.78 | 2.210 | 2.21 | 0.0000 |
| H15_HUMAN | Histone H1.5 | 7 | 23.45 | 2.219 | 2.22 | 0.0186 |
| RAN_HUMAN | GTP-binding nuclear protein Ran | 7 | 32.87 | 2.245 | 2.25 | 0.0117 |
| NQO1_HUMAN NAD(P) | H dehydrogenase [quinone] 1 | 2 | 7.66 | 2.246 | 2.25 | 0.0206 |
| HS90B_HUMAN | Heat shock protein HSP 90-beta | 37 | 35.77 | 2.275 | 2.27 | 0.0006 |
| RCN1_HUMAN | Reticulocalbin-1 | 8 | 22.66 | 2.283 | 2.28 | 0.0093 |
| CDC37_HUMAN | Hsp90 co-chaperone Cdc37 | 10 | 27.25 | 2.306 | 2.31 | 0.0005 |
| G3P_HUMAN | Glyceraldehyde-3-phosphate dehydrogenase | 42 | 64.48 | 2.338 | 2.34 | 0.0045 |
| SH3L3_HUMAN | SH3 domain-binding glutamic acid-rich-like protein 3 | 3 | 34.41 | 2.341 | 2.34 | 0.0160 |
| ITA5_HUMAN | Integrin alpha-5 | 7 | 8.20 | 2.366 | 2.37 | 0.0011 |
| EHD2_HUMAN | EH domain-containing protein 2 | 8 | 17.13 | 2.374 | 2.37 | 0.0009 |
| PPIA_HUMAN | Peptidyl-prolyl cis-trans isomerase A | 17 | 75.76 | 2.383 | 2.38 | 0.0001 |
| MOES_HUMAN | Moesin | 26 | 44.71 | 2.394 | 2.39 | 0.0054 |
| PRDX1_HUMAN | Peroxiredoxin-1 | 14 | 46.73 | 2.419 | 2.42 | 0.0006 |
| UCHL1_HUMAN | Ubiquitin carboxyl-terminal hydrolase isozyme L1 | 7 | 37.22 | 2.486 | 2.49 | 0.0033 |
| TAGL2_HUMAN | Transgelin-2 | 19 | 74.87 | 2.533 | 2.53 | 0.0000 |
| HPRT_HUMAN | Hypoxanthine-guanine phosphoribosyltransferase | 2 | 11.01 | 2.570 | 2.57 | 0.0220 |
| PLST_HUMAN | Plastin-3 | 11 | 19.37 | 2.570 | 2.57 | 0.0000 |
| WDR1_HUMAN | WD repeat-containing protein 1 | 10 | 18.15 | 2.577 | 2.58 | 0.0000 |
| UB2L3_HUMAN | Ubiquitin-conjugating enzyme E2 L3 | 1 | 4.54 | 2.601 | 2.60 | 0.0052 |
| HMGB1_HUMAN | High mobility group protein B1 | 3 | 15.35 | 2.614 | 2.61 | 0.0014 |
| TRXR1_HUMAN | Thioredoxin reductase 1, cytoplasmic | 9 | 16.49 | 2.618 | 2.62 | 0.0001 |
| NSF1C_HUMAN | NSFL1 cofactor p47 | 4 | 19.19 | 2.696 | 2.70 | 0.0192 |
| APEX1_HUMAN | DNA-(apurinic or apyrimidinic site) lyase | 2 | 6.60 | 2.718 | 2.72 | 0.0292 |
| K6PP_HUMAN | 6-phosphofructokinase type C | 5 | 8.29 | 2.741 | 2.74 | 0.0004 |
| HINT1_HUMAN | Histidine triad nucleotide-binding protein 1 | 3 | 40.48 | 2.775 | 2.77 | 0.0244 |
| STIP1_HUMAN | Stress-induced-phosphoprotein 1 | 11 | 19.34 | 2.777 | 2.78 | 0.0000 |
| RL15_HUMAN | 60S ribosomal protein L15 | 2 | 7.84 | 2.792 | 2.79 | 0.0232 |
| S10AD_HUMAN | Protein S100-A13 | 5 | 44.90 | 2.832 | 2.83 | 0.0016 |
| CSRP1_HUMAN | Cysteine and glycine-rich protein 1 | 3 | 21.76 | 2.843 | 2.84 | 0.0280 |
| VAT1_HUMAN | Synaptic vesicle membrane protein VAT-1 homologue | 12 | 31.81 | 2.911 | 2.91 | 0.0012 |
| 6PGD_HUMAN | 6-phosphogluconate dehydrogenase, decarboxylating | 5 | 10.77 | 2.952 | 2.95 | 0.0346 |
| SDPR_HUMAN | Serum deprivation-response protein | 3 | 9.18 | 3.146 | 3.15 | 0.0278 |
| GDIR1_HUMAN | Rho GDP-dissociation inhibitor 1 | 4 | 18.14 | 3.740 | 3.74 | 0.0010 |
| FSCN1_HUMAN | Fascin | 6 | 16.63 | 4.026 | 4.03 | 0.0012 |
| HMGA1_HUMAN | High mobility group protein HMG-I/HMG-Y | 2 | 22.43 | 4.281 | 4.28 | 0.0031 |
| PECA1_HUMAN | Platelet endothelial cell adhesion molecule | 9 | 11.52 | 4.492 | 4.49 | 0.0131 |
| SCRN1_HUMAN | Secernin-1 | 2 | 5.80 | 4.937 | 4.94 | 0.0203 |
| VWF_HUMAN | von Willebrand factor | 19 | 7.93 | 5.740 | 5.74 | 0.0002 |
| NEST_HUMAN | Nestin | 22 | 16.84 | 5.924 | 5.92 | 0.0000 |
| FKB1A_HUMAN | Peptidyl-prolyl cis-trans isomerase FKBP1A | 4 | 34.26 | 6.650 | 6.65 | 0.0168 |
| KCD12_HUMAN | BTB/POZ domain-containing protein KCTD12 | 3 | 9.85 | 7.264 | 7.26 | 0.0038 |
| RAIN_HUMAN | Ras-interacting protein 1 | 1 | 1.14 | 13.416 | 13.42 | 0.0393 |
| MUC18_HUMAN | Cell surface glycoprotein MUC18 | 7 | 12.69 | 15.540 | 15.54 | 0.0050 |
Table 2.
Selected list of top 82 proteins identified with more than twofold change in TCs versus ECs at 10th day sorted by iTRAQ ratio and presenting the number of peptides hits
| Accession | Protein name | Peptides (95%) | %Cov (95) | iTRAQ ratio ECs:TCs | Fold enrichment in TCs | P |
|---|---|---|---|---|---|---|
| PTGIS_HUMAN | Prostacyclin synthase | 7 | 15.80 | 0.112 | 8.93 | 0.0016 |
| MUC1_HUMAN | Mucin-1 | 2 | 1.75 | 0.199 | 5.02 | 0.0390 |
| EPIPL_HUMAN | Epiplakin | 17 | 16.07 | 0.209 | 4.78 | 0.0083 |
| SODM_HUMAN | Superoxide dismutase [Mn], mitochondrial | 10 | 35.14 | 0.222 | 4.50 | 0.0155 |
| AL1B1_HUMAN | Aldehyde dehydrogenase X, mitochondrial | 5 | 13.93 | 0.246 | 4.06 | 0.0133 |
| SERA_HUMAN | D-3-phosphoglycerate dehydrogenase | 4 | 8.07 | 0.295 | 3.39 | 0.0019 |
| CYB5_HUMAN | Cytochrome b5 | 4 | 32.09 | 0.306 | 3.27 | 0.0483 |
| SQRD_HUMAN | Sulphide:quinone oxidoreductase, mitochondrial | 9 | 19.78 | 0.328 | 3.05 | 0.0000 |
| THIM_HUMAN | 3-ketoacyl-CoA thiolase, mitochondrial | 12 | 33.50 | 0.338 | 2.95 | 0.0000 |
| ERGI1_HUMAN | Endoplasmic reticulum-Golgi intermediate compartment protein 1 | 4 | 18.97 | 0.348 | 2.88 | 0.0088 |
| EZRI_HUMAN | Ezrin | 19 | 31.40 | 0.354 | 2.83 | 0.0162 |
| CP51A_HUMAN | Lanosterol 14-alpha demethylase | 2 | 3.98 | 0.361 | 2.77 | 0.0156 |
| PLOD2_HUMAN | Procollagen-lysine,2-oxoglutarate 5-dioxygenase 2 | 15 | 22.39 | 0.370 | 2.70 | 0.0061 |
| CO1A2_HUMAN | Collagen alpha-2(I) chain | 9 | 7.91 | 0.382 | 2.62 | 0.0001 |
| ECH1_HUMAN | Delta(3,5)-Delta(2,4)-dienoyl-CoA isomerase, mitochondrial | 4 | 23.78 | 0.385 | 2.60 | 0.0099 |
| RRS1_HUMAN | Ribosome biogenesis regulatory protein homologue | 3 | 9.86 | 0.393 | 2.54 | 0.0059 |
| ACADV_HUMAN | Very long-chain specific acyl-CoA dehydrogenase, mitochondrial | 6 | 9.62 | 0.414 | 2.41 | 0.0449 |
| NB5R1_HUMAN | NADH-cytochrome b5 reductase 1 | 1 | 2.95 | 0.414 | 2.41 | 0.0084 |
| NOP2_HUMAN | Putative ribosomal RNA methyltransferase NOP2 | 3 | 4.06 | 0.436 | 2.29 | 0.0138 |
| PGRC1_HUMAN | Membrane-associated progesterone receptor component 1 | 4 | 18.97 | 0.440 | 2.27 | 0.0210 |
| FINC_HUMAN | Fibronectin | 35 | 20.03 | 0.453 | 2.21 | 0.0002 |
| DHB12_HUMAN | Estradiol 17-beta-dehydrogenase 12 | 3 | 11.54 | 0.454 | 2.20 | 0.0098 |
| DHB4_HUMAN | Peroxisomal multifunctional enzyme type 2 | 11 | 25.00 | 0.479 | 2.09 | 0.0418 |
| TAGL_HUMAN | Transgelin | 15 | 75.12 | 0.482 | 2.08 | 0.0000 |
| OAT_HUMAN | Ornithine aminotransferase, mitochondrial | 5 | 14.12 | 0.487 | 2.05 | 0.0007 |
| LPPRC_HUMAN | Leucine-rich PPR motif-containing protein, mitochondrial | 12 | 9.83 | 0.497 | 2.01 | 0.0403 |
| Accession | Protein name | Peptides (95%) | %Cov (95) | iTRAQ ratio ECs:TCs | Fold enrichment in ECs | P |
|---|---|---|---|---|---|---|
| H15_HUMAN | Histone H1.5 | 7 | 23.45 | 2.002 | 2.00 | 0.0037 |
| RL7A_HUMAN | 60S ribosomal protein L7a | 6 | 21.80 | 2.009 | 2.01 | 0.0001 |
| PLOD1_HUMAN | Procollagen-lysine,2-oxoglutarate 5-dioxygenase 1 | 13 | 20.22 | 2.063 | 2.06 | 0.0000 |
| FETUA_HUMAN | Alpha-2-HS-glycoprotein | 4 | 6.81 | 2.083 | 2.08 | 0.0373 |
| ALDOA_HUMAN | Fructose-bisphosphate aldolase A | 24 | 53.02 | 2.090 | 2.09 | 0.0000 |
| PEA15_HUMAN | Astrocytic phosphoprotein PEA-15 | 2 | 16.92 | 2.100 | 2.10 | 0.0063 |
| PROF1_HUMAN | Profilin-1 | 23 | 75.71 | 2.107 | 2.11 | 0.0005 |
| TPIS_HUMAN | Triosephosphate isomerase | 20 | 64.26 | 2.137 | 2.14 | 0.0000 |
| CNN2_HUMAN | Calponin-2 | 9 | 37.86 | 2.156 | 2.16 | 0.0009 |
| ENOA_HUMAN | Alpha-enolase | 46 | 73.27 | 2.172 | 2.17 | 0.0000 |
| DEST_HUMAN | Destrin | 5 | 28.48 | 2.175 | 2.18 | 0.0118 |
| SH3L3_HUMAN | SH3 domain-binding glutamic acid-rich-like protein 3 | 3 | 34.41 | 2.185 | 2.19 | 0.0196 |
| H12_HUMAN | Histone H1.2 | 7 | 30.99 | 2.197 | 2.20 | 0.0056 |
| TGM2_HUMAN | Protein-glutamine gamma-glutamyltransferase 2 | 18 | 21.25 | 2.205 | 2.21 | 0.0247 |
| WDR1_HUMAN | WD repeat-containing protein 1 | 10 | 18.15 | 2.218 | 2.22 | 0.0000 |
| GPX1_HUMAN | Glutathione peroxidase 1 | 6 | 23.15 | 2.259 | 2.26 | 0.0005 |
| ACTN4_HUMAN | Alpha-actinin-4 | 44 | 42.15 | 2.269 | 2.27 | 0.0057 |
| P3H3_HUMAN | Prolyl 3-hydroxylase 3 | 4 | 7.74 | 2.275 | 2.27 | 0.0138 |
| COTL1_HUMAN | Coactosin-like protein | 4 | 18.31 | 2.275 | 2.27 | 0.0125 |
| ITA5_HUMAN | Integrin alpha-5 | 7 | 8.20 | 2.320 | 2.32 | 0.0001 |
| RL24_HUMAN | 60S ribosomal protein L24 | 6 | 31.21 | 2.329 | 2.33 | 0.0009 |
| PDLI7_HUMAN | PDZ and LIM domain protein 7 | 4 | 8.97 | 2.329 | 2.33 | 0.0027 |
| 6PGD_HUMAN | 6-phosphogluconate dehydrogenase, decarboxylating | 5 | 10.77 | 2.360 | 2.36 | 0.0152 |
| PLST_HUMAN | Plastin-3 | 11 | 19.37 | 2.388 | 2.39 | 0.0000 |
| ZYX_HUMAN | Zyxin | 10 | 18.53 | 2.515 | 2.51 | 0.0234 |
| CSRP1_HUMAN | Cysteine and glycine-rich protein 1 | 3 | 21.76 | 2.525 | 2.53 | 0.0014 |
| PDLI1_HUMAN | PDZ and LIM domain protein 1 | 6 | 26.75 | 2.529 | 2.53 | 0.0001 |
| ACTN1_HUMAN | Alpha-actinin-1 | 37 | 38.68 | 2.557 | 2.56 | 0.0000 |
| DPYL2_HUMAN | Dihydropyrimidinase-related protein 2 | 10 | 21.33 | 2.560 | 2.56 | 0.0032 |
| NTF2_HUMAN | Nuclear transport factor 2 | 2 | 17.32 | 2.599 | 2.60 | 0.0162 |
| MOES_HUMAN | Moesin | 26 | 44.71 | 2.609 | 2.61 | 0.0004 |
| SPHM_HUMAN | N-sulphoglucosamine sulphohydrolase | 2 | 4.98 | 2.639 | 2.64 | 0.0049 |
| EHD2_HUMAN | EH domain-containing protein 2 | 8 | 17.13 | 2.738 | 2.74 | 0.0007 |
| AMPN_HUMAN | Aminopeptidase N | 7 | 7.03 | 2.760 | 2.76 | 0.0290 |
| VIME_HUMAN | Vimentin | 200 | 83.69 | 2.833 | 2.83 | 0.0001 |
| CATB_HUMAN | Cathepsin B | 7 | 23.89 | 2.985 | 2.98 | 0.0041 |
| PTRF_HUMAN | Polymerase I and transcript release factor | 17 | 42.82 | 3.019 | 3.02 | 0.0019 |
| FLNB_HUMAN | Filamin-B | 96 | 41.78 | 3.050 | 3.05 | 0.0000 |
| K6PP_HUMAN | 6-phosphofructokinase type C | 5 | 8.29 | 3.090 | 3.09 | 0.0001 |
| TSP1_HUMAN | Thrombospondin-1 | 3 | 3.16 | 3.138 | 3.14 | 0.0056 |
| VAT1_HUMAN | Synaptic vesicle membrane protein VAT-1 homologue | 12 | 31.81 | 3.235 | 3.23 | 0.0000 |
| HSPB1_HUMAN | Heat shock protein beta-1 | 17 | 61.46 | 3.306 | 3.31 | 0.0311 |
| FSCN1_HUMAN | Fascin | 6 | 16.63 | 3.473 | 3.47 | 0.0000 |
| TPP1_HUMAN | Tripeptidyl-peptidase 1 | 7 | 12.08 | 3.573 | 3.57 | 0.0200 |
| SDPR_HUMAN | Serum deprivation-response protein | 3 | 9.18 | 3.951 | 3.95 | 0.0004 |
| NEST_HUMAN | Nestin | 22 | 16.84 | 4.134 | 4.13 | 0.0004 |
| SYWC_HUMAN | Tryptophanyl-tRNA synthetase, cytoplasmic | 3 | 8.70 | 4.389 | 4.39 | 0.0009 |
| TXND5_HUMAN | Thioredoxin domain-containing protein 5 | 15 | 40.51 | 5.918 | 5.92 | 0.0000 |
| EGLN_HUMAN | Endoglin | 3 | 6.69 | 6.297 | 6.30 | 0.0067 |
| FABP5_HUMAN | Fatty acid-binding protein, epidermal | 4 | 16.30 | 7.134 | 7.13 | 0.0109 |
| MUC18_HUMAN | Cell surface glycoprotein MUC18 | 7 | 12.69 | 9.313 | 9.31 | 0.0003 |
| FKB1A_HUMAN | Peptidyl-prolyl cis-trans isomerase FKBP1A | 4 | 34.26 | 10.535 | 10.53 | 0.0244 |
| PECA1_HUMAN | Platelet endothelial cell adhesion molecule | 9 | 11.52 | 13.313 | 13.31 | 0.0029 |
| VWF_HUMAN | von Willebrand factor | 19 | 7.93 | 15.888 | 15.89 | 0.0000 |
| CRIP2_HUMAN | Cysteine-rich protein 2 | 2 | 14.90 | 100.000 | 100.00 | 0.0137 |
| MARE1_HUMAN | Microtubule-associated protein RP/EB family member 1 | 2 | 7.46 | 100.000 | 100.00 | 0.0186 |
TCs versus ECs 5th day in cell culture
Up-regulated proteins
We identified, by comparison between TCs and ECs, that there are 38 proteins up-regulated in TCs, especially Myosin-14 (18.84-fold), superoxide dismutase (SOD2; 14.59-fold), acid ceramidase (AC; 7.63-fold), envoplakin and epiplakin (∽6-fold each).
Down-regulated proteins
In TCs, compared to ECs there are 60 proteins down-regulated, especially cell surface glycoprotein MUC18 (15.54-fold), Ras-interacting protein 1 (13.42-fold), BTB/POZ domain-containing protein (7.26-fold), peptidyl prolyl cis/trans isomerase (6.65-fold) and nestin (5.92-fold) and von Willebrand factor (5.74-fold).
Functional analysis of the identified proteins
The protein expression profiles were analysed with the aid of PANTHER Classification System and depicted in Figures1–3 (details are given in Tables S1 and S2). The highly expressed proteins in TCs are involved in important molecular functions such as: catalytic activity (17 proteins), structural molecule activity (13 proteins) as seen in Figure1A compared to ECs where significantly more proteins are involved in catalytic activity (30 proteins) and 29 proteins have molecular binding function (Fig.1B). In addition, in ECs, two up-regulated proteins are involved in nucleic acid-binding transcription and one has anti-oxidant activity.
Figure 1.
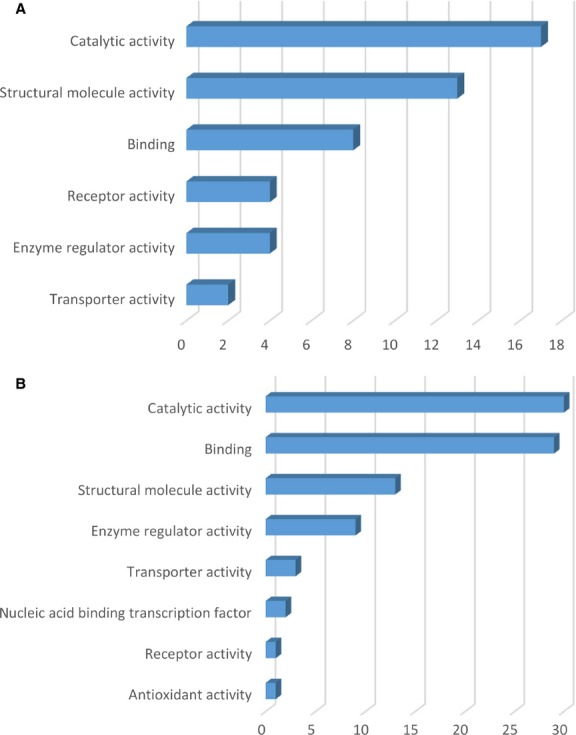
Molecular function classification of proteins found at day 5 in TCs (A) and in ECs (B). Bar graphs based on the PANTHER (Protein ANalysis THrough Evolutionary Relationships) system.
Figure 3.

Bar graph representation of the distribution of identified proteins in TCs and ECs (cell culture, 5th day) according to their protein class (A and B), pathways (C and D) and cellular components (E and F) classification.
Analysis of PANTHER biological processes, in which the 38 up-regulated proteins in TCs are involved, revealed that 18 proteins are responsible for metabolic processes and 15 proteins in cellular processes - Figure2A, such as cell communication (4 proteins), cytokinesis (2 proteins), cellular component movement (2 proteins), cell cycle (2 proteins) - Figure2C. Ten up-regulated proteins in TCs are involved in developmental processes: anatomical structure morphogenesis (10 proteins), mesoderm development (3 proteins), system development (2 proteins) and ectoderm development (1 protein) - Figure2E. Moreover, 10 proteins in TCs are related to localization processes such as vesicle mediated transport (4 proteins), protein transport (4 proteins) and ion transport (3 proteins) - Figure2G.
Figure 2.

Analysis of differentially expressed proteins at day 5 in TCs versus ECs by biological process (A and B), cellular processes (C and D), developmental processes (E and F) and localization (G and H).
Biological processes of the ECs are related to 42 up-regulated proteins correlated with metabolic processes, 27 to cellular processes (Fig.2B) such as cell communication (11 proteins), cell cycle (7 proteins), cellular component movement (3 proteins), cytokinesis (2 proteins), chromosome segregation (1 protein) - Figure2D. There are 12 up-regulated proteins which are part of the developmental processes such as anatomical structure morphogenesis (8 proteins), system development (2 proteins), apoptotic processes (2 proteins), ectoderm development (1 protein) - Figure2F. Twelve proteins in ECs participate in localization processes e.g. protein transport (11 proteins), nuclear transport (8 proteins), vesicle mediated transport (2 proteins), RNA localization (2 proteins) and ion transport (1 protein) - Figure2H.
Interestingly to note, there are 6 up-regulated proteins in TCs compared to ECs involved in biological regulation and 5 related to response to stimulus.
The protein classes of the TCs enclose cytoskeletal proteins (12 proteins), oxidoreductase (8 proteins), structural proteins (7 proteins), transferase (5 proteins) etc. - Figure3A. The up-regulated TCs proteins belong to the following pathways: nicotinic acetylcholine receptor (2 proteins), inflammation mediated by chemokines (2 proteins), de novo purine biosynthesis (2 proteins), cytoskeletal regulation by Rho GTPase (2 proteins), TCA cycle (1 protein), Parkinson disease (1 protein), integrin signalling (1 protein) and blood coagulation (1 protein) - Figure3C. In TCs, the up-regulated proteins are related to the following cellular components: cell part (13 proteins), organelle (12 proteins), membrane (2 proteins), cell junction (2 proteins), extracellular region (1 protein) and extracellular matrix (1 protein) - Figure3E.
The up-regulated proteins in ECs are attributed to the following protein classes: enzyme modulator (11 proteins), cytoskeletal proteins (10 proteins), oxidoreductase (7 proteins), nucleic acid binding (6 proteins), transferase, isomerase and chaperone (5 proteins each), etc. - Figure3B. The pathways map depicted the ECs proteins are related to: integrin signalling pathway (3 proteins), Huntington disease (3 proteins), cytoskeletal regulation by Rho GTPase (3 proteins), pentose phosphate pathway (2 proteins), Parkinson disease (2 proteins), inflammation mediated by chemokines (2 proteins), glycolysis (2 proteins), etc. - Figure3D. The cellular component of ECs proteome demonstrated proteins related to: cell part (12 proteins), organelle (10 proteins), extracellular region (1 protein) and extracellular matrix (1 protein) - Figure3F.
The heat map showing the differentially expressed proteins between TCs and ECs, in cell culture after 5 days, can be observed in Figure4.
Figure 4.
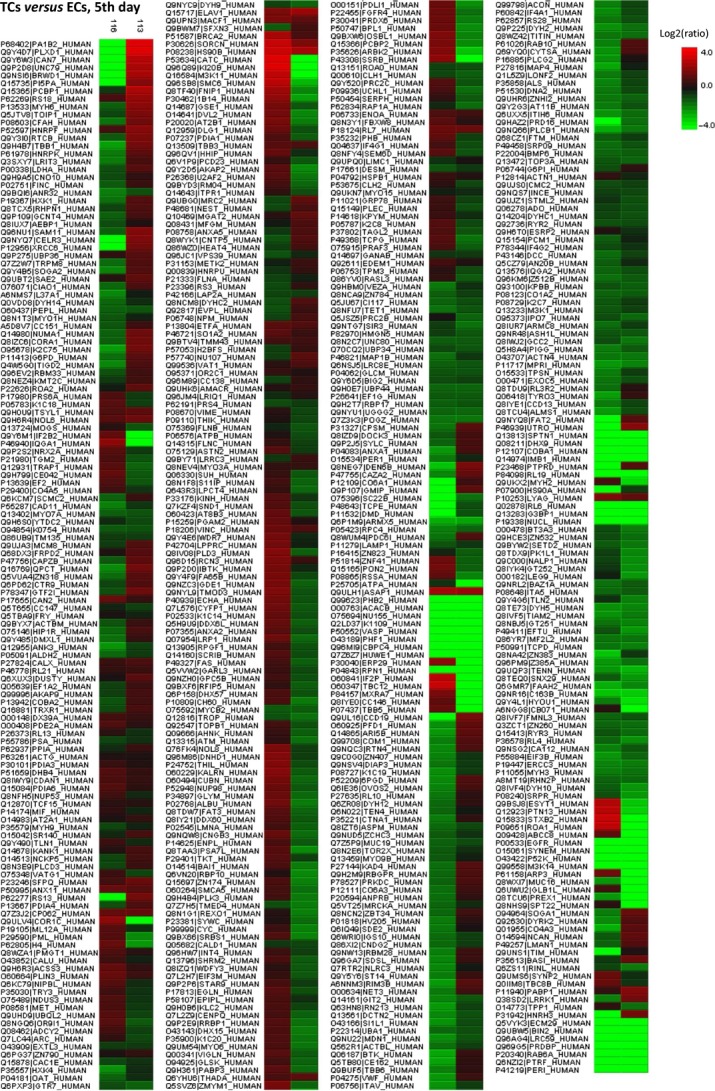
Heat map generated from iTRAQ data by using PEAKS. It shows differential expression results between TCs and ECs (cell culture, 5th day). Experimental samples are clustered on the horizontal axis and protein spots on the vertical axis. Colours correspond to the level of the measurement: red indicates increased and green decreased expression ratio, while black squares indicate no change in protein abundance.
TCs versus ECs, 10th day in cell culture
Up-regulated proteins
Telocytes as compared to ECs, showed that there are 26 proteins up-regulated in TCs, especially prostacyclin synthase (8.93-fold), epiplakin (4.78-fold) and superoxide dismutase (4.50-fold).
Down-regulated proteins
In TCs, compared to ECs there are 56 proteins down-regulated, especially microtubule-associated protein RP/EB family member 1 (100-fold), cysteine-rich protein 2 (100-fold), von Willebrand factor (15.89-fold) and platelet endothelial cell adhesion molecule (13.31-fold) peptidyl prolyl cis/trans isomerase (10.53-fold) and cell surface glycoprotein MUC18 (9.31-fold) - Table2 (For details see Tables S3 and S4).
Functional analysis of the identified proteins
Figures5–7 show the distributions of differentially proteins in putative functional categories. The highly expressed proteins in TCs are involved in important molecular functions such as: catalytic activity (15 proteins), structural molecule activity (10 proteins), binding (5 proteins), receptor activity (3 proteins), transporter activity (2 proteins) as seen in Figure5A compared to ECs where significantly more proteins are involved in binding (24 proteins), structural molecule activity (21 proteins), catalytic activity (20 proteins), nucleic acid-binding transcription (6 proteins), enzyme regulator activity (3 proteins), anti-oxidant activity (1 protein) - Figure5B.
Figure 5.
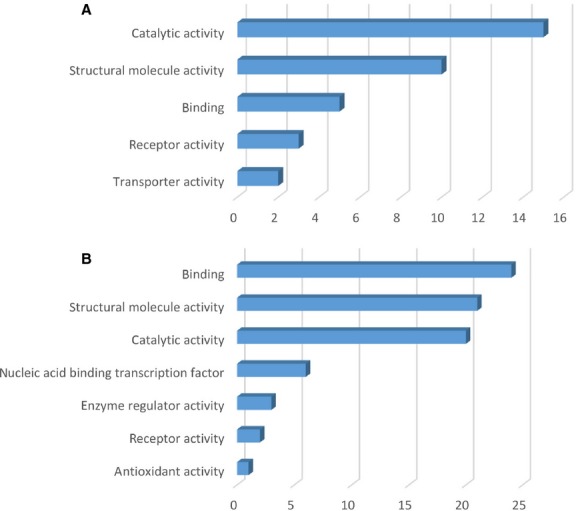
Molecular function classification of proteins found at day 10 in TCs (A) and in ECs (B). Bar graphs based on the PANTHER (Protein ANalysis THrough Evolutionary Relationships) system.
Figure 7.

Bar graph representation of the distribution of identified proteins in TCs and ECs (cell culture, 10th day) according to their protein class (A and B), pathways (C and D) and cellular components (E and F) classification.
The 26 up-regulated proteins found in TCs were assigned to the following biological processes (according to PANTHER): metabolic processes (16 proteins), cellular processes (11 proteins), developmental processes (8 proteins), cellular component organization (8 proteins), etc. - (Fig.6A). The only cellular process which involve TCs up-regulated proteins is cell communication - Figure6C. Eight up-regulated proteins in TCs are involved in one developmental process - anatomical structure morphogenesis - Figure6E. Two proteins in TCs are related to localization processes such as vesicle mediated transport (1 protein) and protein transport (2 proteins) - Figure6G.
Figure 6.

Analysis of differentially expressed proteinsat day 10 in TCs versus ECs by biological process (A and B), cellular processes (C and D), developmental processes (E and F) and localization (G and H).
The 56 proteins found to be up-regulated in the ECs are assigned to the following biological processes: metabolic processes (32 proteins), cellular processes (27 proteins), developmental processes (18 proteins) - Figure6B. The cellular processes which involve ECs proteins are: cellular component movement (9 proteins), cell communication (5 proteins), cell cycle (2 proteins) - Figure6D. The main developmental processes which involve ECs proteins are: anatomical structure morphogenesis (13 proteins), system development (8 proteins), mesoderm development (5 proteins), ectoderm development (4 proteins), death (2 proteins), embryo development (1 protein) - Figure6F. Five proteins in ECs participate in localization processes e.g. protein transport (4 proteins), nuclear transport (3 proteins), vitamin transport (1 protein), vesicle mediated transport (1 protein), lipid transport (1 protein) - Figure6H.
The protein classes of the TCs enclose oxidoreductase (12 proteins), cytoskeletal proteins (8 proteins), structural proteins (6 proteins), transferase (5 proteins) etc. - Figure7A. The up-regulated TCs proteins belong to the following pathways: integrin signalling pathway (2 proteins) serine glycine biosynthesis (1 protein) - Figure7C. In TCs, the up-regulated proteins are related to the following cellular components: cell part (8 proteins), organelle (8 proteins), extracellular region (2 proteins) and extracellular matrix (1 protein) - Figure7E.
The up-regulated proteins in ECs are attributed to the following protein classes: cytoskeletal proteins (18 proteins), transcription factor (6 proteins), nucleic acid binding (6 proteins), hydrolase (5 proteins), oxidoreductase (4 proteins), structural protein (4 proteins), etc. - Figure7B. The pathways map depicted the ECs proteins are related to: integrin signalling pathway (4 proteins), glycolysis (2 proteins), etc. - Figure7D. The cellular component of ECs proteome demonstrated proteins related to: cell part (20 proteins), organelle (18 proteins), extracellular region (3 proteins) and extracellular matrix (3 proteins), membrane (1 protein), macromolecular complex (1 protein), cell junction (1 protein) - Figure7F.
The heat map presenting the differentially expressed proteins between TCs and ECs is showed in Figure8 and demonstrate that the differences between this two cell types are still preserved in cell culture after 10 days.
Figure 8.
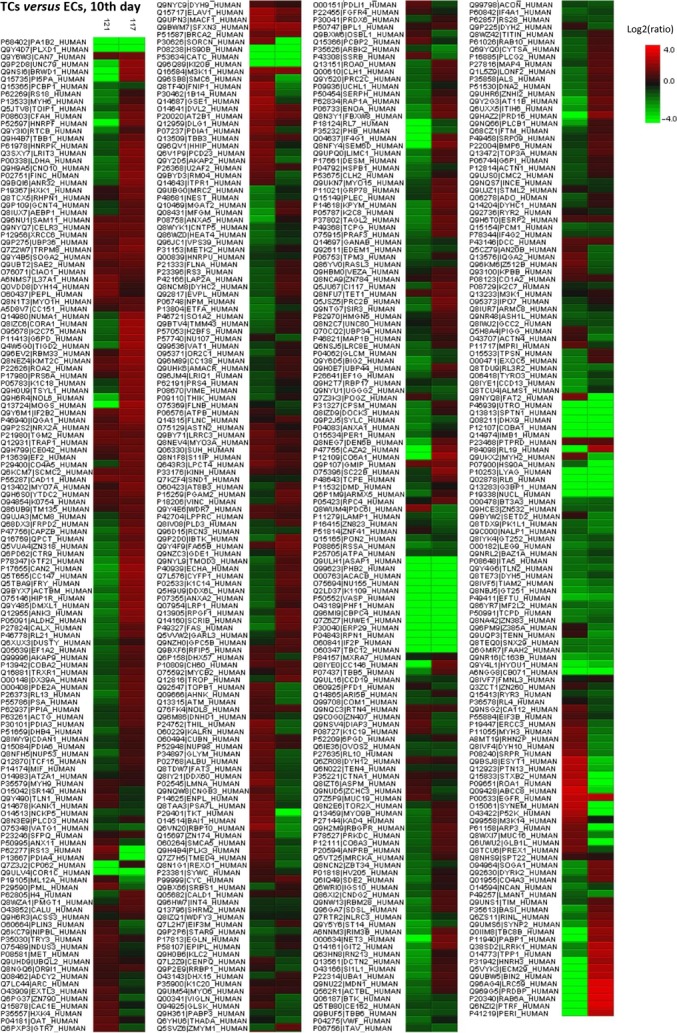
Differentially expressed proteins between TCs and ECs (cell culture, 10th day) were analysed by hierarchical clustering. In the heat map the experimental samples are clustered on the horizontal axis and protein spots on the vertical axis. Red: up-regulation; green: down-regulation; black: no change.
Figures9 and 10 use radar-chart representation of differentially expressed proteins between TCs and ECs at 5th day and at 10th day in cell cultures. Radar charts were chosen because they allow the visualization of a large numbers of proteins at the same time.
Figure 9.
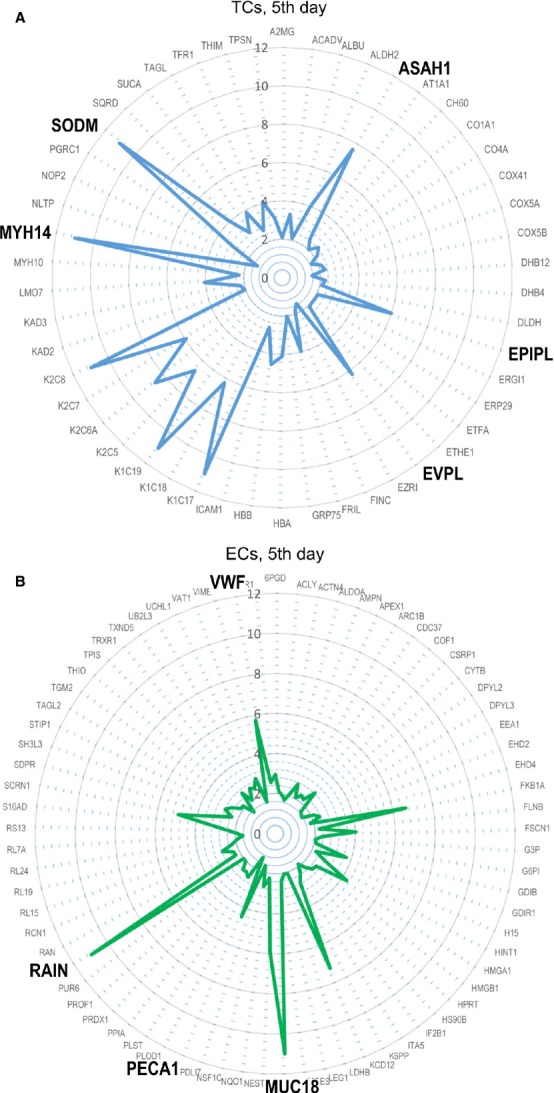
Radar plots of proteomic profile for top proteins of TCs (A) and ECs (B) at 5th day in cell culture.
Figure 10.
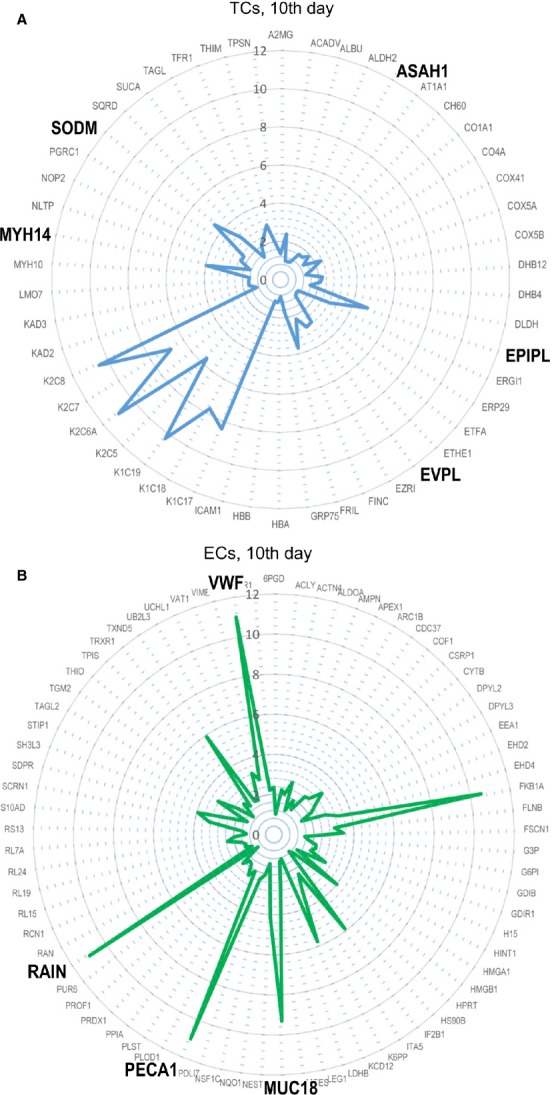
Radar plots of proteomic profile for top proteins of TCs (A) and ECs (B) at 10th day in cell culture.
A String Network analysis was also performed to study the relation among differentially expressed proteins. In the global STRING-generated protein-protein network, several complexes and cellular functions formed prominent, tightly connected clusters as assessed by means of molecular complex detection (see Figs S1–S4). Figures1 and 2 quantify protein-interaction properties of the TCs and ECs, respectively where the confidence view is presented and stronger associations are represented by thicker lines. These results indicate that while TCs are involved mainly in oxidation-reduction processes (Fig.1A), ECs are involved (as expected) in haemostasis (Fig.2A). Both cell types release extracellular vesicles (exosomes) [29,49], however their content is different as indicated in Figures1B and 2B.
Figure 11.
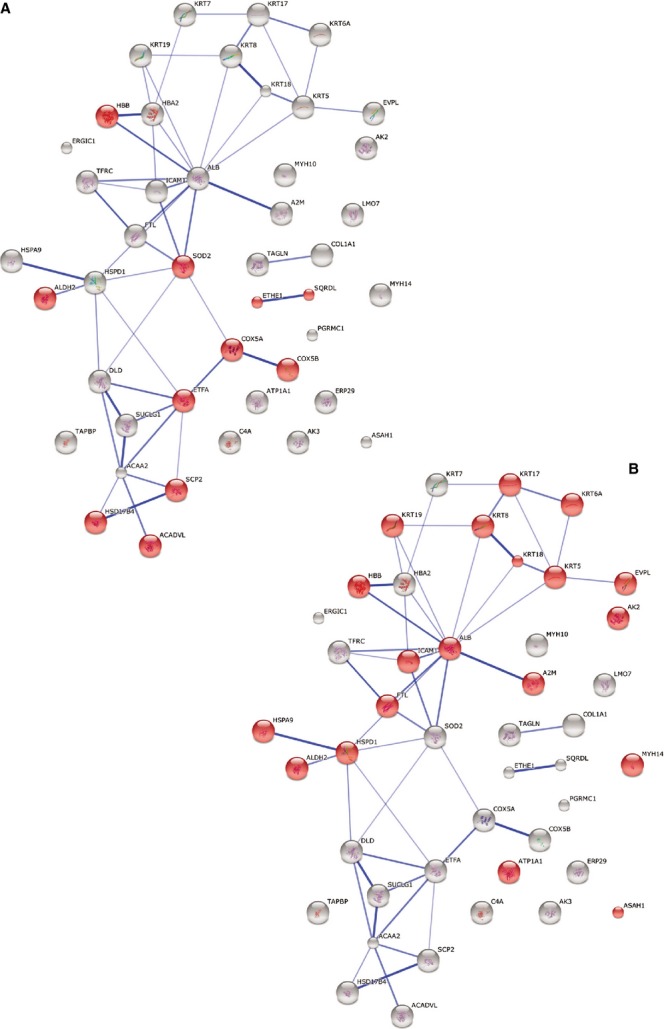
Protein interaction network generated with STRING. Major clusters of interacting proteins include those involved in oxidation-reduction process (A) and extracellular vesicular exosome (B) for TCs at day 5. Red nodes represent up-regulated proteins involved in these processes.
Figure 12.
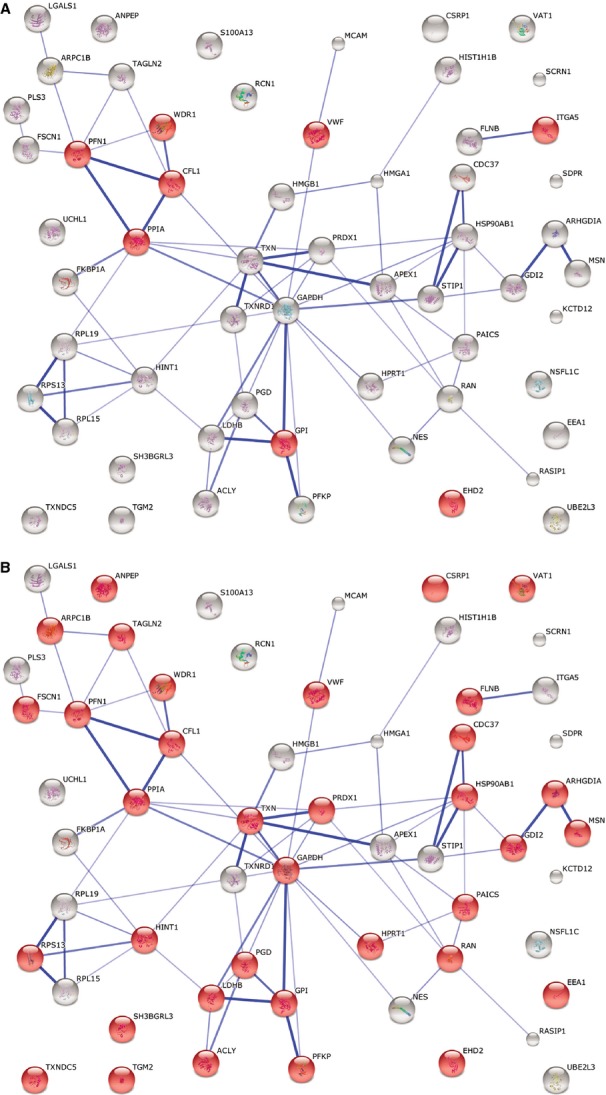
STRING analysis for ECs at day 5 investigating the interactions between up-regulated proteins and depicting ECs involvement in haemostasis (A) and extracellular vesicular exosome (B). Red nodes represent up-regulated proteins involved in these processes.
Discussion
Previously, we performed a proteomic analysis of human lung TCs compared to fibroblasts, at different time-points (the 5th and 10th day in primary cell culture) and we demonstrated that TCs protein expression profile is different [34]. The results were suggestive for specific roles of TCs in mechanical sensing and mechanic-chemical conversion task, tissue homoeostasis and remodelling/renewal. In addition, the presence of some proteins, specific for extracellular vesicles, emphasize TCs roles in intercellular signalling and stem cell niche modulation [19,34,50].
Beyond scientific interest in general, the comparison of TCs with ECs has a specific purpose. Both TCs and ECs are immunohistochemically CD34 positive, but while ECs are CD31 positive, TCs are CD31 negative. The present proteomic comparison confirms these immunohistochemical differences.
Putative roles of differentially expressed proteins
We previously showed that myosin-14 which is the main up-regulated protein in TCs make these cells candidates for a mechanical sensing and mechanochemical conversion task [34].
Telocytes proteome revealed the presence of SOD2 (SODM), a tetrameric anti-oxidative enzyme located in the mitochondrial matrix, encoded by genes located on chromosome 6 (6q25.3). The enzyme has manganese in its reactive centre, and catalyse the dismutation of superoxide (O2−) into oxygen and hydrogen peroxide. SOD2 act as a cytoprotective enzyme proved to be essential for the survival of aerobic organisms [51]. It also serves as key anti-oxidant being considered a tumour suppressor protein via modulating redox-related transcriptional factors [52].
Acid ceramidase, (an enzyme encoded by the ASAH1 gene) which was found to be up-regulated in TCs, is located in lysosomes and active at acidic pH [53]. It was shown to have a noteworthy position in cancer biology: high AC activity leads to an enhanced cell growth, while low AC activity leads to reduced cell growth through an enhanced ceramide response [54]. Also, AC has been shown to play important roles in tumour pathogenesis, and in resistance to therapy having a key role in controlling the ceramide-sphingosine-sphingosine-1-phosphate (S1P) balance that regulates cellular homoeostasis[55]. Therefore, we can hypothesize that TCs might have pro-proliferative effects through the inhibition of apoptosis through the regulation of inter-conversion of ceramide, sphingosine and S1P.
Envoplakin is a protein that in humans is encoded by the EVPL gene, and it is a member of a family of large multi-domain molecules [56]. Periplakin (195 kD) and envoplakin (210 kD) are closely related and have various functions to link cytoskeletal elements together and to connect them to junctional complexes. As we previously suggested, the presence of plakins in TCs is related to their homo and heterocellular junctions and it might be related to mechanical sensing and mechanochemical conversion task [34]. Plakins may also have additional roles in signal transduction [56].
Endothelial cells proteomic analysis revealed that proteins like microtubule-associated protein RP/EB family member 1, MUC18, cysteine-rich protein 2, von Willebrand factor (15.89-fold) and platelet endothelial cell adhesion molecule were found to be up-regulated at 5th day and also at 10th day in ECs culture. Microtubule-associated protein RP/EB family member 1 is a ubiquitously expressed protein which binds to the plus end of microtubules and regulates the dynamics of the microtubule cytoskeleton, probably playing a role in cell migration [57]. MUC18 (CD146) is a glycoprotein detected in endothelial cells as a surface receptor that triggers a transient increase in the intracellular calcium concentration [58]. Cysteine-rich protein (CRP) 2 is a member of the LIM-only CRP family, also expressed in vascular smooth muscle cells (VSMCs) of blood vessels [59]. Its role is to repress VSMC migration and vascular remodelling, because it was demonstrated that the absence of CRP2 increases neointima formation, correlating with increased VSMC migration [60]. von Willebrand factor is a haemostatic protein stored in Weibel Palade bodies (considered as a hallmark of endothelial cells) until release [61]. In addition, we identified Ras-interacting protein 1 (RAIN) as being overexpressed in ECs. We can consider RAIN - known to be essential for endothelial cell morphogenesis and blood vessel tubulogenes - as being a part of the specific signature for ECs, in consistency with other recent proteomic study [62].
We found no significant differences between protein expression, in ECs, at 5 days and at 10 days.
Our present results suggest that TCs are cells relatively rich in mitochondria, which correlates with previous findings [34]. The primary functions of mitochondria include: generating energy by oxidative phosphorylation, creating reactive oxygen species (ROS) and regulating apoptosis. It is also known that cellular ageing is influenced by oxidative phosphorylation, ROS and telomeres. Therefore, this study enabled us to suggest TCs involvement in the modulation of oxidative stress levels which might lead to a rigorous control in apoptosis activation. This finding is also in agreement with the fact that TCs are decreasing during ageing of myocardium (work in progress).
This study provides a comprehensive approach to analyse the comparative proteome between TCs and ECs and we can conclude that the significant discriminative power of each of the proteins mentioned above supports the case for TCs as distinctive cells, while ECs are characterized by the already known marker molecules such as MUC18 and von Willebrand factor. Also, it supports once more the idea of TCs involvement in tissue homoeostasis and in stem cell activity, as previously suggested by our group.
Moreover, it stands for a recent perspective suggested by Smithies and Edelstein considering TCs as a very primitive nervous system at the cellular level which can play a major role in morphogenetic bioelectrical signalling [63,64].
In conclusion, the current proteomic analysis presented here, clearly depicts that TCs are completely different from ECs. Protein expression profile demonstrates that TCs might play specific roles in intercellular signaling and also as physical and/or chemical sensors. Their close relationships with stem cells should not be overlooked.
Acknowledgments
The work was supported by Shanghai Leading Academic Discipline Project (Project Number: B115), Zhongshan Distinguished Professor Grant (XDW), The National Nature Science Foundation of China (91230204, 81270099, 81320108001, 81270131), The Shanghai Committee of Science and Technology (12JC1402200, 12431900207, 11410708600), Zhejiang Provincial Natural Science Foundation (Z2080988), Zhejiang Provincial Science Technology Department Foundation (2010C14011), and Ministry of Education, Academic Special Science and Research Foundation for PhD Education (20130071110043).
This article was supported (for DC) by the Sectorial Operational Programme Human Resources Development (SOP HRD), financed from the European Social Fund and by the Romanian Government under the contract number POSDRU/159/1.5/S/141531. We thank the Institutes of Biomedical Sciences and Department of Chemistry, Fudan University, for automated 2-D nano-ESI LC-MS/MS analysis of peptides.
Supporting Information
Figure S1 STRING analysis of up-regulated proteins in TCs at day 5 representing the confidence view where stronger associations are represented by thicker lines.
Figure S2 STRING analysis of up-regulated proteins in ECs at day 5 representing the confidence view where stronger associations are represented by thicker lines.
Figure S3 STRING analysis of up-regulated proteins in TCs at day 10 representing the confidence view where stronger associations are represented by thicker lines.
Figure S4 STRING analysis of up-regulated proteins in ECs at day 10 representing the confidence view where stronger associations are represented by thicker lines.
Table S1 Summary of up-regulated TCs proteins (more than twofold) versus ECs 5th day.
Table S2 Summary of up-regulated ECs proteins (more than twofold) versus TCs 5th day.
Table S3 Summary of up-regulated TCs proteins (more than twofold) versus ECs 10th day.
Table S4 Summary of up-regulated ECs proteins (more than twofold) versus TCs 10th day.
References
- 1.Popescu LM, Faussone-Pellegrini MS. TELOCYTES - a case of serendipity: the winding way from Interstitial Cells of Cajal (ICC), via Interstitial Cajal-Like Cells (ICLC) to TELOCYTES. J Cell Mol Med. 2010;14:729–40. doi: 10.1111/j.1582-4934.2010.01059.x. [DOI] [PMC free article] [PubMed] [Google Scholar]
- 2.Popescu LM, Gherghiceanu M, Suciu LC, et al. Telocytes and putative stem cells in the lungs: electron microscopy, electron tomography and laser scanning microscopy. Cell Tissue Res. 2011;345:391–403. doi: 10.1007/s00441-011-1229-z. [DOI] [PMC free article] [PubMed] [Google Scholar]
- 3.Zheng Y, Li H, Manole CG, et al. Telocytes in trachea and lungs. J Cell Mol Med. 2011;15:2262–8. doi: 10.1111/j.1582-4934.2011.01404.x. [DOI] [PMC free article] [PubMed] [Google Scholar]
- 4.Hinescu ME, Gherghiceanu M, Suciu L, Popescu LM. Telocytes in pleura: two- and three-dimensional imaging by transmission electron microscopy. Cell Tissue Res. 2011;343:389–97. doi: 10.1007/s00441-010-1095-0. [DOI] [PMC free article] [PubMed] [Google Scholar]
- 5.Rusu MC, Jianu AM, Mirancea N, et al. Tracheal telocytes. J Cell Mol Med. 2012;16:401–5. doi: 10.1111/j.1582-4934.2011.01465.x. [DOI] [PMC free article] [PubMed] [Google Scholar]
- 6.Zhao B, Chen S, Liu J, et al. Cardiac telocytes were decreased during myocardial infarction and their therapeutic effects for ischaemic heart in rat. J Cell Mol Med. 2013;17:123–33. doi: 10.1111/j.1582-4934.2012.01655.x. [DOI] [PMC free article] [PubMed] [Google Scholar]
- 7.Rusu MC, Pop F, Hostiuc S, et al. Telocytes form networks in normal cardiac tissues. Histol Histopathol. 2012;27:807–16. doi: 10.14670/HH-27.807. [DOI] [PubMed] [Google Scholar]
- 8.Gherghiceanu M, Popescu LM. Cardiac telocytes - their junctions and functional implications. Cell Tissue Res. 2012;348:265–79. doi: 10.1007/s00441-012-1333-8. [DOI] [PMC free article] [PubMed] [Google Scholar]
- 9.Manole CG, Cismasiu V, Gherghiceanu M, Popescu LM. Experimental acute myocardial infarction: telocytes involvement in neo-angiogenesis. J Cell Mol Med. 2011;15:2284–96. doi: 10.1111/j.1582-4934.2011.01449.x. [DOI] [PMC free article] [PubMed] [Google Scholar]
- 10.Cretoiu SM, Simionescu AA, Caravia L, et al. Complex effects of imatinib on spontaneous and oxytocin-induced contractions in human non-pregnant myometrium. Acta Physiol Hung. 2011;98:329–38. doi: 10.1556/APhysiol.98.2011.3.10. [DOI] [PubMed] [Google Scholar]
- 11.Cretoiu SM, Cretoiu D, Popescu LM. Human myometrium - the ultrastructural 3D network of telocytes. J Cell Mol Med. 2012;16:2844–9. doi: 10.1111/j.1582-4934.2012.01651.x. [DOI] [PMC free article] [PubMed] [Google Scholar]
- 12.Cretoiu SM, Cretoiu D, Simionescu AA, Popescu LM. Telocytes in human fallopian tube and uterus express estrogen and progesterone receptors. In: Kahn S, editor. Sex steroids. Rijeka, Croatia: Intech; 2012. pp. 91–114. [Google Scholar]
- 13.Hatta K, Huang ML, Weisel RD, Li RK. Culture of rat endometrial telocytes. J Cell Mol Med. 2012;16:1392–6. doi: 10.1111/j.1582-4934.2012.01583.x. [DOI] [PMC free article] [PubMed] [Google Scholar]
- 14.Ceafalan L, Gherghiceanu M, Popescu LM, Simionescu O. Telocytes in human skin–are they involved in skin regeneration? J Cell Mol Med. 2012;16:1405–20. doi: 10.1111/j.1582-4934.2012.01580.x. [DOI] [PMC free article] [PubMed] [Google Scholar]
- 15.Manetti M, Guiducci S, Ruffo M, et al. Evidence for progressive reduction and loss of telocytes in the dermal cellular network of systemic sclerosis. J Cell Mol Med. 2013;17:482–96. doi: 10.1111/jcmm.12028. [DOI] [PMC free article] [PubMed] [Google Scholar]
- 16.Cretoiu D, Cretoiu SM, Simionescu AA, Popescu LM. Telocytes, a distinct type of cell among the stromal cells present in the lamina propria of jejunum. Histol Histopathol. 2012;27:1067–78. doi: 10.14670/HH-27.1067. [DOI] [PubMed] [Google Scholar]
- 17.Rusu MC, Nicolescu MI, Jianu AM, et al. Esophageal telocytes and hybrid morphologies. Cell Biol Int. 2012;36:1079–88. doi: 10.1042/CBI20120007. [DOI] [PubMed] [Google Scholar]
- 18.Chen X, Zheng Y, Manole CG, et al. Telocytes in human oesophagus. J Cell Mol Med. 2013;17:1506–12. doi: 10.1111/jcmm.12149. [DOI] [PMC free article] [PubMed] [Google Scholar]
- 19.Nicolescu MI, Popescu LM. Telocytes in the interstitium of human exocrine pancreas: ultrastructural evidence. Pancreas. 2012;41:949–56. doi: 10.1097/MPA.0b013e31823fbded. [DOI] [PubMed] [Google Scholar]
- 20.Xiao J, Wang F, Liu Z, Yang C. Telocytes in liver: electron microscopic and immunofluorescent evidence. J Cell Mol Med. 2013;17:1537–42. doi: 10.1111/jcmm.12195. [DOI] [PMC free article] [PubMed] [Google Scholar]
- 21.Gevaert T, De Vos R, Van Der Aa F, et al. Identification of telocytes in the upper lamina propria of the human urinary tract. J Cell Mol Med. 2012;16:2085–93. doi: 10.1111/j.1582-4934.2011.01504.x. [DOI] [PMC free article] [PubMed] [Google Scholar]
- 22.Qi G, Lin M, Xu M, et al. Telocytes in the human kidney cortex. J Cell Mol Med. 2012;16:3116–22. doi: 10.1111/j.1582-4934.2012.01582.x. [DOI] [PMC free article] [PubMed] [Google Scholar]
- 23.Corradi LS, Jesus MM, Fochi RA, et al. Structural and ultrastructural evidence for telocytes in prostate stroma. J Cell Mol Med. 2013;17:398–406. doi: 10.1111/jcmm.12021. [DOI] [PMC free article] [PubMed] [Google Scholar]
- 24.Gevaert T, Lerut E, Joniau S, et al. Characterization of subepithelial interstitial cells in normal and pathological human prostate. Histopathology. 2014 doi: 10.1111/his.12402. doi: 10.1111/his.12402. [DOI] [PubMed] [Google Scholar]
- 25.Suciu LC, Popescu BO, Kostin S, Popescu LM. Platelet-derived growth factor receptor-beta-positive telocytes in skeletal muscle interstitium. J Cell Mol Med. 2012;16:701–7. doi: 10.1111/j.1582-4934.2011.01505.x. [DOI] [PMC free article] [PubMed] [Google Scholar]
- 26.Diaz-Flores L, Gutierrez R, Saez FJ, et al. Telocytes in neuromuscular spindles. J Cell Mol Med. 2013;17:457–65. doi: 10.1111/jcmm.12015. [DOI] [PMC free article] [PubMed] [Google Scholar]
- 27.Luesma MJ, Gherghiceanu M, Popescu LM. Telocytes and stem cells in limbus and uvea of mouse eye. J Cell Mol Med. 2013;17:1016–24. doi: 10.1111/jcmm.12111. [DOI] [PMC free article] [PubMed] [Google Scholar]
- 28.Rosenbaum ST, Svalo J, Nielsen K, et al. Immunolocalization and expression of small-conductance calcium-activated potassium channels in human myometrium. J Cell Mol Med. 2012;16:3001–8. doi: 10.1111/j.1582-4934.2012.01627.x. [DOI] [PMC free article] [PubMed] [Google Scholar]
- 29.Cretoiu SM, Cretoiu D, Marin A, et al. Telocytes: ultrastructural, immunohistochemical and electrophysiological characteristics in human myometrium. Reproduction. 2013;145:357–70. doi: 10.1530/REP-12-0369. [DOI] [PMC free article] [PubMed] [Google Scholar]
- 30.Sheng J, Shim W, Lu J, et al. Electrophysiology of human cardiac atrial and ventricular telocytes. J Cell Mol Med. 2014;18:355–62. doi: 10.1111/jcmm.12240. [DOI] [PMC free article] [PubMed] [Google Scholar]
- 31.Cismasiu VB, Radu E, Popescu LM. miR-193 expression differentiates telocytes from other stromal cells. J Cell Mol Med. 2011;15:1071–4. doi: 10.1111/j.1582-4934.2011.01325.x. [DOI] [PMC free article] [PubMed] [Google Scholar]
- 32.Zheng Y, Zhang M, Qian M, et al. Genetic comparison of mouse lung telocytes with mesenchymal stem cells and fibroblasts. J Cell Mol Med. 2013;17:567–77. doi: 10.1111/jcmm.12052. [DOI] [PMC free article] [PubMed] [Google Scholar]
- 33.Sun X, Zheng M, Zhang M, et al. Differences in the expression of chromosome 1 genes between lung telocytes and other cells: mesenchymal stem cells, fibroblasts, alveolar type II cells, airway epithelial cells and lymphocytes. J Cell Mol Med. 2014;18:801–10. doi: 10.1111/jcmm.12302. [DOI] [PMC free article] [PubMed] [Google Scholar]
- 34.Zheng Y, Cretoiu D, Yan G, et al. Comparative proteomic analysis of human lung telocytes with fibroblasts. J Cell Mol Med. 2014;18:568–89. doi: 10.1111/jcmm.12290. [DOI] [PMC free article] [PubMed] [Google Scholar]
- 35.Mou Y, Wang Y, Li J, et al. Immunohistochemical characterization and functional identification of mammary gland telocytes in the self-assembly of reconstituted breast cancer tissue in vitro. J Cell Mol Med. 2013;17:65–75. doi: 10.1111/j.1582-4934.2012.01646.x. [DOI] [PMC free article] [PubMed] [Google Scholar]
- 36.Vannucchi MG, Traini C, Manetti M, et al. Telocytes express PDGFRalpha in the human gastrointestinal tract. J Cell Mol Med. 2013;17:1099–108. doi: 10.1111/jcmm.12134. [DOI] [PMC free article] [PubMed] [Google Scholar]
- 37.Campeanu RA, Radu B, Cretoiu SM, et al. Near infrared low-level laser stimulation of telocytes from human myometrium. Lasers Med Sci. 2014 doi: 10.1007/s10103-014-1589-1. doi: 10.1007/s10103-014-1589-1. [DOI] [PMC free article] [PubMed] [Google Scholar]
- 38.Diaz-Flores L, Gutierrez R, Madrid JF, et al. Pericytes. Morphofunction, interactions and pathology in a quiescent and activated mesenchymal cell niche. Histol Histopathol. 2009;24:909–69. doi: 10.14670/HH-24.909. [DOI] [PubMed] [Google Scholar]
- 39.Armulik A, Genove G, Betsholtz C. Pericytes: developmental, physiological, and pathological perspectives, problems, and promises. Dev Cell. 2011;21:193–215. doi: 10.1016/j.devcel.2011.07.001. [DOI] [PubMed] [Google Scholar]
- 40.Diaz-Flores L, Gutierrez R, Garcia MP, et al. CD34+ stromal cells/fibroblasts/fibrocytes/telocytes as a tissue reserve and a principal source of mesenchymal cells. Location, morphology, function and role in pathology. Histol Histopathol. 2014 doi: 10.14670/HH-29.831. in press. [DOI] [PubMed] [Google Scholar]
- 41.Vittorio O, Jacchetti E, Pacini S, Cecchini M. Endothelial differentiation of mesenchymal stromal cells: when traditional biology meets mechanotransduction. Integr Biol (Camb) 2013;5:291–9. doi: 10.1039/c2ib20152f. [DOI] [PubMed] [Google Scholar]
- 42.Crisan M, Corselli M, Chen CW, Peault B. Multilineage stem cells in the adult: a perivascular legacy? Organogenesis. 2011;7:101–4. doi: 10.4161/org.7.2.16150. [DOI] [PMC free article] [PubMed] [Google Scholar]
- 43.Gonzalez-Cabrero J, Pozo M, Duran MC, et al. The proteome of endothelial cells. Methods Mol Biol. 2007;357:181–98. doi: 10.1385/1-59745-214-9:181. [DOI] [PubMed] [Google Scholar]
- 44.Richardson MR, Lai X, Witzmann FA, Yoder MC. Venous and arterial endothelial proteomics: mining for markers and mechanisms of endothelial diversity. Expert Rev Proteomics. 2010;7:823–31. doi: 10.1586/epr.10.92. [DOI] [PMC free article] [PubMed] [Google Scholar]
- 45.Nguyen VP, Hanna G, Rodrigues N, et al. Differential proteomic analysis of lymphatic, venous, and arterial endothelial cells extracted from bovine mesenteric vessels. Proteomics. 2010;10:1658–72. doi: 10.1002/pmic.200900594. [DOI] [PubMed] [Google Scholar]
- 46.Wang JG, Xu WD, Zhai WT, et al. Disorders in angiogenesis and redox pathways are main factors contributing to the progression of rheumatoid arthritis: a comparative proteomics study. Arthritis Rheum. 2012;64:993–1004. doi: 10.1002/art.33425. [DOI] [PubMed] [Google Scholar]
- 47.Jin GZ, Li Y, Cong WM, et al. iTRAQ-2DLC-ESI-MS/MS based identification of a new set of immunohistochemical biomarkers for classification of dysplastic nodules and small hepatocellular carcinoma. J Proteome Res. 2011;10:3418–28. doi: 10.1021/pr200482t. [DOI] [PubMed] [Google Scholar]
- 48.Gilar M, Olivova P, Daly AE, Gebler JC. Two-dimensional separation of peptides using RP-RP-HPLC system with different pH in first and second separation dimensions. J Sep Sci. 2005;28:1694–703. doi: 10.1002/jssc.200500116. [DOI] [PubMed] [Google Scholar]
- 49.Sluijter JP, Verhage V, Deddens JC, et al. Microvesicles and exosomes for intracardiac communication. Cardiovasc Res. 2014;102:302–11. doi: 10.1093/cvr/cvu022. [DOI] [PubMed] [Google Scholar]
- 50.Gherghiceanu M, Popescu LM. Cardiomyocyte precursors and telocytes in epicardial stem cell niche: electron microscope images. J Cell Mol Med. 2010;14:871–7. doi: 10.1111/j.1582-4934.2010.01060.x. [DOI] [PMC free article] [PubMed] [Google Scholar]
- 51.Crump KE, Bainbridge B, Brusko S, et al. The relationship of the lipoprotein SsaB, manganese, and superoxide dismutase in Streptococcus sanguinis virulence for endocarditis. Mol Microbiol. 2014 doi: 10.1111/mmi.12625. doi: 10.1111/mmi.12625. [DOI] [PMC free article] [PubMed] [Google Scholar]
- 52.Batinic-Haberle I, Tovmasyan A, Roberts ER, et al. SOD therapeutics: latest insights into their structure-activity relationships and impact on the cellular redox-based signaling pathways. Antioxid Redox Signal. 2014;20:2372–415. doi: 10.1089/ars.2012.5147. [DOI] [PMC free article] [PubMed] [Google Scholar]
- 53.Schulze H, Schepers U, Sandhoff K. Overexpression and mass spectrometry analysis of mature human acid ceramidase. Biol Chem. 2007;388:1333–43. doi: 10.1515/BC.2007.152. [DOI] [PubMed] [Google Scholar]
- 54.Park JH, Schuchman EH. Acid ceramidase and human disease. Biochim Biophys Acta. 2006;1758:2133–8. doi: 10.1016/j.bbamem.2006.08.019. [DOI] [PubMed] [Google Scholar]
- 55.Liu X, Cheng JC, Turner LS, et al. Acid ceramidase upregulation in prostate cancer: role in tumor development and implications for therapy. Expert Opin Ther Targets. 2009;13:1449–58. doi: 10.1517/14728220903357512. [DOI] [PMC free article] [PubMed] [Google Scholar]
- 56.Sonnenberg A, Liem RK. Plakins in development and disease. Exp Cell Res. 2007;313:2189–203. doi: 10.1016/j.yexcr.2007.03.039. [DOI] [PubMed] [Google Scholar]
- 57.Honnappa S, Gouveia SM, Weisbrich A, et al. An EB1-binding motif acts as a microtubule tip localization signal. Cell. 2009;138:366–76. doi: 10.1016/j.cell.2009.04.065. [DOI] [PubMed] [Google Scholar]
- 58.Anfosso F, Bardin N, Vivier E, et al. Outside-in signaling pathway linked to CD146 engagement in human endothelial cells. J Biol Chem. 2001;276:1564–9. doi: 10.1074/jbc.M007065200. [DOI] [PubMed] [Google Scholar]
- 59.Chen CH, Ho YC, Ho HH, et al. Cysteine-rich protein 2 alters p130Cas localization and inhibits vascular smooth muscle cell migration. Cardiovasc Res. 2013;100:461–71. doi: 10.1093/cvr/cvt207. [DOI] [PMC free article] [PubMed] [Google Scholar]
- 60.Wei J, Gorman TE, Liu X, et al. Increased neointima formation in cysteine-rich protein 2-deficient mice in response to vascular injury. Circ Res. 2005;97:1323–31. doi: 10.1161/01.RES.0000194331.76925.5c. [DOI] [PubMed] [Google Scholar]
- 61.Metcalf DJ, Nightingale TD, Zenner HL, et al. Formation and function of Weibel-Palade bodies. J Cell Sci. 2008;121:19–27. doi: 10.1242/jcs.03494. [DOI] [PubMed] [Google Scholar]
- 62.Slany A, Paulitschke V, Haudek-Prinz V, et al. Determination of cell type-specific proteome signatures of primary human leukocytes, endothelial cells, keratinocytes, hepatocytes, fibroblasts and melanocytes by comparative proteome profiling. Electrophoresis. 2014;35:1428–38. doi: 10.1002/elps.201300581. [DOI] [PubMed] [Google Scholar]
- 63.Smythies J, Edelstein L. Telocytes, exosomes, gap junctions and the cytoskeleton: the makings of a primitive nervous system? Front Cell Neurosci. 2014;7:278. doi: 10.3389/fncel.2013.00278. [DOI] [PMC free article] [PubMed] [Google Scholar]
- 64.Edelstein L, Smythies J. The role of telocytes in morphogenetic bioelectrical signaling: once more unto the breach. Front Mol Neurosci. 2014;7:41. doi: 10.3389/fnmol.2014.00041. [DOI] [PMC free article] [PubMed] [Google Scholar]
Associated Data
This section collects any data citations, data availability statements, or supplementary materials included in this article.
Supplementary Materials
Figure S1 STRING analysis of up-regulated proteins in TCs at day 5 representing the confidence view where stronger associations are represented by thicker lines.
Figure S2 STRING analysis of up-regulated proteins in ECs at day 5 representing the confidence view where stronger associations are represented by thicker lines.
Figure S3 STRING analysis of up-regulated proteins in TCs at day 10 representing the confidence view where stronger associations are represented by thicker lines.
Figure S4 STRING analysis of up-regulated proteins in ECs at day 10 representing the confidence view where stronger associations are represented by thicker lines.
Table S1 Summary of up-regulated TCs proteins (more than twofold) versus ECs 5th day.
Table S2 Summary of up-regulated ECs proteins (more than twofold) versus TCs 5th day.
Table S3 Summary of up-regulated TCs proteins (more than twofold) versus ECs 10th day.
Table S4 Summary of up-regulated ECs proteins (more than twofold) versus TCs 10th day.