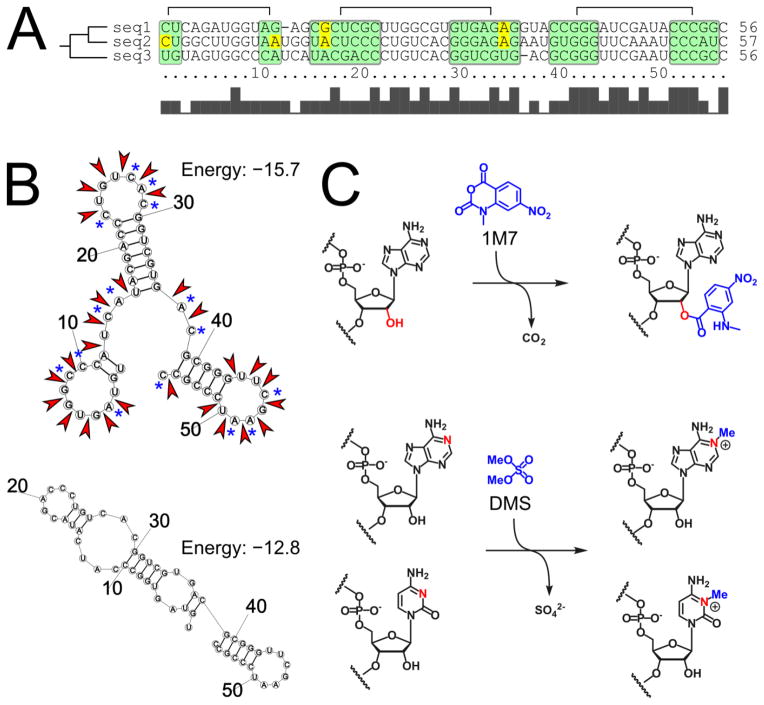
Figure 4.
RNA structure prediction and chemical mapping. A) Phylogenetic analysis of three sequences highlighting conserved base paired regions (green) and mismatches (yellow). B) Two alternative structures predicted for sequence 3 by RNAstructure (Reuter and Mathews, 2010). Red arrows indicate locations of reactive hydroxyl groups identified by 2′-hydroxyl acylation and primer extension (SHAPE). Blue asterisks indicate A and C residues susceptible for methylation by dimethyl sulfate (DMS). C) Chemical reactions underlying SHAPE and DMS mapping. 1M7 is 1-methyl-7-nitroisatoic anhydride.

