Abstract
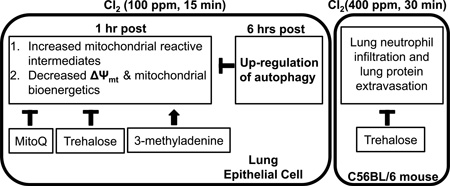
The mechanisms of toxicity during exposure of the airways to chlorinated biomolecules generated during the course of inflammation and chlorine (Cl2) gas are poorly understood. We hypothesized that lung epithelial cell mitochondria are damaged by Cl2 exposure and activation of autophagy mitigates this injury. To address this, NCI-H441 (Human lung adenocarcinoma epithelial) cells were exposed to Cl2 (100 ppm/15 min) and bioenergetics were assessed. One hour after Cl2, cellular bioenergetic function and mitochondrial membrane potential were decreased. These changes were associated with increased MitoSOX™ signal and treatment with the mitochondrial redox modulator, MitoQ, attenuated these bioenergetic defects. At six hours post exposure, there was significant increase of autophagy, which was associated with an improvement of mitochondrial function. Pre-treatment of H441 cells with trehalose (an autophagy activator) improved bioenergetic function whereas 3-methyladenine (an autophagy inhibitor) resulted in increased bioenergetic dysfunction 1 hour post Cl2 exposure. These data indicate that Cl2 induces bioenergetic dysfunction and autophagy plays a protective role in vitro. Addition of trehalose (2 vol%) in the drinking water of C57BL/6 mice for 6 weeks, but not 1 week, before Cl2 (400 ppm/30 min) decreased white blood cells in the BAL at 6 h post Cl2 by 70%. Acute administration of trehalose delivered through inhalation 24 and 1 h prior to the exposure decreased alveolar permeability but not cell infiltration. These data indicate that Cl2 induces bioenergetic dysfunction associated with lung inflammation and suggests that autophagy plays a protective role.
Keywords: chlorine, mitochondrial dysfunction, lung injury, MitoQ, trehalose, autophagy, bioenergetics, 3-methyladenine
Graphical Abstract
Introduction
Mitochondria are now emerging as key regulators of cell survival in response to stress [1] but little is known of their role in lung injury. This is particularly important for exposure to reactive toxicants, which can be released in industrial accidents or acts of terrorism. An important example is chlorine (Cl2) which is a highly irritant and reactive gas produced in large quantities throughout the world and used extensively for pulp bleaching, waste sanitation and in the manufacturing of various pharmaceuticals. It also poses significant threat to public health when inhaled. Between 1940 and 2007, the accidental release of large amounts of Cl2 in 30 large cities world-wide (such as the train derailment in Graniteville, South Carolina [2], the industrial accident in a chemical plant near Apex, NC, the malfunction of Cl2 delivery systems to a water park near Sacramento, CA (described in the local press) caused significant lung injury, which in some cases progressed, to Adult Respiratory Distress Syndrome and death from respiratory failure [2, 3]. For example, sixty tons of Cl2 were released in Graniteville, South Carolina, following a train derailment. Average Cl2 levels during a 30 min exposure period were 6, 868, 837 and 89 ppm at 0.2, 0.5, 1 and 2 km down-wind from the epicenter of the accident [4]. Eight persons died before reaching medical care; of the 71 persons hospitalized for acute health effects because of chlorine exposure, 1 died in the hospital). Twenty-five (35%) persons were admitted to the intensive care unit; the median length of stay was 3 days [2]. In addition to these public disasters, from 2000–2004, there were about 6,000 calls for Cl2 related injuries to US poison control centers for Cl2 related injuries each year.
Our previous studies suggested increased production of superoxide in the mitochondria of alveolar type II cells exposed to Cl2 [5]. However, the contribution of mitochondria originated reactive species to cellular injury following exposure of lung epithelial cells to sublethal concentrations of Cl2 gas has not been elucidated. Exposure of cells to oxidants causes bioenergetic dysfunction, and increased production of mitochondrial superoxide and hydrogen peroxide can further compromise the healthy mitochondrial population leading to increased inflammation and in extreme cases cell death [6–8].
Animals, which survive Cl2 exposure, develop severe reactive airway disease syndrome and mucous hyperplasia [9]. There is no safe exposure to Cl2: even domestic exposure to low levels of Cl2 may result in wheezing and exacerbate the clinical outcome of asthma and chronic obstructive pulmonary disease [10]. When inhaled, Cl2 reacts with water in the epithelial lining fluid hypochlorous (HOCl) and hydrochloric acid (HCl) according to the following equation: [11]:
| (1) |
At the pH of epithelial lining fluid (6.9), more than 99% of inhaled Cl2 will be converted to HOCl, which exists in equilibrium with its conjugated base hypochlorite (OCl−). As reviewed previously [12], millimolar concentrations of HOCl may be generated by activated neutrophils and eosinophils by the catalytic actions of neutrophil and eosinophil derived peroxidases on chloride (Cl−) and hydrogen peroxide (H2O2) in close proximity to the apical and basolateral membranes of epithelial cells [13, 14]. The main targets of HOCl and OCl− are sulfhydryl groups [15, 16], free amino groups of proteins, plasma amino acids [17]) and aromatic amino acids (yielding chlorotyrosine [18–20]). In addition, the interaction of HOCl with surface plasmalogens, which exist both in pulmonary surfactant and on the surfaces of epithelial cells, generates a variety of chlorinated lipids including chlorinated sterols and fatty acids, chlorohydrins and α-chloro fatty aldehydes [21]. These compounds may propagate injury after the cessation of Cl2 exposure through damage to amiloride sensitive epithelial channels contributing to the formation of pulmonary edema [12]. Our previous studies show that the effects of these reactive intermediates can be partially ameliorated, by the administration of low molecular weight antioxidants after the cessation of Cl2 exposure [5, 9, 22, 23]. However, the low bioavailability and lack of targeting to specific regions of oxidative damage limit the efficacy of these interventions.
Proteins or organelles modified by reactive species are targeted for removal by the lysosomal-autophagy systems and the selective removal of damaged mitochondria by mitophagy is a critical step in maintaining mitochondrial quality control [1, 24, 25]. However, mitophagy can fail or become overwhelmed due to increased mitochondrial superoxide/hydrogen peroxide formation suggesting that therapeutic intervention to enhance mitochondrial quality control by controlling oxidative stress may be beneficial. In support of this concept, delivery of MnSOD, an antioxidant enzyme targeting the mitochondria, protected cells and animals from hyperoxic lung injury [26, 27].
In the present study, we tested the hypothesis that acute exposure of human Clara-cell like epithelial cells (H441) to Cl2, in concentrations likely to be encountered near industrial accidents, resulted in the formation of mitochondrial superoxide, and affected mitochondrial oxygen consumption, membrane potential, and glycolysis and inhibited the activity of complexes in the mitochondrial transport chain. We then tested the ability of a mitochondria targeted redox modulator (MitoQ) to mitigate injury to the mitochondria of intact epithelial cells and evaluated the contribution of autophagy in mitigating Cl2 induced injury to the mitochondria either by treating cells with trehalose (an autophagy activator) or 3-methyladenine (3-MA, an autophagy inhibitor). Finally, we treated animals by administration of oral trehalose over 6 weeks or acute intra-tracheal trehalose prior to Cl2 exposure. We found that chronic treatment with trehalose decreased inflammatory cell infiltration whereas acute treatment attenuated leakage of protein into the BAL. Our data offers new insights into the mechanisms by which Cl2 damages epithelial cells and suggests that autophagy may play an important role in limiting the extent of injury in vitro and in vivo.
Material and Methods
Reagents
Oligomycin, antimycin A, FCCP (Carbonyl cyanide 4-(trifluoromethoxy) phenylhydrazone), pyruvate, malic acid, rotenone, sodium azide, succinate, ADP, Ascorbate, saponin, MTT (3-(4,5-Dimethylthiazol-2-yl)-2,5-diphenyltetrazolium bromide), 3-methyladenine (3-MA), N,N-Diethyl-p-phenylenediamine (DPD), and trehalose were purchased from Sigma Aldrich (St. Louis, MO). MitoSOX™ Red, MitoTracker Green, and Tetramethyl Rhodamine Methyl Ester (TMRM) were purchased from Invitrogen (Carlsbad, CA). Protease inhibitor cocktail (complete, Mini) was purchased from Roche (Indianapolis, IN). Polyclonal antibodies against microtubule-associated protein 1B light chain 3 (LC3B) was purchased from Sigma Aldrich (St. Louis, MO). Full range rainbow molecular weight markers, 4–20% SDS Page gels and secondary antibodies were obtained from Bio-Rad Laboratories Inc. (Hercules, CA).
Cell lines and cell culture
Human airway Clara-cell like H441 cells were obtained from American Type Culture Collection (Manassas, VA, USA) and were maintained in RPMI 1640 (Roswell Park Memorial Institute, Buffalo, NY) medium (Invitrogen) with 10% (v/v) Fetal Bovine Serum (FBS), 2 mM L-glutamine, and 1% penicillin-streptomycin. Cells were kept at 37°C in a humidified incubator vented with 95% air/ 5% CO2 and were used between passages 10–20. Cell cycle analysis by FACS revealed that 51% of the cells were in G1, 36% in G2 and 13% in S phase. Removing the FBS for 29 h did not alter the cell cycle. Thus, we opted to culture cells with complete media for all experimental measurements. For all extracellular flux measurements and western blots measurements, H441 cells were plated at a seeding density of 40–80,000 cells/well on specialized XF24 tissue culture plates and maintained at 37°C in a humidified incubator vented with 95% air/ 5% CO2 for up to 24 h. For immunofluorescence and FACS analysis studies, H441 cells were cultured on µ-Dish 35 mm grid-500 (ibid, LLC, Verona, WI) for 24 h.
Exposure of cells to Cl2
Immediately prior to exposure to Cl2, the normal growth medium was replaced with 50 µl of Normal Ringers (120 NaCl, 25 NaHCO3, 3.3 KH2PO4, 0.83 K2HPO4, and 1.2mM CaCl2 and MgCl2) containing ascorbic acid (AA; 1 mM), reduced glutathione (GSH; 0.12 mM) and urate (0.03 mM) (referred to as the exposure media). The concentrations of the antioxidants are similar to those in the rat epithelial lining fluid [3, 28]. Cells were then placed in a glass chamber inside a water jacketed incubator maintained at 37°C, and exposed to the desired Cl2 concentration (75–200 ppm in 5% CO2) for 15 min as previously described [5]. The presence of 25 mM HCO3 in the medium and 5% CO2 in the gas mixture maintained the pH of the exposure media to 7.4 despite the presence of a significant acid load generated by the hydrolysis of Cl2. The concentration of Cl2 in the chamber was measured continuously with an Interscan Corporations (model RM34-1000 m) Cl2 detector as described previously [23]. In addition, the consistency of the Cl2 exposure to 100 ppm for 15 min, was assessed by the measuring the OCl−-dependent oxidation of DPD (N,N-diethyl-p-phenylenediamine) which results in an increased absorbance of the oxidized dye at 509nm [29]. A standard curve was constructed by adding using known concentrations of sodium hypochlorite (NaOCl). Under these conditions the levels of OCl− shortly after exposure was estimated to be 0.13 ± 0.007 µM (mean±1SEM; n=10) and showed no significant variation between different days of exposure. These data show that the exposure of Cl2 to the cells generates HOCl in a consistent fashion between experiments. At the end of the exposure, the cells were removed from the glass chamber and placed in a different incubator where they were maintained in air/5% CO2 at 37°C for up to 24 h. Previous studies have shown that there is no significant evaporation of the medium during the exposure period [5].
Measurement of Reactive Intermediates: (I) immunofluorescence
At 1, 6 and 24 h post exposure, H441 cells were stained with MitoTracker® Green FM (100 nM), a green fluorescent mitochondrial stain which localizes in the mitochondria regardless of the membrane potential, and MitoSOX™ Red (100 nM), which also targets the mitochondria and when oxidized by superoxide, hydroxyl radicals or peroxynitrite fluoresces red (both from Life Sciences Technologies, Invitrogen) for 15 min; cells were then washed two times with HBSS and imaged with an Olympus Fluoview Confocal Laser Scanning Microscope (magnification 60X). Absorption/emission maxima for MitoSOX™ were 510/580 nm and for Mitotracker 579/599nm. Nuclei were counterstained with 4',6-diamidino-2-phenylindole (DAPI) blue fluorescent dye (Thermo Fischer Scientific Inc., Rockford, IL).
FACS analysis
At 1, 6 or 24 h post exposure, H441 cells were washed once with PBS and lifted from the plates by addition of 0.25% trypsin and 1 mM EDTA; trypsin was neutralized by addition of complete media and samples were centrifuged for 2 min at 400g to pellet the cells; subsequently pellets were washed two times with HBSS, and incubated with MitoSOX™ Red (100 nM) for 15min. Flow Cytometry analysis was performed with a Becton Dickinson BDLSRII cytometer using the 488nm Argon ion laser for excitation of MitoSOX™ associated fluorescence; the fluorescent signal was detected using a 556 longpass and a 575/25 nm bandpass filters. Data were analyzed using BD FACSDiva v6.1.3 software (BD Biosciences, San Jose, CA). Following the initial analysis, MitoSOX™ histogram overlays were then generated using FloJo 7.6 (Tree Star, Ashland, OR) software.
Apoptosis and necrosis
H441 cells were exposed to 100 ppm Cl2 for 15 min. One-hour later cells were washed with PBS, lifted from the plates by trypsinization, and incubated with Annexin V FITC/Propidium Iodide (Cayman Chemical Company, MI, USA) according to the manufacturer’s specifications. Flow Cytometry analysis was performed with a Becton Dickinson BDLSRII cytometer. Data were analyzed using BD FACSDiva v6.1.3 software (BD Biosciences, San Jose, CA).
Mitochondrial membrane potential
At either 0.5 h or 5.5 h post exposure, a fraction of H441 cells were incubated with the mitochondrial uncoupler FCCP (10 µM) while others were left in ELF. After another 30 min the cell permeant, cationic dye Tetramethyl Rhodamine Methyl Ester (TMRM; 100 nM; Life Science Technologies, Invitrogen), which is sequestered by active mitochondria, was added into the media for 30 min. At the end of this period, extracellular fluorescence was quenched by the addition of trypan blue for 5 minutes and fluorescence levels were measured with a micro plate reader (BMC FLUOstar OPTIMA Microplate Reader; BMG LABTECH Inc., Cary NC). Results are expressed as the (TMRP-FCCP) fluorescence.
Cellular Bioenergetics
Oxygen consumption rates (OCR) were determined using an Extracellular Flux Analyzer (XF24) from Seahorse Biosciences (North Billerica, MA) which measures O2 consumption in intact cells [30]. At 0.5, 5.5 and 23.5 h post exposure, H441 cells were washed with XF-DMEM (DMEM base media supplemented with 5 mM Glucose, 4 mM L-glutamate, 1 mM Pyruvate, pH 7.4 at 37°C) before the assay and allowed to equilibrate in this medium for 30 min. Basal respiration in these cells varied between 200 and 300 pmol O2/min over the course of these experiments and for this reason data is expressed in % in some cases to aid comparison between data. Mitochondrial function assays were performed and analyzed as described previously [30, 31]. In brief, following measurements of basal rate of oxygen consumption, oligomycin (1 µg/ml), FCCP (0.75 µM) and antimycin-A (10 µM) were injected sequentially. The ATP linked OCR was calculated as the difference rates prior to and following addition of oligomycin; Maximal Oxygen Consumption rate as the difference of the FCCP and antimycin-A rates; The bioenergetic reserve capacity is the difference between the maximal and basal OCR rates and represents the mitochondrial function that can be used for increased energy demand during stress; the non-mitochondrial OCR was the remaining OCR after injection of antimycin-A[32]. All rates were corrected for protein levels to account for changes in cell viability in response to Cl2. Extracellular acidification rate (ECAR), an indicator of glycolysis, was measured in parallel with the OCR under the same conditions; the Maximal ECAR was ECAR after Oligomycin injection. To assess the contribution of increased levels of reactive intermediates to OCR, in some experiments, H441 cells were pretreated with MitoQ (100 nM), which is a concentration shown to have little or no effect on mitochondrial function in cell culture [33], or a corresponding amount of vehicle for 1 h prior to being exposed to Cl2. To measure the effects of Cl2 on mitochondrial bioenergetics, we permeabilized Cl2 exposed H441 cells using saponin, added substrates for Complexes I, II or IV as described [34], and measured oxygen consumption rates.
Autophagy
At different time-points post Cl2 exposure, cells were lysed by incubating them with RIPA lysis buffer (Thermo Scientific, Rockford, IL, USA) containing protease inhibitors at 4°C for 30 min. Samples were then centrifuged for 20 minutes at 14000 g, and protein concentrations were measured using a bicinchoninic acid (BCA) assay kit (Thermo Scientific) or Lowry DC Protein Assay (Bio-Rad) as previously described [35]. Equal amounts of proteins were loaded into 4–20% Tris·HCl Criterion precast gels (Bio-Rad Laboratories, Hercules, CA) and transferred to polyvinylidene fluoride membranes (Bio-Rad Laboratories). Non-specific sites were blocked with 5% nonfat dry milk in PBS and probed with an antibodies against either LC3B (Sigma-Aldrich, Saint Louis, MO, USA) or p62/SQSTM1 (Novus Biologicals, Littleton, CO, USA) proteins overnight at 4°C. Membranes were then washed and probed with a secondary antibody conjugated to horseradish peroxidase (HRP) and the signal detected by the addition of chemiluminescence substrate and exposure to Fuji medical X-ray films (Fujifilm Medical Systems, Stamford, CT). Densitometry was performed with AlphaView SA software (ProteinSimple, Santa Clara, CA); signals were normalized to total loaded protein, as quantified by Amido black (Sigma-Aldrich, Saint Louis, MO, USA) staining of the same membrane at the end of the experiment, to control for possible differences in loading. To assess the extent of autophagic flux, H441 cells were pre-incubated with chloroquine (40 µM), a lysosomotropic agent that inhibits lysosomal activities for 2 h prior to exposure to Cl2 [24, 36]. In some experiments, H441 cells were incubate with trehalose (25 mM; a natural alpha-linked disaccharide formed by an α,α-1,1-glucoside bond between two α-glucose units shown to enhance autophagy via an mTOR independent pathway; [37]) or with 3-methyladenine (3-MA, 1 mM; a phosphoinositide 3-kinase inhibitor) which suppresses autophagy [31] for 24 h. Measurements of cellular bioenergetics in Cl2 exposed cells were then repeated as described above. In other studies, we assessed whether pre-treatment of H441 cells with Trehalose decreased apoptosis/necrosis as described above.
In vivo studies
Mice were treated with Trehalose using 2 protocols. In the first Trehalose (2 vol%) was added in the drinking water of C57BL/6 mice for 6 weeks. Mice were then exposed to a sublethal concentration of Cl2 (400 ppm for 30 min) as described previously [5] and returned to room air for 6 h. At that time, they were sacrificed and their lungs were lavaged with two separate 1 ml washes of sterile normal cells. Cells were pelleted by centrifuging the BAL at 1500 g for 5 min at 4°C. Total number of cells was determined with a hemocytometer; cells were then cytospan onto glass slides, stained with Diff-Quick™ Stain (Siemens, USA) and number of macrophages, neutrophils and lymphocytes determined.
In the second protocol, mice breathed aerosolized trehalose or vehicle generated by an AirLife Brand Misty Max 10TM Disposable Nebulizer for 20 min at 1 and 23 h pre-exposure to Cl2 gas (400 ppm for 30 min). This nebulizer delivers aerosols with mass median aerodynamic diameter of 2.2 µM with a GSD of 2 µM at a flow rate of 5 L/min. The Inhaled dose (ID) is calculated from the following equation (online supplement of [23] ), ID= CT x VE x T, where CT = aerosol concentration (mg/L), VE = minute ventilation (L/min), and T = aerosol delivery time (min). The aerosol concentration was calculated by placing a filter in the place of the mouse and calculating net weight gain over the exposure period. Based on the mean geometric diameter of our aerosolized particles (2.2 µm), 40%, and 5% of the inhaled trehalose reaches the upper airways distal lung spaces respectively. The calculated deposited dose in their distal lung spaces was 0.1 mg. Control mice receive aerosol vehicle alone. One hour after the second aerosol delivery, mice were exposed to Cl2 (400 ppm for 30 min) and returned to room air. Six h later they were sacrificed, their lungs lavaged with 1 ml of fluid, and the protein concentration in the BAL was measured as an index of alveolar epithelial injury. Levels of LCB3 in lung tissues were assessed by Western blotting as described above measured in lung tissues to assess levels of autophagy.
Statistics
All experimental results are presented as means ± SE. Student's t-test was used for statistical analysis for comparison of two groups. The comparison of statistical significance among three or more groups was determined by one-way analysis of variance (ANOVA) followed by pairwise comparisons with Tukey's test.
Results
Mitochondrial Bioenergetics after Chlorine Exposure
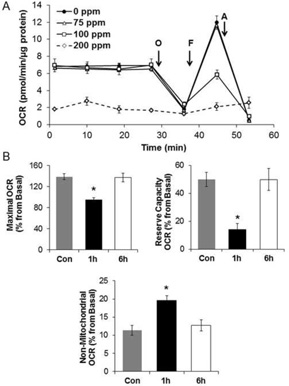
In the first series of experiments, we determined the effects of Cl2 on cellular bioenergetics. Figure 1A shows oxygen consumption rates (normalized for levels of cellular protein) for H441 cells exposed to 75, 100, and 200 ppm Cl2 for 15 min and returned to room air for 1 h. Exposure to 100 ppm Cl2 had no effect on basal respiration but resulted in significant decrease of the maximal mitochondrial respiration, and the bioenergetic reserve capacity, an index of cellular energy for repair and protection against oxidative stress (Figure 1B) [32]. There was also an increase in non-mitochondrial respiration (measured post-antimycin injection) consistent with a potential increase in oxygen consuming processes capable of generating reactive oxygen species. The identity of the non-mitochondrial oxygen consuming processes is unknown at the present time. These changes were transient and returned to baseline at 6 h post exposure. In contrast, at 1 h, post exposure of H441 cells to 200 ppm Cl2 for 15 min basal oxygen consumption was decreased to almost zero and this change was not reversible. Thus, for all subsequent studies, H441 cells were exposed to 100 ppm for 15 min and measurements were performed at 1 or 6 h post exposure.
Figure 1. Effects of Cl2 on mitochondrial bioenergetics in H441 cells.
(A) Oxygen consumption rates (OCR; pmol/mg/µg protein) of H441 cells exposed to different concentrations of Cl2 (75, 100, and 200 ppm, 15 minutes) and returned to 95% air/5% CO2 for 1 h in at 37°C. Control cells (0 ppm) were exposed to 95% air/5% CO2. Following measurements of basal OCR, oligomycin (O; 1 µg/ml), FCCP (F; 0.75 µM) and antimycin-A (A; 10 µM) were injected sequentially into the chambers. Values are means ± SEM; n=7–10 samples each for each group. (B) Bioenergetics profile of H441 cells exposed to 95% air/5% CO2 (Con) or Cl2 (100 ppm, 15 min) and returned to 95% air/5% CO2 for 1 or 6 h. Maximal OCR is obtained after FCCP stimulated OCR minus the non-mitochondrial, and reserve capacity is the difference between FCCP stimulated minus basal OCRs. Basal values (100%) are the values for each condition just prior addition of oligomycin. Results are means ± SEM of 3 independent experiments,*p <0.05 compare to control.
To ensure that the observed changes in mitochondrial bioenergetics were not due to Cl2 induced cell injury we exposed H441 cells to Cl2 (100 ppm for 15 min) and measured the extent of necrosis and apoptosis when returned to room air. As can be seen in supplementary Figure 1, exposure to Cl2 did not alter the number of necrotic cells at either 1 or 6 h post exposure. There was a small, but not significant change, in the number of late apoptotic cells.
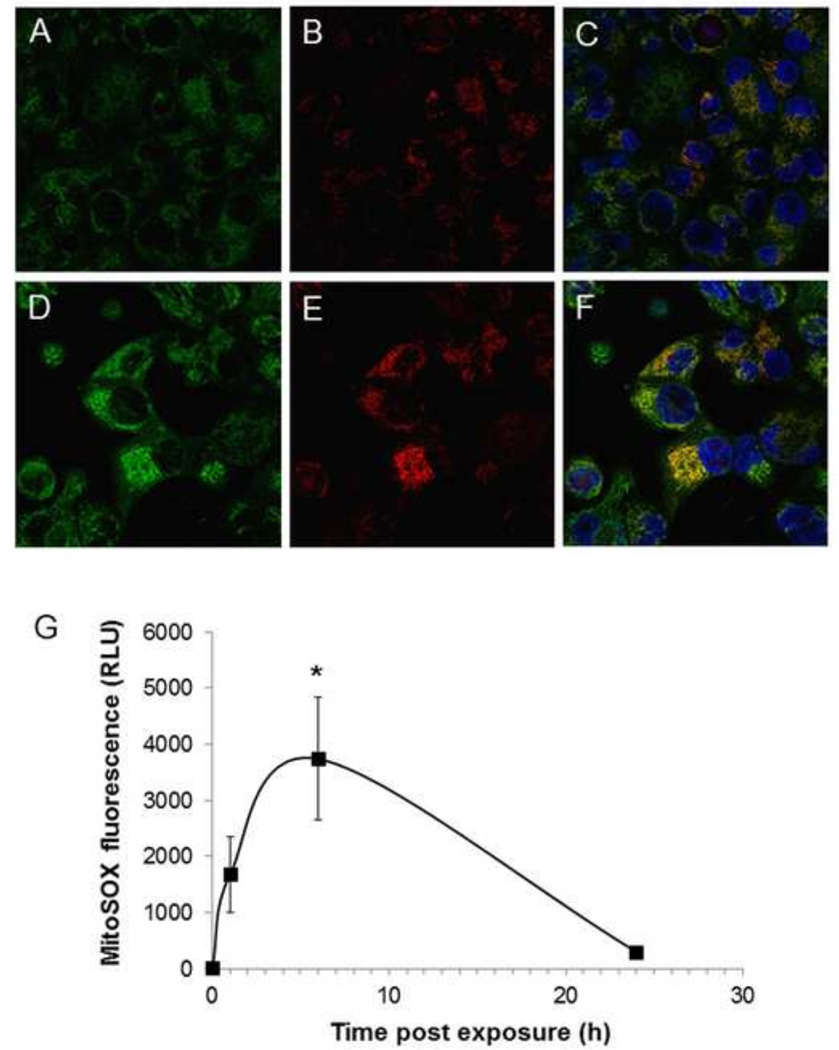
In the next series of experiments, we assessed levels of mitochondrial oxidation of MitoSOX™ in H441 cells exposed to Cl2 and returned to 95% air/5% CO2. At 1 h post exposure there was a significant increase in MitoSOX™ fluorescence in a fraction of the H441 cells (Figure 2B, E) which co-localized with Mitotracker green (Figure 2C, F). FACS analysis of H441 cells showed significant increase of MitoSOX™ associated-fluorescence at 1 and 6 h post Cl2 exposure and returned close to basal levels at 24 h (Figure 2G). However, MitoSOX™ fluorescence at 24 h was still significantly higher than control. There are limitations to the measurement of mitochondrial superoxide/hydrogen peroxide with MitoSOXTM and the underlying mechanism is not clear but they are consistent with an intra-mitochondrial pro-oxidant process [38]. Importantly, these findings are consistent with our previous data showing elevated levels of reactive species in primary cultures of alveolar type II cells at 24 h post Cl2 exposure as measured by electron spin resonance [5].
Figure 2. Exposure to Cl2 increases mitochondrial superoxide/hydrogen peroxide.
H441 cells immersed in 50 µl of artificial ELF were exposed to 95% air/5% CO2 as control (A–C) or Cl2 (D-F; 100 ppm for 15 min) and returned to 95% air/5% CO2 for 1 h. Prior to imaging with confocal laser microscopy cells were incubated with MitoSOX™ (100 nM; red color) for 15 min. and MitoTracker (100 nM; green color). Most of Cl2 exposed H441 cells showed higher levels of red fluorescence compared to controls (panels E and B). MitoSOX™ fluorescence localized with MitoTracker (F; yellow color) consistent with the presence of reactive species in mitochondria. Nuclei were counterstained with DAPI (blue). Representative images from three independent experiments are shown. (G) H441 MitoSOX™ fluorescence quantified by FACS analysis at the indicated times post Cl2 (100 ppm for 15 min). Means ± SEM from three independent experiments; *p<0.005 compared to control.
Contribution of Mitochondrial Oxidative Stress to Cl2-Dependent Bioenergetic Dysfunction
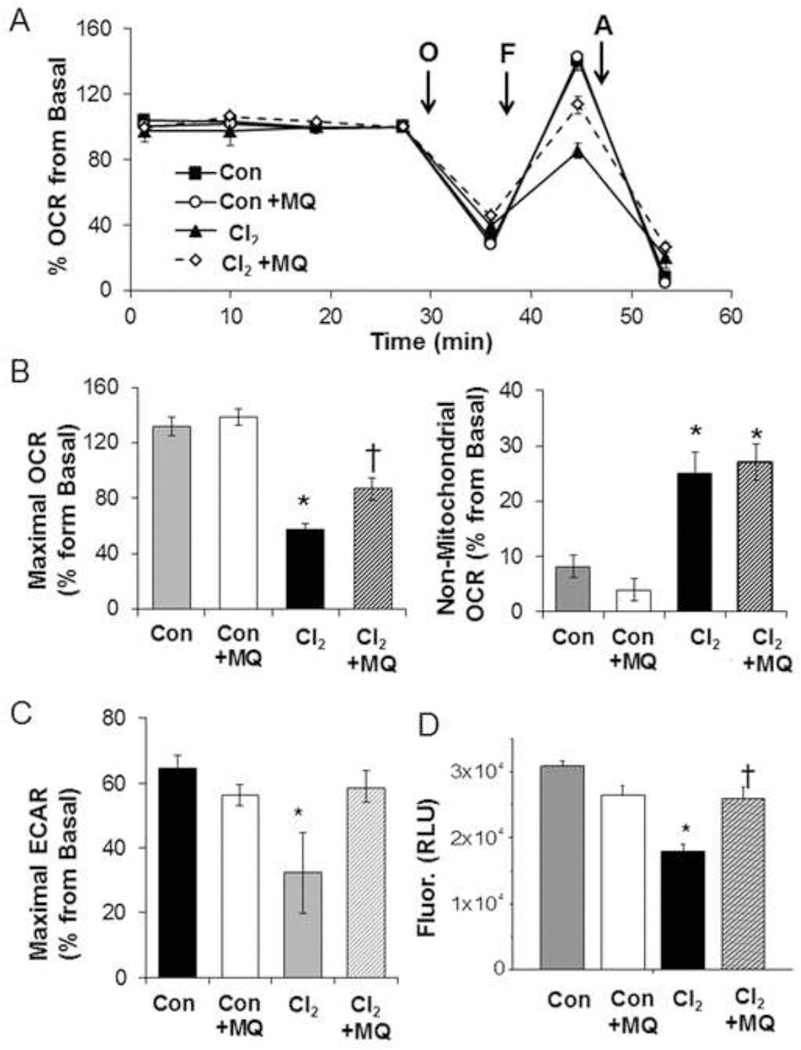
In the next series of experiments, we evaluated the potential contribution of mitochondrial oxidative stress to inhibition of cellular bioenergetics. As shown in Figure 3 A, B, pre-treatment of H441 cells with MitoQ (100 nM) for 1 h partially prevented the Cl2-dependent decrease of Maximal OCR but did not affect non-mitochondrial OCR. The oxygen consuming processes, which contribute to this value, are unknown in this cell type and may not be mitochondrial in origin. To determine whether the targeting triphenylphosphonium group of MitoQ mediated the protective effects experiments were performed with decylTPP which lacks the quinol group [33]. At the same concentration of MitoQ, which attenuated the loss of maximal respiration on Cl2 exposure the non-redox active compound showed no effect (result not shown). We also measured changes in extracellular acidification (ECAR), which represents the compensatory increase in glycolysis when mitochondrial ATP synthesis is inhibited [30]. Exposure to Cl2 resulted in a significant decrease in the Maximal ECAR (calculated as the oligomycin stimulated ECAR-basal ECAR) which was partially prevented by MitoQ (Figure 3C). Exposure to Cl2 also decreased the mitochondrial membrane potential and MitoQ pretreatment prevented this change (Figure 3D).
Figure 3. MitoQ (MQ) mitigates Cl2 induced injury.
(A) OCR of H441 pre-treated with MitoQ (100 nM) or vehicle (DMSO) for 1 h and then exposed to Cl2 (100 ppm/15 min) or 95% air/5%CO2 (Con) and returned to 95% air/5% CO2 for 1 h. Results of a typical experiment which was repeated twice. Values are means ± SEM; n= 8–10 samples per group. Values for each group are expressed as % of their corresponding basal values just prior to the addition of oligomycin since basal values varied between cell preparations (200–300 pmoles O2/min). (B) Quantification of Maximal and Non-Mitochondrial OCR (C) Quantification of Maximal Extracellular Acidification Rates (ECAR). Values were corrected for protein levels and expressed as % of basal values (as described in panel A). Means ± SEM; n=8–10 samples. (D) FCCP sensitive portion of TMRM (tetramethylrhodamine methyl ester) fluorescence as an index of mitochondrial membrane potential. Values are means ± SEM; n=40–45 samples from three different experiments,*p<0.05 compared to control, † p<0.05 compared to Cl2.
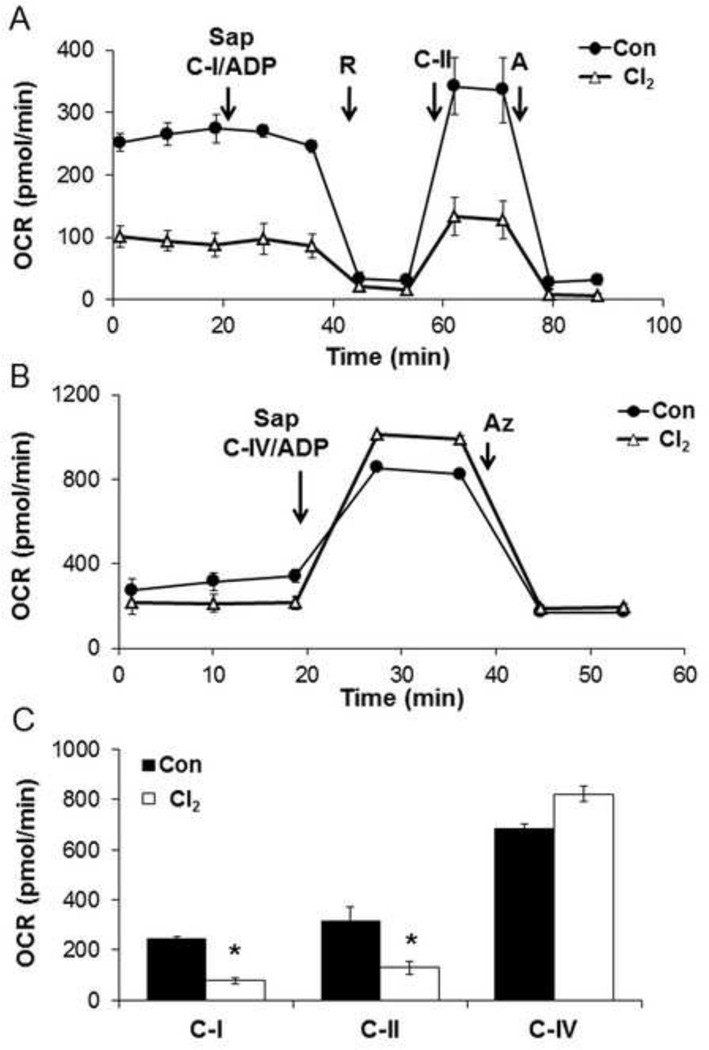
Using the same Cl2 exposure protocol the effects on the mitochondrial electron transport chain were determined using selective permeabilization of the plasma membrane with saponin and addition of mitochondrial substrates to measure State 3 complex I and II linked respiration in the presence of ADP [34]. As shown in Figure 4A a basal measurement saponin is added and complex I linked substrates with ADP, followed rotenone were added. The decrease in OCR on the addition of rotenone is ascribed to complex I. Next complex II substrates are added and the oxygen consumption is stimulated and inhibited by antimycin. Figure 4B shows the results for the complex IV using the artificial electron donors ascorbate/TMPD in the presence of ADP, which stimulates the oxygen consumption rate, which is inhibited by sodium azide, a complex IV inhibitor. The calculated mitochondrial complex activities are shown in Figure 4C and demonstrate significant inhibition by Cl2 of both complexes I and II but not complex IV.
Figure 4. Effects of Cl2 on mitochondrial function in permeabilized H441 cells.
H441 cells were exposed to air (Con) or Cl2 100 ppm/15 minutes and returned to 95% air, 5% CO2 for 1 hr. Basal oxygen consumption rate was established then (A) saponin (Sap; 10 µg/ml, which permeabilized cell membranes) con-injected with substrates for complex I (5 mM Pyruvate/2.5 mM Malate and 1 mM ADP), then rotenone (R; 1 µM), substrates for complex II (10 mM Succinate and 1 mM ADP), and Antimicin-A (A; 10 µM) were added (B) Saponin and substrates for complex IV (0.5 mM TMPD/2 mM Ascorbate and 1 mM ADP), then Azide (AZ; 20 mM) were added. (C) OCR due to complex-I, II, and IV were calculated from 3 independent experiments. Values are means ± SEM; n=5=7 per group,*p<0.05 compared to control.
The Impact of Cl2 Exposure on Autophagy
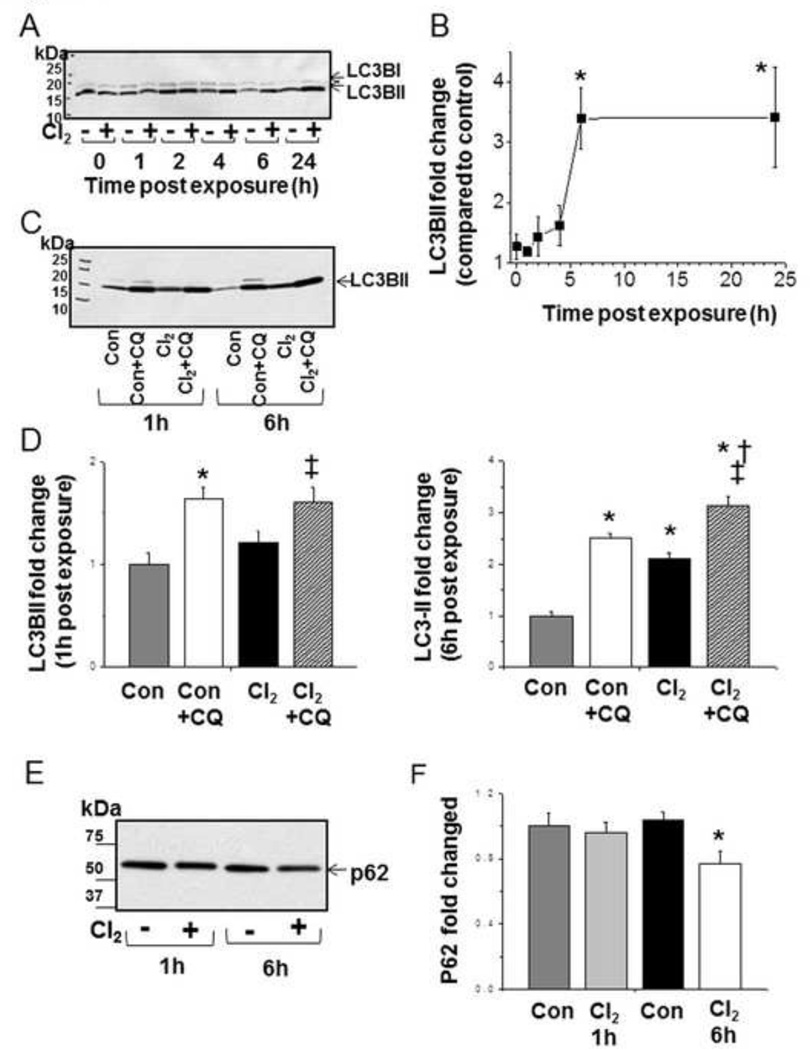
Maintaining mitochondrial quality control through removing damaged mitochondria is an important property of macroautophagy [32]. To determine if autophagy is activated in response to Cl2 exposure we first determined the levels of LC3-II in H441 cells at 1–24 h post exposure, and found increased LC3-II levels 6 h post-exposure that was sustained at 24 h (Figures 5 A-B). To determine whether the increase in LC3-II was due to upregulation of autophagy or decreased autophagic flux, we measured LC3-II levels in H441 cells pre-treated with chloroquine and then exposed to Cl2. As shown in Figures 5C, and D, significantly higher levels of LC3-II were observed in chloroquine-treated cells exposed to Cl2 as compared to those treated with chloroquine alone. These data support the hypothesis that exposure to Cl2 increased autophagy. Concomitantly, at 6 h post-exposure there was a significant decrease of p62 protein, consistent with increased autophagy. (Figure 5E, F). Furthermore, the fact that chloroquine (which inhibits autophagic flux by inhibiting lysosomal activities) further increased levels of LC3-II at 6 h post Cl2 exposure indicates that autophagy was not maximal. These results support the conclusion that increased levels of LC3-II were due to increased autophagy per se rather than inhibition of autophagic flux.
Figure 5. Cl2 induces autophagy in H441 cells.
H441 cells were exposed to either air or Cl2 100 ppm/15 minutes and returned to 95% air, 5% CO2. Cells were lysed at time points indicated: 0, 1, 2, 4, 6, and 24 h post Cl2 exposure. Equal amounts of protein were loaded on the 4–20% SDS Page gel. (A) Western blots with a primary antibody against LC3B. Both LC3-I and LC3-II bands, indicated by the upper and lower arrows, are shown for the indicated times post exposure to Cl2 (+) or 95% air/5% CO2 (-). (B) Quantitation of LC3BII band (expressed as % increase of the corresponding 95%air/5% CO2 value for the same time interval). Values are means ± SEM; n=4–5 for each time point, * p<0.05 compared to the air value. (C) Western blots for LC3B after incubation of H411 cells with chloroquine (CQ; 40 µM) for 2 h or control prior to exposure to Cl2 (100 ppm, 15 min) and returned to 95%air/5% CO2 for the indicated periods of time (1 and 6 h). (D) Quantification of Western blots shown in C. (E) Typical Western blots for p62 at 1 and 6 h post Cl2 exposure. Control (-) or Cl2 (+; 100 ppm/15 min). (F) Quantification of western blots (fold increase compared to corresponding control values). Values are mean ± SEM.; n=5–6 per condition, *p <0.05 compared to control, † p <0.05 compared to control + CQ, ‡ p <0.05 compared to chlorine.
The Impact of Autophagy on Bioenergetics in Cells with Cl2 Exposure
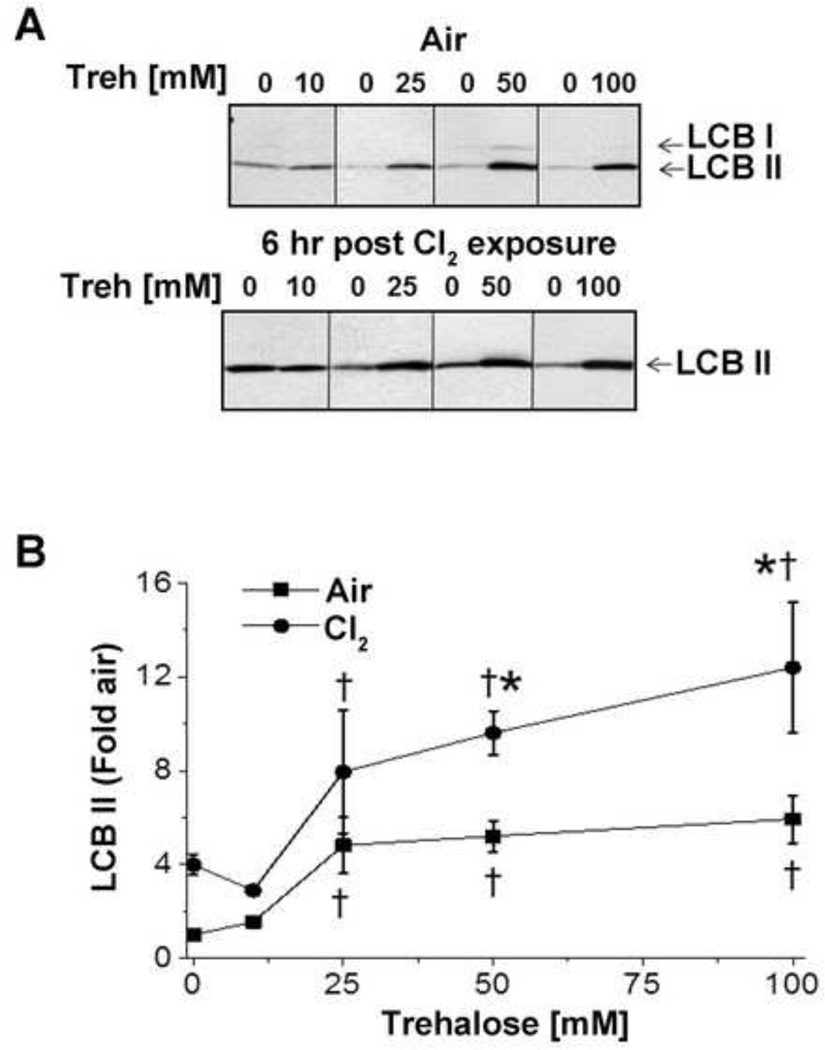
In our next series of experiments, we tested whether autophagy was beneficial in the amelioration of Cl2 induced injury to the mitochondria by pre-treating the cells with trehalose, a disaccharide that activates autophagy through the mTOR independent pathway for 6 weeks [39]. As shown in Figures 6A–B pre-treatment of H441 cells with trehalose resulted in a concentration dependent increase of LC3-II levels; an additional increase of LC3-II was observed 6 h post Cl2 exposure. The increase of autophagy at 6 h post Cl2 exposure was associated with the recovery of cellular bioenergetics (Figure 1). Pretreatment of H441 with trehalose did not alter the number of necrotic or apoptotic cells (data not shown).
Figure 6. Trehalose pretreatment induces autophagy in H441 cells.
(A) H441 cells were pretreated with 10, 25, 50 or 100 mM trehalose (Treh) or vehicle for 24 h. Some of these cells were then exposed to Cl2 (100ppm/15 min) and returned to 95%air/5% CO2 for 6 h; control cells were kept at 95%air/5% CO2 for 6 h. At the end of 6 h, cells were lysed and levels of LC3 determined by western blotting using antibodies against LC3B as described in Figure 4. (B) Fold increase of H441 LC3BII 6 h post Cl2 (100 ppm, 15 min) as compared to control treatment. Values are means ± SEM; n=3–11 independent experiments. * p<0.05 compared to the corresponding Air values; † p <0.05 compared to the corresponding vehicle (no trehalose) values.
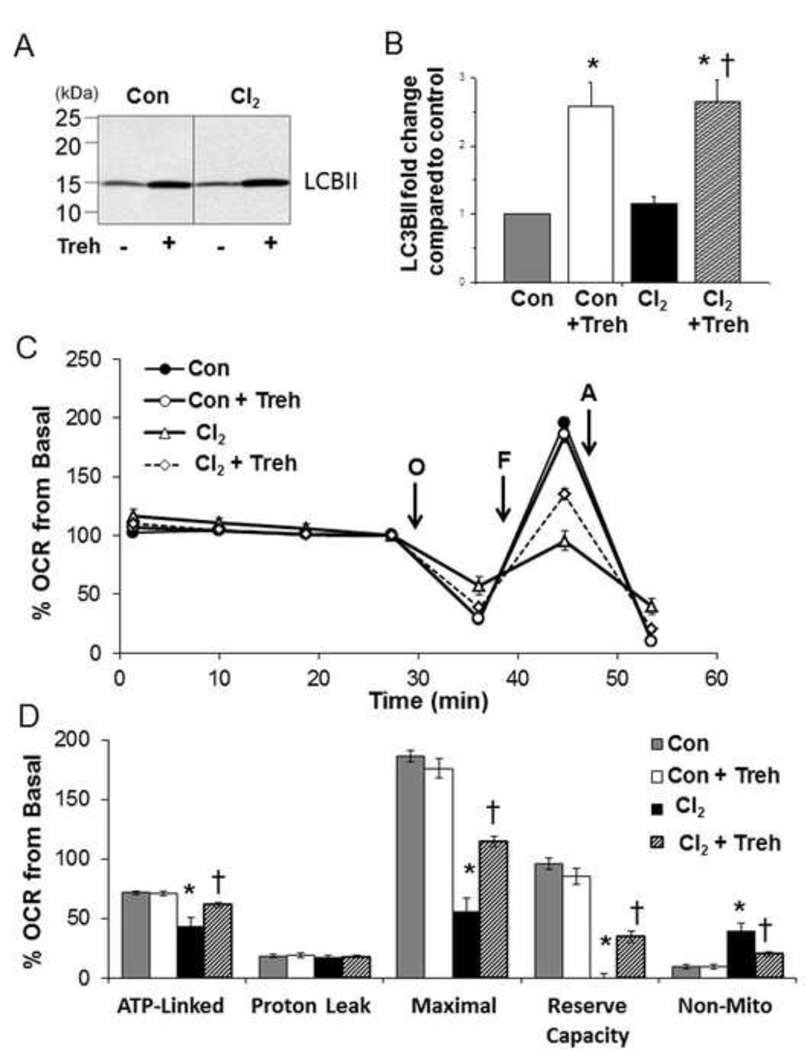
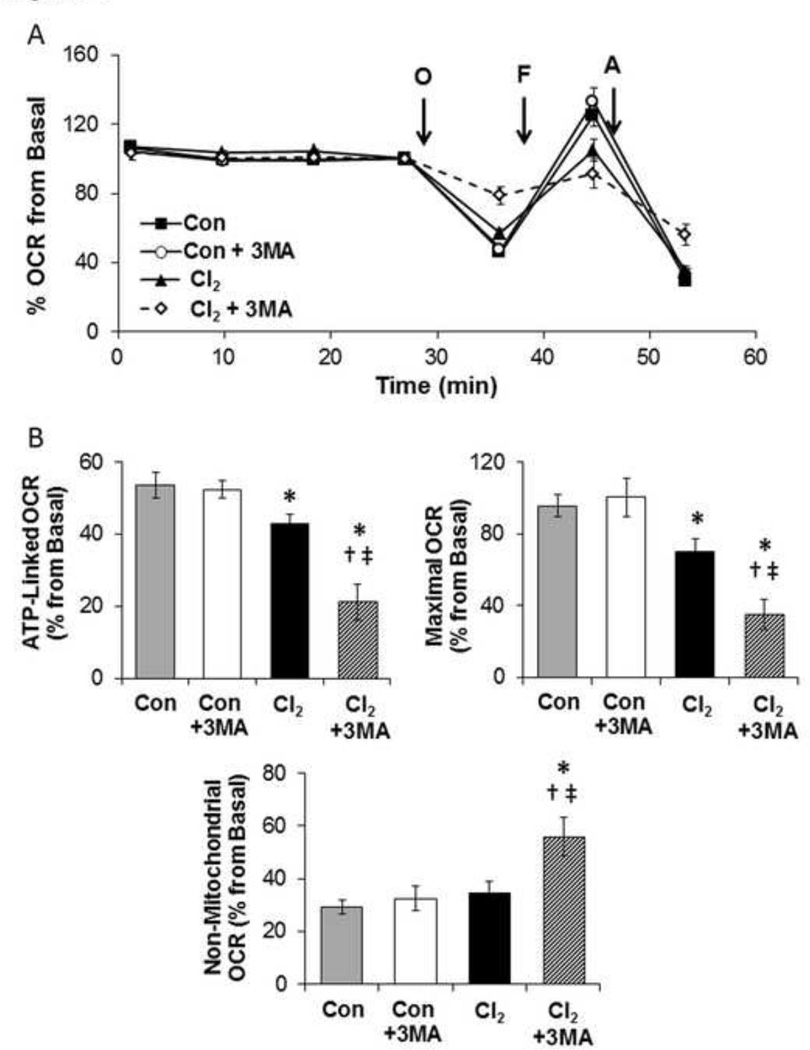
Next we tested whether upregulation or inhibition of autophagy by treatment of H441 cells with 25 mM trehalose or 3-MA (an inhibitor of autophagy) altered the cellular bioenergetics of Cl2 exposed H441 cells. As shown in Figure 7 A-B, pretreatment of H441 with trehalose (25 mM) increased LC3-II levels by 2.5 fold at 1 h post Cl2. Furthermore, pretreatment of H441 cells with 25 mM trehalose mitigated largely the Cl2 induced decrease of maximal oxygen consumption at 1 h post exposure (Figures 7 C-D) and decreased non-mitochondrial OCR. Conversely, pre-treatment of H441 cells with 3-MA exacerbated the detrimental effects of Cl2 on ATP-linked, maximal and non-mitochondrial oxygen consumption rates on H441 cells (Figures 8A–B).
Figure 7. Trehalose mitigates decrease of cellular bioenergetics of Cl2 exposed H441 cells.
H441 cells were pre-treated with trehalose (Treh; 25 mM) or vehicle for 24 h and then exposed to either Cl2 (100 ppm, 15 min) or control (95%air/5% CO2). (A) Western blots at 1 h post Cl2. (B) Quantification of western blots shown in A. Values are means ± SEM; n=4. (C) Representative trace of OCR measurements of trehalose pre-treated cells 1 h post Cl2 exposure. All conditions are as described above. Values are means ± SEM; n=5–6 samples per group. (D) Bioenergetic profile from 3 independent experiments. Mean ± SEM; n=3 of oxygen consumption rates (expressed as % of basal). *p<0.05 compared to control, † p<0.05 compared to chlorine.
Figure 8. 3-MA exacerbates Cl2-induced mitochondrial injury.
H441 cells were treated with 3-MA (1 mM; a phosphatidylinositol 3-kinase inhibitor) for 24 h prior to exposure to Cl2 (100 ppm, 15 min) or control (95%air/5%CO2). Cellular bioenergetics was measured 1 h post exposure. (A) Representative trace of OCR is shown. (B) Quantification as % form basal of ATP-linked, Maximal OCR, and non-mitochondrial oxygen consumption rates. Means ± SEM; n=14–17, from two independent experiments, * p<0.05 compared to control, † p<0.05 compared to Control + 3MA, ‡ p<0.05 compared to chlorine.
Trehalose decreases Cl2 induced inflammation and the increase of alveolar permeability in vivo
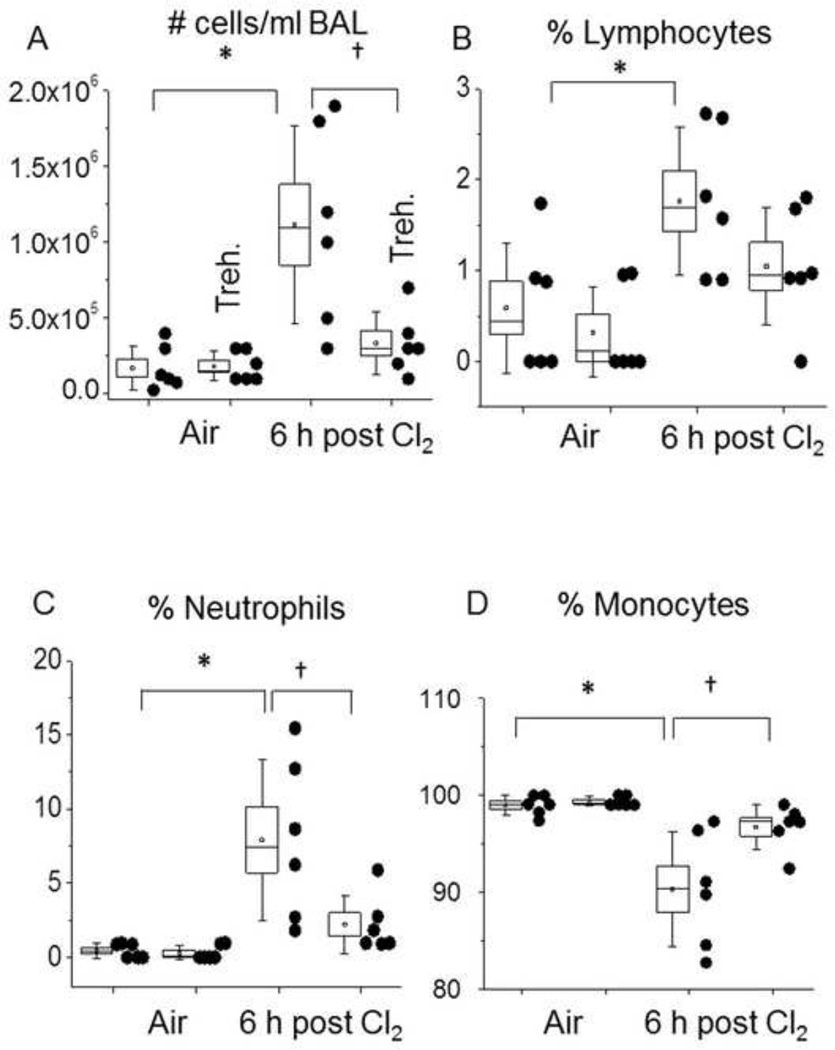
We have previously shown that Cl2 exposure in vivo results in pulmonary inflammation, increased permeability, and leukocyte infiltration[40, 41]. To assess the impact of autophagy on Cl2-dependent lung injury we used two different protocols. In the first protocol, we used an established regimen for trehalose dosing through oral administration for 6 weeks [42]. After Cl2 exposure, the cellular infiltration was determined as shown in Figure 9. As expected in the control animals, almost 100% of cells in BAL were alveolar macrophages. In Cl2 treated mice receiving vehicle the total number of cells/ml BAL increased substantially at 6 h post Cl2 exposure. There were significant increases in the % of neutrophils (from zero to 8%) and lymphocytes (from 0.5 to 1.8%) and a concomitant decrease in alveolar macrophages. Administration of trehalose decreased the number of cells in the BAL to the corresponding air control values. Furthermore, most of the cells were macrophages instead of lymphocytes or neutrophils. Under these conditions, no decrease in the Cl2-dependent increase in alveolar permeability was seen as assessed by BAL protein (result not shown).
Figure 9. Trehalose decreases leukocyte infiltration into BAL in Cl2 exposed mice.
Trehalose (2 % g/vol) was added in the drinking water of C57BL/6 mice for 6 weeks. Animals were exposed to 400 ppm Cl2 for 30 min, returned to room air, sacrificed at 6 h post exposure and their lungs lavaged with 2 ml of saline as described previously [41]. (A) Total # cells in BAL; (B) Lymphocytes (% of total cells); (C) neutrophils (% of total cells); (D) alveolar macrophages (% of total cells). Individual points represent measurements for individual mice. The box shows one standard error of the mean; the whiskers one standard deviation; the straight line inside the box is the median and the little square the mean; * † p<0.05 as indicated. *p<0.05 compared to control, †p<0.05 compared to Chlorine.
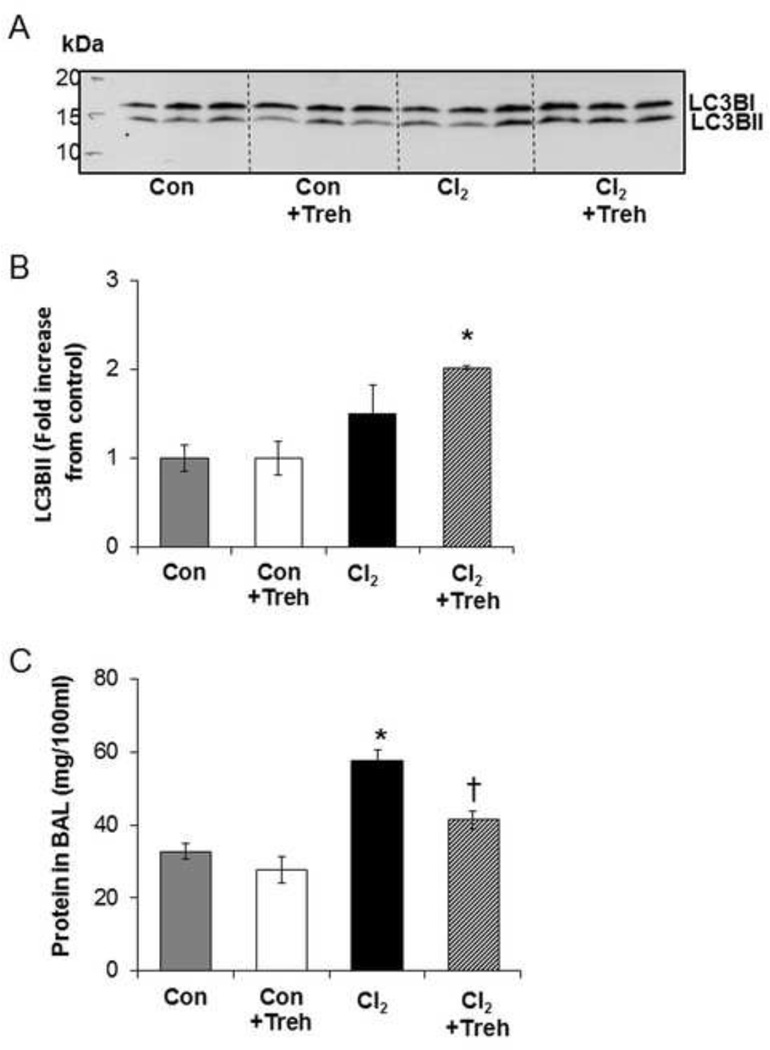
The second protocol models an acute trehalose treatment protocol directly into the airway through aerosolization. As shown in Figure 10, aerosolized trehalose administered at 1 and 23 h pre-exposure increased LC3B2 levels in lung tissues, collected 6h post exposure, only in Cl2 exposed animals. Exposure to Cl2 induced an approximately 2 fold increase in the protein in BAL consistent with increased alveolar and capillary permeability to plasma proteins (Figure 10C), as reported previously [41]. Using the same trehalose treatment protocol there was no effect on protein in the BAL for the control but a striking decrease in protein in the BAL of trehalose and Cl2 exposed mice (63% ).
Figure 10. Trehalose upregulates autophagy in mouse lung.
Mice were pretreated with trehalose or vehicle prior to exposure to Cl2 (400 ppm for 30 min). At 6 h post exposure, lung tissue were isolated and homogenized with RIPA lysis buffer. (A) Equal amounts of protein were loaded on the 4–20% SDS Page gel. Proteins were transferred to PVDF membrane and western blot was done using primary antibody against LC3B. (B) Quantification of LC3B fold increase form control. (C) Trehalose mitigates Cl2 induced increase of blood-gas barrier permeability in C57Bl/6 mice. Measurements of total protein in the BAL of mice 6 h post exposure to air or Cl2 (400 ppm for 30 min). Mice inhaled trehalose or vehicle via nose only aerosol at 23 and 1 h prior to exposure to Cl2. Data are expressed as means ± SEM. N=3 per group, *p<0.05 compared to control, †p<0.05 compared to Cl2 value.
Discussion
Exposure of the airways to chlorine (Cl2) gas is an important occupational hazard, which lacks effective treatments and a mechanistic understanding of its toxicity. The potential damage to the mitochondrion and the engagement of the autophagy pathway has not been previously considered. Previously, we have shown using electron spin resonance the presence of free radicals in alveolar type II cells exposed to Cl2 and returned to room air for up to 24 h [5]. However, whether these species originated from membrane, cytoplasmic or mitochondrial sources were not investigated. Herein we show increased MitoSOX™ fluorescence, which co-localized with MitoTracker, consistent with an intra-mitochondrial pro-oxidant environment, in human distal airway cells up to 6 h post exposure. MitoSOXTM is a non-specific probe and oxidation could be due to increased superoxide/hydrogen peroxide or modification of cytochrome c [38]. Within 1h of Cl2 exposure cellular bioenergetics were impaired with increased non-mitochondrial OCR and decreased maximal respiration (Figure 1). The impact of Cl2 on bioenergetic parameters is dependent on the exposure to CL2 with an acute increase in toxicity between 75 and 100 ppm, which is most likely due to the consumption of the antioxidants in the ELF bathing the cells. Bioenergetic defects could be ameliorated by the mitochondrially targeted redox active compound MitoQ but not its redox inactive analog (Figure 3). Measurement of oxidative phosphorylation indicated impairment of both complexes I and II linked substrates but not complex IV, which is consistent with damage to complex III, which is the point at which electrons from both complex I and II are channeled (Figure 4). Since it is likely that the effects of Cl2 are pleiotropic, these do not rule out the possibility of inhibition of other targets contributing to bioenergetic dysfunction. Further investigations are required to define the precise point of inhibition of the mitochondrial function by Cl2.
This is the first evidence that exposure of human airway cells to sublethal concentrations of Cl2 gas, in concentrations likely to be encountered in the vicinity of industrial accidents [4], under conditions designed to model the lung-air interface, (i.e. while the cells covered by small amounts of fluid containing urate, GSH and ascorbate in concentrations found in vivo [3]) decreased mitochondrial function. This is a critically important aspect of our study since we have shown previously that Cl2 and its hydration product HOCl will first react with antioxidants in the lung epithelial lining fluid prior to reacting with biological targets on the cell surfaces [11]. Animals exposed to Cl2 have decreased levels of ascorbate in their lung tissues [9, 28] and post exposure administration of low molecular weight scavengers decreases Cl2 induced lung injury and improved mortality [5, 9, 43]. The fact that pretreatment of airway cells with MitoQ, a mitochondrial modulator of superoxide/hydrogen peroxide signaling [44–46] prevented mitochondrial injury clearly implicates mitochondrial dysfunction redox regulation in complex I and II of the respiratory chain as a mediator of this toxicity. The mechanisms through which MitoQ exerts its effects are most likely through changing mitochondrial superoxide/hydrogen peroxide signaling as we have previously suggested[44] recently, it has been shown that MitoQ can promote autophagy, which is an additional mechanism that could also be functioning after Cl2 exposure [47].
Our data also clearly demonstrate that at 6 h post exposure maximal cellular respiration, and mitochondrial membrane potential had essentially returned to baseline although levels of MitoSOXTM fluorescence were still elevated. These data suggests a dynamic restoration of the mitochondrial population through quality control mechanisms. Autophagy is essential for this process since it removes damaged cytosolic and mitochondrial organelles, which are sequestered and delivered to lysosomes for degradation and recycling [24, 48, 49]. Proteins or organelles modified by reactive species are targeted for removal by the lysosomal-autophagy system and the selective removal of mitochondria by mitophagy is a critical step in maintaining mitochondrial quality control [1, 24, 25, 32]. The conversion of microtubule-associated protein-1 light chain B (LC3B) from its free form (LC3BI) to phosphatidylethanolamine-conjugated form (LC3BII) is a major step in autophagosomes formation [50, 51]. In our studies, we quantified only LC3BII levels, since appearance of LC3BI band was very variable and was not consistently detected. P62 is an adaptor protein, which binds LC3B, and decreased levels of p62 are thought to be indicative of autophagy [52]. Our data showing increased levels of LC3BII and decreased levels of p62 at 6 h post Cl2 in H441 cells establish the presence of autophagy, which is associated with recovery of mitochondrial injury. Furthermore, the fact that chloroquine (which inhibits autophagic flux by inhibiting lysosomal activities) further increased levels of LCBII at 6 h post Cl2 exposure supports the premise that increased levels of LC3BII were due to increased autophagy.
There is considerable debate as to whether autophagy contributes to or mitigates the pathology of pulmonary disease [24, 48]. For example, Chen et al. [53] reported that cigarette smoke increased LC3B levels by decreasing HDAC activity and increasing binding of early growth response-1 (Egr-1) and E2F factors to the promoter region of LC3B and increased autophagy was essential component of cigarette smoke injury to lung epithelial cells. Furthermore, prevention of the autophagic response in mice exposed to cigarette smoke decreased the severity of emphysema. On the other hand, Lee et al. [54] reported that low levels of carbon monoxide upregulated autophagy in lung epithelial cells by increasing mitochondrial superoxide/hydrogen peroxide and autophagy was essential for conferring protection of lung epithelial cells from hyperoxia. Insufficient autophagy was also responsible for accelerated cellular senescence of lung epithelial cells and myofibroblasts differentiation [52]. Here we show that autophagy plays an important protective role in diminishing Cl2 induced injury to the mitochondria: pre-incubation of H441 cells with trehalose increased LC3BII in both air and Cl2 exposed cells at 1 h post exposure and mitigated the decrease of maximal OCR at that time. Inhibition of autophagy with 3-MA worsened Cl2 induced bioenergetic dysfunction. This has been previously shown in other models of cellular oxidative stress [31, 55], and one possible protective mechanism is to remove of damaged mitochondria which could contribute to bioenergetic failure in the cells and amplify the effects of oxidative stress [32, 56].
A characteristic feature of Cl2 exposed mice is the development of an intense inflammatory response, which is characterized by a large influx of inflammatory cells (mainly neutrophils and lymphocytes) and a decrease in the number of resident alveolar macrophages [40]. Activated neutrophils secrete myeloperoxidase, which catalyzes the oxidation of Cl− by H2O2 to yield HOCl, thus compounding Cl2 induced injury to the lung and systemic endothelia [57]. A novel finding in our studies is the demonstration that chronic pre-treatment by addition of trehalose to the drinking water of mice for 6 weeks abrogated the infiltration of inflammatory cells, which would confer a significant advantage to these mice and enhance tissue repair (Figure 8). In a separate protocol, we used an acute trehalose protocol through aerosolization into the airway modeling a more realistic scenario for first responders to a Cl2 exposure. In this case, we found that trehalose increased the levels of LC3IIB in lung tissue on Cl2 exposure and this was associated with a significant decrease in lung permeability. The reasons for these differences in response related to the mode of administration are not clear at present but we have observed similar effects with other protective agents such as nitrite [58]. Although future experiments are still needed to determine the exact mechanism which may include both an activation of autophagy and chemical chaperone activities [42, 59], this observation clearly indicates a beneficial effect of trehalose in protecting against Cl2 induced lung injury.
In summary, these studies highlight the potential importance of the maintenance of mitochondrial function in the recovery of the lung to exposure to toxicants such as Cl2 and the potential utility of the autophagy pathway as a therapeutic strategy for acute lung injury mediated by toxic agents such as Cl2.
Supplementary Material
H441 cells were covered with the epithelial lining fluid (containing normal ringers 120 NaCl, 25 NaHCO3, 3.3 KH2PO4, 0.83 K2HPO4, and 1.2mM CaCl2 and MgCl2) with ascorbic acid (AA; 1 mM), reduced glutathione (GSH; 0.12 mM) and urate (0.03 mM)) and were exposed to either Cl2 (100 pm for 15min) or air. At 1 or 6 h post exposure, cells were trypsinized, stained, and analyzed by flow cytometry. Sorting was gated for Annexin V to detect early apoptosis and Necrosis Detection Reagent to detect necrosis. Mean values ± SEM for the indicated categories. Number of samples as follows: 1 h post exposure: Air=9; 1 h post Cl2 exposure-19; 6 h post Cl2 exposure: Air =5; Cl2=10
Highlights.
Chlorine (Cl2) is often released into the atmosphere because of industrial accidents
Accidental exposure of humans to Cl2 results in severe injury to lungs and heart
-
Exposure of lung epithelial cells to Cl2 damages:
-
❖
complexes I and II but not complex IV
-
❖
Mitochondrial bioenergetics as measured by the Sea Horse Analyzer
-
❖
Upregulation of autophagy by trehalose decreases mitochondrial injury
Exposure of mice to Cl2 results in lung inflammation and alveolar injury
Intratracheal trehalose increases lung autophagy and decreases injury
Acknowledgements
The authors would like to thank Ms. Zhihong Yu for her assistance in animal surgery and Ms. Gloria Y. Son for editing the final version of the manuscript. We also acknowledge the valuable assistance of the UAB Analytic Imaging and Immunoreagent Core (AIIC) and the Comprehensive Flow Cytometry Core for their assistance with immunocytochemistry and FACS analyses.
Supported by: 5U01ES015676 and 5R01HL031197 (SM); 1R21ES02402701 (SM and VDU); NIHR01-NS064090 (JZ) and a VA merit award (JZ)
Footnotes
Publisher's Disclaimer: This is a PDF file of an unedited manuscript that has been accepted for publication. As a service to our customers we are providing this early version of the manuscript. The manuscript will undergo copyediting, typesetting, and review of the resulting proof before it is published in its final citable form. Please note that during the production process errors may be discovered which could affect the content, and all legal disclaimers that apply to the journal pertain.
Reference List
- 1.Lee J, Giordano S, Zhang J. Autophagy, mitochondria and oxidative stress: cross-talk and redox signalling. Biochem J. 2012;441:523–540. doi: 10.1042/BJ20111451. [DOI] [PMC free article] [PubMed] [Google Scholar]
- 2.Van Sickle D, Wenck MA, Belflower A, Drociuk D, Ferdinands J, Holguin F, et al. Acute health effects after exposure to chlorine gas released after a train derailment. Am J Emerg Med. 2009;27:1–7. doi: 10.1016/j.ajem.2007.12.006. [DOI] [PMC free article] [PubMed] [Google Scholar]
- 3.Yadav AK, Bracher A, Doran SF, Leustik M, Squadrito GL, Postlethwait EM, et al. Mechanisms and modification of chlorine-induced lung injury in animals. Proc Am Thorac Soc. 2010;7:278–283. doi: 10.1513/pats.201001-009SM. [DOI] [PMC free article] [PubMed] [Google Scholar]
- 4.Buckley RL, Hunter CH, Werth DW, Whiteshide MTCK-F, Mazzola CA. A case study of chlorine transport and fate following a large accidental release. Atmospheric Environment. 2012;62:184–198. [Google Scholar]
- 5.Lazrak A, Chen L, Jurkuvenaite A, Doran SF, Liu G, Li Q, et al. Regulation of alveolar epithelial Na+ channels by ERK1/2 in chlorine-breathing mice. Am J Respir Cell Mol Biol. 2012;46:342–354. doi: 10.1165/rcmb.2011-0309OC. [DOI] [PMC free article] [PubMed] [Google Scholar]
- 6.Hill BG, Dranka BP, Zou L, Chatham JC, Darley-Usmar VM. Importance of the bioenergetic reserve capacity in response to cardiomyocyte stress induced by 4-hydroxynonenal. Biochem J. 2009;424:99–107. doi: 10.1042/BJ20090934. [DOI] [PMC free article] [PubMed] [Google Scholar]
- 7.Murphy MP. How mitochondria produce reactive oxygen species. Biochem J. 2009;417:1–13. doi: 10.1042/BJ20081386. [DOI] [PMC free article] [PubMed] [Google Scholar]
- 8.Klamt F, Shacter E. Taurine chloramine, an oxidant derived from neutrophils, induces apoptosis in human B lymphoma cells through mitochondrial damage. J Biol Chem. 2005;280:21346–21352. doi: 10.1074/jbc.M501170200. [DOI] [PubMed] [Google Scholar]
- 9.Fanucchi MV, Bracher A, Doran SF, Squadrito GL, Fernandez S, Postlethwait EM, et al. Post-exposure antioxidant treatment in rats decreases airway hyperplasia and hyperreactivity due to chlorine inhalation. Am J Respir Cell Mol Biol. 2012;46:599–606. doi: 10.1165/rcmb.2011-0196OC. [DOI] [PMC free article] [PubMed] [Google Scholar]
- 10.Gorguner M, Aslan S, Inandi T, Cakir Z. Reactive airways dysfunction syndrome in housewives due to a bleach-hydrochloric acid mixture. Inhal Toxicol. 2004;16:87–91. doi: 10.1080/08958370490265004. [DOI] [PubMed] [Google Scholar]
- 11.Squadrito GL, Postlethwait EM, Matalon S. Elucidating mechanisms of chlorine toxicity: reaction kinetics, thermodynamics, and physiological implications. Am J Physiol Lung Cell Mol Physiol. 2010;299:L289–L300. doi: 10.1152/ajplung.00077.2010. [DOI] [PMC free article] [PubMed] [Google Scholar]
- 12.Song W, Wei S, Zhou Y, Lazrak A, Liu G, Londino JD, et al. Inhibition of lung fluid clearance and epithelial Na+ channels by chlorine, hypochlorous acid, and chloramines. J Biol Chem. 2010;285:9716–9728. doi: 10.1074/jbc.M109.073981. [DOI] [PMC free article] [PubMed] [Google Scholar]
- 13.Weiss SJ. Tissue destruction by neutrophils. N Engl J Med. 1989;320:365–376. doi: 10.1056/NEJM198902093200606. [DOI] [PubMed] [Google Scholar]
- 14.Spalteholz H, Panasenko OM, Arnhold J. Formation of reactive halide species by myeloperoxidase and eosinophil peroxidase. Arch Biochem Biophys. 2006;445:225–234. doi: 10.1016/j.abb.2005.06.025. [DOI] [PubMed] [Google Scholar]
- 15.den Hartog GJ, Haenen GR, Vegt E, van der Vijgh WJ, Bast A. Efficacy of HOCl scavenging by sulfur-containing compounds: antioxidant activity of glutathione disulfide? Biol Chem. 2002;383:709–713. doi: 10.1515/BC.2002.073. [DOI] [PubMed] [Google Scholar]
- 16.Hawkins CL, Pattison DI, Davies MJ. Hypochlorite-induced oxidation of amino acids, peptides and proteins. Amino Acids. 2003;25:259–274. doi: 10.1007/s00726-003-0016-x. [DOI] [PubMed] [Google Scholar]
- 17.Weiss SJ, Klein R, Slivka A, Wei M. Chlorination of taurine by human neutrophils. Evidence for hypochlorous acid generation. J Clin Invest. 1982;70:598–607. doi: 10.1172/JCI110652. [DOI] [PMC free article] [PubMed] [Google Scholar]
- 18.Crow JP. Measurement and significance of free and protein-bound 3-nitrotyrosine, 3-chlorotyrosine, and free 3-nitro-4-hydroxyphenylacetic acid in biologic samples: a high-performance liquid chromatography method using electrochemical detection [In Process Citation] Methods Enzymol. 1999;301:151–160. doi: 10.1016/s0076-6879(99)01078-2. [DOI] [PubMed] [Google Scholar]
- 19.Hazen SL, Hsu FF, Mueller DM, Crowley JR, Heinecke JW. Human neutrophils employ chlorine gas as an oxidant during phagocytosis. J Clin Invest. 1996;98:1283–1289. doi: 10.1172/JCI118914. [DOI] [PMC free article] [PubMed] [Google Scholar]
- 20.Hazen SL, Heinecke JW. 3-Chlorotyrosine, a specific marker of myeloperoxidase-catalyzed oxidation, is markedly elevated in low density lipoprotein isolated from human atherosclerotic intima. J Clin Invest. 1997;99:2075–2081. doi: 10.1172/JCI119379. [DOI] [PMC free article] [PubMed] [Google Scholar]
- 21.Spickett CM. Chlorinated lipids and fatty acids: an emerging role in pathology. Pharmacol Ther. 2007;115:400–409. doi: 10.1016/j.pharmthera.2007.06.002. [DOI] [PubMed] [Google Scholar]
- 22.Yadav AK, Doran SF, Samal AA, Sharma R, Vedagiri K, Postlethwait EM, et al. Mitigation of chlorine gas lung injury in rats by postexposure administration of sodium nitrite. Am J Physiol Lung Cell Mol Physiol. 2011;300:L362–L369. doi: 10.1152/ajplung.00278.2010. [DOI] [PMC free article] [PubMed] [Google Scholar]
- 23.Zarogiannis SG, Jurkuvenaite A, Fernandez S, Doran SF, Yadav AK, Squadrito GL, et al. Ascorbate and deferoxamine administration after chlorine exposure decrease mortality and lung injury in mice. Am J Respir Cell Mol Biol. 2011;45:386–392. doi: 10.1165/rcmb.2010-0432OC. [DOI] [PMC free article] [PubMed] [Google Scholar]
- 24.Ryter SW, Nakahira K, Haspel JA, Choi AM. Autophagy in Pulmonary Diseases. Annu Rev Physiol. 2011 doi: 10.1146/annurev-physiol-020911-153348. [DOI] [PubMed] [Google Scholar]
- 25.Goldman SJ, Taylor R, Zhang Y, Jin S. Autophagy and the degradation of mitochondria. Mitochondrion. 2010;10:309–315. doi: 10.1016/j.mito.2010.01.005. [DOI] [PMC free article] [PubMed] [Google Scholar]
- 26.Davis I, Matalon S. Reactive species in viral pneumonitis: lessons from animal models. News Physiol Sci. 2001;16:185–190. doi: 10.1152/physiologyonline.2001.16.4.185. [DOI] [PubMed] [Google Scholar]
- 27.Wispe JR, Warner BB, Clark JC, Dey CR, Neuman J, Glasser SW, et al. Human Mn-superoxide dismutase in pulmonary epithelial cells of transgenic mice confers protection from oxygen injury. J Biol Chem. 1992;267:23937–23941. [PubMed] [Google Scholar]
- 28.Leustik M, Doran S, Bracher A, Williams S, Squadrito GL, Schoeb TR, et al. Mitigation of chlorine-induced lung injury by low-molecular-weight antioxidants. Am J Physiol Lung Cell Mol Physiol. 2008;295:L733–L743. doi: 10.1152/ajplung.90240.2008. [DOI] [PMC free article] [PubMed] [Google Scholar]
- 29.Moberg L, Karlberg B. An improved N,N-diethyl-p-phenylenediamine (DPD) method for the determination of free chlorine based on multiple wavelength detection. Analytica Chimica Acta. 2000;407:127–133. [Google Scholar]
- 30.Dranka BP, Benavides GA, Diers AR, Giordano S, Zelickson BR, Reily C, et al. Assessing bioenergetic function in response to oxidative stress by metabolic profiling. Free Radic Biol Med. 2011;51:1621–1635. doi: 10.1016/j.freeradbiomed.2011.08.005. [DOI] [PMC free article] [PubMed] [Google Scholar]
- 31.Higdon AN, Benavides GA, Chacko BK, Ouyang X, Johnson MS, Landar A, et al. Hemin causes mitochondrial dysfunction in endothelial cells through promoting lipid peroxidation: The protective role of autophagy. Am J Physiol Heart Circ Physiol. 2012 doi: 10.1152/ajpheart.00584.2011. [DOI] [PMC free article] [PubMed] [Google Scholar]
- 32.Hill BG, Benavides GA, Lancaster JR, Ballinger S, Dell’italia L, Zhang J, et al. Integration of cellular bioenergetics with mitochondrial quality control and autophagy. Biol Chem. 2012;393:1485–1512. doi: 10.1515/hsz-2012-0198. [DOI] [PMC free article] [PubMed] [Google Scholar]
- 33.Reily C, Mitchell T, Chacko BK, Benavides G, Murphy MP, Darley-Usmar V. Mitochondrially targeted compounds and their impact on cellular bioenergetics. Redox Biol. 2013;1:86–93. doi: 10.1016/j.redox.2012.11.009. [DOI] [PMC free article] [PubMed] [Google Scholar]
- 34.Salabei JK, Gibb AA, Hill BG. Comprehensive measurement of respiratory activity in permeabilized cells using extracellular flux analysis. Nat Protoc. 2014;9:421–438. doi: 10.1038/nprot.2014.018. [DOI] [PMC free article] [PubMed] [Google Scholar]
- 35.Londino JD, Lazrak A, Jurkuvenaite A, Collawn JF, Noah JW, Matalon S. Influenza matrix protein 2 alters CFTR expression and function through its ion channel activity. Am J Physiol Lung Cell Mol Physiol. 2013;304:L582–L592. doi: 10.1152/ajplung.00314.2012. [DOI] [PMC free article] [PubMed] [Google Scholar]
- 36.Kim JS, Nitta T, Mohuczy D, O’Malley KA, Moldawer LL, Dunn WA, Jr, et al. Impaired autophagy: A mechanism of mitochondrial dysfunction in anoxic rat hepatocytes. Hepatology. 2008;47:1725–1736. doi: 10.1002/hep.22187. [DOI] [PMC free article] [PubMed] [Google Scholar]
- 37.Mizumura K, Cloonan SM, Haspel JA, Choi AM. The emerging importance of autophagy in pulmonary diseases. Chest. 2012;142:1289–1299. doi: 10.1378/chest.12-0809. [DOI] [PMC free article] [PubMed] [Google Scholar]
- 38.Kalyanaraman B, Darley-Usmar V, Davies KJ, Dennery PA, Forman HJ, Grisham MB, et al. Measuring reactive oxygen and nitrogen species with fluorescent probes: challenges and limitations. Free Radic Biol Med. 2012;52:1–6. doi: 10.1016/j.freeradbiomed.2011.09.030. [DOI] [PMC free article] [PubMed] [Google Scholar]
- 39.LaRocca TJ, Henson GD, Thorburn A, Sindler AL, Pierce GL, Seals DR. Translational evidence that impaired autophagy contributes to arterial ageing. J Physiol. 2012;590:3305–3316. doi: 10.1113/jphysiol.2012.229690. [DOI] [PMC free article] [PubMed] [Google Scholar]
- 40.Song W, Wei S, Liu G, Yu Z, Estell K, Yadav AK, et al. Postexposure Administration of a {beta}2-Agonist Decreases Chlorine-Induced Airway Hyperreactivity in Mice. Am J Respir Cell Mol Biol. 2011;45:88–94. doi: 10.1165/rcmb.2010-0226OC. [DOI] [PMC free article] [PubMed] [Google Scholar]
- 41.Gessner MA, Doran SF, Yu Z, Dunaway CW, Matalon S, Steele C. Chlorine gas exposure increases susceptibility to invasive lung fungal infection. Am J Physiol Lung Cell Mol Physiol. 2013;304:L765–L773. doi: 10.1152/ajplung.00030.2013. [DOI] [PMC free article] [PubMed] [Google Scholar]
- 42.Rodriguez-Navarro JA, Rodriguez L, Casarejos MJ, Solano RM, Gomez A, Perucho J, et al. Trehalose ameliorates dopaminergic and tau pathology in parkin deleted/tau overexpressing mice through autophagy activation. Neurobiol Dis. 2010;39:423–438. doi: 10.1016/j.nbd.2010.05.014. [DOI] [PubMed] [Google Scholar]
- 43.Zarogiannis SG, Noah JW, Jurkuvenaite A, Steele C, Matalon S, Noah DL. Comparison of ribavirin and oseltamivir in reducing mortality and lung injury in mice infected with mouse adapted A/California/04/2009 (H1N1) Life Sci. 2012;90:440–445. doi: 10.1016/j.lfs.2011.12.014. [DOI] [PMC free article] [PubMed] [Google Scholar]
- 44.Chacko BK, Srivastava A, Johnson MS, Benavides GA, Chang MJ, Ye Y, et al. Mitochondria-targeted ubiquinone (MitoQ) decreases ethanol-dependent micro and macro hepatosteatosis. Hepatology. 2011;54:153–163. doi: 10.1002/hep.24377. [DOI] [PMC free article] [PubMed] [Google Scholar]
- 45.Snow BJ, Rolfe FL, Lockhart MM, Frampton CM, O’Sullivan JD, Fung V, et al. A double-blind, placebo-controlled study to assess the mitochondria-targeted antioxidant MitoQ as a disease-modifying therapy in Parkinson’s disease. Mov Disord. 2010;25:1670–1674. doi: 10.1002/mds.23148. [DOI] [PubMed] [Google Scholar]
- 46.Chacko BK, Reily C, Srivastava A, Johnson MS, Ye Y, Ulasova E, et al. Prevention of diabetic nephropathy in Ins2(+/)(AkitaJ) mice by the mitochondria-targeted therapy MitoQ. Biochem J. 2010;432:9–19. doi: 10.1042/BJ20100308. [DOI] [PMC free article] [PubMed] [Google Scholar]
- 47.Rao VA, Klein SR, Bonar SJ, Zielonka J, Mizuno N, Dickey JS, et al. The antioxidant transcription factor Nrf2 negatively regulates autophagy and growth arrest induced by the anticancer redox agent mitoquinone. J Biol Chem. 2010;285:34447–34459. doi: 10.1074/jbc.M110.133579. [DOI] [PMC free article] [PubMed] [Google Scholar]
- 48.Nakahira K, Cloonan SM, Mizumura K, Choi AM, Ryter SW. Autophagy: A Crucial Moderator of Redox Balance, Inflammation, and Apoptosis in Lung Disease. Antioxid Redox Signal. 2013 doi: 10.1089/ars.2013.5373. [DOI] [PMC free article] [PubMed] [Google Scholar]
- 49.Dodson M, Darley-Usmar V, Zhang J. Cellular metabolic and autophagic pathways: traffic control by redox signaling. Free Radic Biol Med. 2013;63:207–221. doi: 10.1016/j.freeradbiomed.2013.05.014. [DOI] [PMC free article] [PubMed] [Google Scholar]
- 50.Lee SJ, Smith A, Guo L, Alastalo TP, Li M, Sawada H, et al. Autophagic protein LC3B confers resistance against hypoxia-induced pulmonary hypertension. Am J Respir Crit Care Med. 2011;183:649–658. doi: 10.1164/rccm.201005-0746OC. [DOI] [PMC free article] [PubMed] [Google Scholar]
- 51.Tanida I, Minematsu-Ikeguchi N, Ueno T, Kominami E. Lysosomal turnover, but not a cellular level, of endogenous LC3 is a marker for autophagy. Autophagy. 2005;1:84–91. doi: 10.4161/auto.1.2.1697. [DOI] [PubMed] [Google Scholar]
- 52.Araya J, Kojima J, Takasaka N, Ito S, Fujii S, Hara H, et al. Insufficient autophagy in idiopathic pulmonary fibrosis. Am J Physiol Lung Cell Mol Physiol. 2013;304:L56–L69. doi: 10.1152/ajplung.00213.2012. [DOI] [PubMed] [Google Scholar]
- 53.Chen ZH, Kim HP, Sciurba FC, Lee SJ, Feghali-Bostwick C, Stolz DB, et al. Egr-1 regulates autophagy in cigarette smoke-induced chronic obstructive pulmonary disease. PLoS ONE. 2008;3:e3316. doi: 10.1371/journal.pone.0003316. [DOI] [PMC free article] [PubMed] [Google Scholar]
- 54.Lee SJ, Ryter SW, Xu JF, Nakahira K, Kim HP, Choi AM, et al. Carbon monoxide activates autophagy via mitochondrial reactive oxygen species formation. Am J Respir Cell Mol Biol. 2011;45:867–873. doi: 10.1165/rcmb.2010-0352OC. [DOI] [PMC free article] [PubMed] [Google Scholar]
- 55.Benavides GA, Liang Q, Dodson M, Darley-Usmar V, Zhang J. Inhibition of autophagy and glycolysis by nitric oxide during hypoxia-reoxygenation impairs cellular bioenergetics and promotes cell death in primary neurons. Free Radic Biol Med. 2013;65C:1215–1228. doi: 10.1016/j.freeradbiomed.2013.09.006. [DOI] [PMC free article] [PubMed] [Google Scholar]
- 56.Zhang J. Autophagy and Mitophagy in Cellular Damage Control. Redox Biol. 2013;1:19–23. doi: 10.1016/j.redox.2012.11.008. [DOI] [PMC free article] [PubMed] [Google Scholar]
- 57.Honavar J, Samal AA, Bradley KM, Brandon A, Balanay J, Squadrito GL, et al. Chlorine gas exposure causes systemic endothelial dysfunction by inhibiting endothelial nitric oxide synthase-dependent signaling. Am J Respir Cell Mol Biol. 2011;45:419–425. doi: 10.1165/rcmb.2010-0151OC. [DOI] [PMC free article] [PubMed] [Google Scholar]
- 58.Samal AA, Honavar J, Brandon A, Bradley KM, Doran S, Liu Y, et al. Administration of nitrite after chlorine gas exposure prevents lung injury: Effect of administration modality. Free Radic Biol Med. 2012;53:1431–1439. doi: 10.1016/j.freeradbiomed.2012.08.007. [DOI] [PMC free article] [PubMed] [Google Scholar]
- 59.Sarkar S, Davies JE, Huang Z, Tunnacliffe A, Rubinsztein DC. Trehalose, a novel mTOR-independent autophagy enhancer, accelerates the clearance of mutant huntingtin and alpha-synuclein. J Biol Chem. 2007;282:5641–5652. doi: 10.1074/jbc.M609532200. [DOI] [PubMed] [Google Scholar]
Associated Data
This section collects any data citations, data availability statements, or supplementary materials included in this article.
Supplementary Materials
H441 cells were covered with the epithelial lining fluid (containing normal ringers 120 NaCl, 25 NaHCO3, 3.3 KH2PO4, 0.83 K2HPO4, and 1.2mM CaCl2 and MgCl2) with ascorbic acid (AA; 1 mM), reduced glutathione (GSH; 0.12 mM) and urate (0.03 mM)) and were exposed to either Cl2 (100 pm for 15min) or air. At 1 or 6 h post exposure, cells were trypsinized, stained, and analyzed by flow cytometry. Sorting was gated for Annexin V to detect early apoptosis and Necrosis Detection Reagent to detect necrosis. Mean values ± SEM for the indicated categories. Number of samples as follows: 1 h post exposure: Air=9; 1 h post Cl2 exposure-19; 6 h post Cl2 exposure: Air =5; Cl2=10


