Abstract
The objective of this study was to compare a novel controlled release tablet formulation based on interpolyelectrolyte complex (PEC). Interpolymer interactions between the countercharged polymers like Eudragit® EPO (polycation) and hypromellose acetate succinate (polyanion) and Eudragit® EPO and hypromellose phthalate (polyanion) were investigated with a view to their use in per oral controlled release drug delivery systems. The formation of inter-macromolecular ionic bonds between cationic polymer and anionic polymer was investigated using Fourier transform infrared (FT-IR) spectroscopy and differential scanning calorimetry. The FT-IR spectra of the tested polymeric matrices are characterized by visible changes in the observed IR region indicating the interaction between chains of two oppositely charged copolymers. The performance of the in situ formed PEC as a matrix for controlled release of drugs was evaluated, using acetaminophen as a model drug. The dissolution data of these matrices were fitted to different dissolution models. It was found that drug release followed zero-order kinetics and was controlled by the superposition of the diffusion and erosion. These profiles could be controlled by conveniently modifying the proportion of the polymer ratio, polymer type, and polymer concentration the in the tablets.
KEY WORDS: Eudragit E, hypromellose acetate succinate, hypromellose phthalate polyelectrolyte complexation
INTRODUCTION
The use of polyelectrolytes in the design of controlled release drug formulations has received notable attention in the recent years because of the capability of the interpolyelectrolyte complex (PEC) to achieve more sustained drug release than single polymers (1). Various types of oppositely charged polyelectrolytes interact electrostatically in aqueous media to form an insoluble solid or PEC (2–5). PECs have been used in a wide range of pharmaceutical applications such as polymeric carrier in sustained/controlled drug release, microencapsulation, nanoparticle formulations, preparation of biodegradable and biocompatible membranes, and protein and gene delivery (6–12).
Eudragit® polymers (Polymethacrylates) which are produced by Evonik are synthetic cationic or anionic polymers of dimethyl-aminoethylmethacrylates, methacrylicacid, and methacrylic acid esters in varying ratios. Polymethacrylate polymers have been widely used in pharmaceutical formulations as film-coating agent and as matrix carriers in solid dispersion preparation and in hot-melt extrusion processes (13–15). Eudragit® EPO (EE), a cationic polymer having a mean relative molecular mass of about 150,000, is prepared by copolymerization of butyl methacrylate, 2-dimethylaminoethylmethacrylate, and methyl methacrylate. The ratio of dimethylaminoethyl methacrylate groups to butyl methacrylate and methyl methacrylate groups is about 2:1:1 (16). Eudragit® L 100-55 (EL) is an anionic copolymer based on methacrylic acid and ethylacrylate. The ratio of free carboxyl groups to the ester groups is approximately 1:1. The carboxylic groups ionize in aqueous media at pH 5.5 and above (13). The repeating unit of EL and EE are shown in Fig. 1a, b.
Fig. 1.

Chemical structure of a EL and b EE polymer
Hypromellose acetate succinate, also known as hydroxypropyl methylcellulose acetate succinate (HPMCAS), is an enteric polymer developed by Shin-Etsu Chemical Co., Ltd. in Japan. This enteric polymer is soluble in aqueous media at a pH higher than 5.5, owing to the presence of carboxyl groups (16). The chemical structure of HPMCAS is shown in Fig. 2a. Three different grades of HPMCAS (AS-LF, AS-MF, and AS-HF) are commercially available which are classified according to the ratio of succinoyl substitution to acetyl substitution (SA ratio). The SA ratio is highest in AS-LF, whereas AS-HF has the lowest SA ratio (16). Hypromellose phthalate also known as hydroxypropyl methylcellulose phthalate (HPMCP) is an enteric polymer also developed by Shin-Etsu Chemical Co., Ltd. in Japan. HPMCP is cellulose in which some of the hydroxyl groups are replaced with methyl ethers, 2-hydroxypropyl ethers, or phthalyl esters. Several different types of hypromellose phthalate (HP50, HP55, HP55S) are commercially available with molecular weights in the range 20,000–200,000 (16). Both HPMCAS and HPMCP are widely used in oral pharmaceutical formulations as an enteric coating polymer for tablets or granules or pellets formulation (17,18). They may be used alone or in combination with other soluble or insoluble binders in the preparation of granules/pellets with sustained drug release properties (19,20). The chemical structure of HPMCP is shown in Fig. 2b.
Fig. 2.
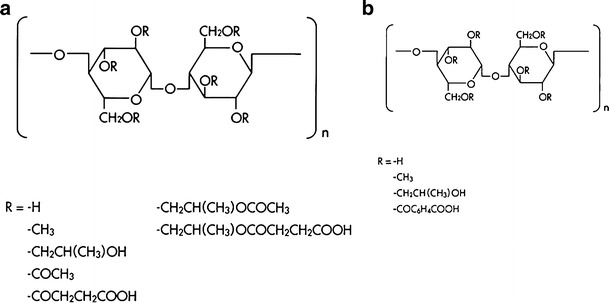
Chemical structure of a HPMCAS and b HPMCP polymer
The selection of anionic and cationic polymers forming the PEC can be made on the basis of their physicochemical properties such as biocompatibility, physicochemical stability, pH-dependent solubility, and swellability characteristics, etc. (21,22). PEC between EE and EL was previously reported, and the corresponding PEC was synthesized by mixing the two polymers in solutions. The product, PEC complex, was isolated and then dried, before being utilized as a polymeric carrier for modified drug release (23). As an alternative for this lengthy process, we propose in situ EE-enteric polymer polyelectrolyte complexation in an acidic medium simulating the gastric fluid. Our proposal is dependent on the fact that the acidic groups in the enteric polymers may allow for polymer ionization and interaction with the cationic EE even at low pH values.
In this study, acetaminophen was selected as a model drug due to its minimal drug-excipient interaction reported with Eudragit® polymers (4). The aims of this study were as follows:
To prepare a novel controlled release tablet formulation using cationic EE and anionic enteric polymers and to evaluate their dissolution properties.
To study the effect of enteric polymer type on the release profile of the drug from the matrix system.
To study the effect of anionic and cationic polymer ratio and polymer concentration on the release profile of the drug from the matrix system.
To study the effect of pH on the release profile of the drug from the controlled release dosage form.
MATERIALS AND METHODS
Materials
Acetaminophen was obtained from Mylan laboratories limited (Hyderabad, India) as a gift sample. Eudragit® EPO and Eudragit® L100-55 were purchased from Evonik Röhm GmbH (Darmstadt, Germany), and HPMCAS and HPMCP were purchased from Shin-Etsu Japan. Lactose monohydrate, hydroxypropyl cellulose, and magnesium stearate were obtained as a gift sample from Mylan laboratories limited (Hyderabad, India).
Methods
Preparation of Matrix Tablets
Various formulations (Tables I and II) and powder blends were studied based on different proportions of polymers type and their grade. Drug and lactose monohydrate were passed through #30 sieve and mixed together for 10 min in a polybag. The blend was granulated using 5% (w/v) solution of Hydroxypropyl cellulose in ethanol, and wet granules were dried in an oven at 60°C for 1–2 h. Dried granules were mixed with the different proportion of polymers in a polybag for 10 min and further lubricated with magnesium stearate (previously passed through #60 mesh sieve). Lubricated blend was compressed with average weight of 1080 mg on a rotary tablet punching machine (Cadmach, Ahmedabad, India) fitted with 19 × 8.5-mm capsule shaped standard concave punches with corresponding die to provide a desirable hardness. The amount of acetaminophen in matrix tablets was kept constant at 650 mg while the amount of other excipients was varied.
Table I.
Formulation Components and Physical Characteristics of Designed Sustained Release Matrix Tablets of Acetaminophen
| Ingredients | F1 | F2 | F3 | F4 | F5 | F6 | F7 | F8 |
|---|---|---|---|---|---|---|---|---|
| Acetaminophen | 650 | 650 | 650 | 650 | 650 | 650 | 650 | 650 |
| Lactose monohydrate | 100 | 100 | 100 | 100 | 100 | 100 | 100 | 100 |
| Hydroxy propyl cellulose | 20 | 20 | 20 | 20 | 20 | 20 | 20 | 20 |
| Lactose monohydrate | 300 | 200 | 200 | 200 | 200 | 100 | 100 | 100 |
| Eudragit EPO | – | 100 | – | – | – | 100 | 100 | 100 |
| Eudragit L10055 | – | – | 100 | – | – | 100 | – | – |
| HPMCP-HP-55 | – | – | – | 100 | – | – | 100 | – |
| HPMCAS-LF | – | – | – | – | 100 | – | – | 100 |
| Magnesium stearate | 10 | 10 | 10 | 10 | 10 | 10 | 10 | 10 |
| Average tablet weight (mg)a | 1080 | 1079 | 1079 | 1079 | 1079 | 1079 | 1079 | 1078 |
| Thickness (mm)b | 6.91 ± 0.01 | 6.85 ± 0.01 | 6.86 ± 0.01 | 6.95 ± 0.01 | 7.11 ± 0.01 | 6.78 ± 0.01 | 7.48 ± 0.01 | 7.45 ± 0.03 |
| Hardness (kp)c | 12.8 ± 0.4 | 15.7 ± 0.5 | 16.7 ± 0.5 | 14.5 ± 1.5 | 15.2 ± 0.8 | 15.9 ± 0.4 | 16.2 ± 0.8 | 16.1 ± 0.7 |
| Weight variation (%)d | ±0.9 | ±0.4 | ±0.8 | ±0.5 | ±1.2 | ±0.5 | ±0.4 | ±0.9 |
| Friability (%) | <1.0 | <1.0 | <1.0 | <1.0 | <1.0 | <1.0 | <1.0 | <1.0 |
HPMCP hydroxypropyl methylcellulose phthalate, HPMC hydroxypropyl methylcellulose
aMean of ten tablets
bMean of six tablets with SD
cMean of five tablets with SD
dMean of ten tablets with SD
Table II.
Formulation Components and Physical Characteristics of Designed Sustained Release Matrix Tablets of Acetaminophen
| Ingredients | F9 | F10 | F11 | F12 | F13 | F14 |
|---|---|---|---|---|---|---|
| Acetaminophen | 650 | 650 | 650 | 650 | 650 | 650 |
| Lactose monohydrate | 100 | 100 | 100 | 100 | 100 | 100 |
| Hydroxy propyl cellulose | 20 | 20 | 20 | 20 | 20 | 20 |
| Lactose monohydrate | 150 | 200 | 200 | 100 | 200 | 200 |
| Eudragit EPO | 75 | 50 | 50 | 50 | 33.33 | 66.67 |
| HPMCAS-LF | 75 | 50 | – | – | 66.67 | 33.33 |
| HPMCAS-MF | – | – | 50 | – | – | – |
| HPMCAS-HF | – | – | – | 50 | – | – |
| Magnesium stearate | 10 | 10 | 10 | 10 | 10 | 10 |
| Average tablet weight (mg) a | 1079 | 1079 | 1079 | 1078 | 1081 | 1080 |
| Thickness (mm)b | 7.45 ± 0.01 | 7.14 ± .01 | 7.15 ± .01 | 7.08 ± .01 | 7.15 ± 0.01 | 7.09 ± 0.01 |
| Hardness (kp)c | 17.3 ± 1.1 | 17.5 ± 0.9 | 16.4 ± 1.3 | 15.6 ± 0.8 | 16.1 ± 0.7 | 17.1 ± 0.9 |
| Weight variation (%)d | ±0.5 | ±1.4 | ±1.9 | ±0.6 | ±0.4 | ±0.7 |
| Friability (%) | <1.0 | <1.0 | <1.0 | <1.0 | <1.0 | <1.0 |
HPMCAS hydroxypropyl methylcellulose acetate succinate
aMean of ten tablets
bMean of six tablets with SD
cMean of five tablets with SD
dMean of ten tablets with SD
Physical Evaluation of the Matrix Tablets
Formulated tablets were subjected to the following physical characterization studies. Tablet weight variation was calculated by measuring the weight of ten tablets, and the results are expressed as mean values ± SD. The hardness of the matrix tablets was examined for five tablets of each batch using a hardness tester (Dr. Schleuniger, Germany). Tablet thickness of the matrix tablets was examined for six tablets of each batch using an electronic digital caliper. Friability of the tablets was measured in a friability tester (EF-1W, Electrolab, Mumbai, India). The tablets were weighed initially and rotated at 25 rpm for 4 min, and the samples were then reweighed. The percentage friability was calculated using the following equation:
| 1 |
where F% represents the percentage weight loss and W1 and W2 are the initial and final tablet weights, respectively.
Fourier Transform Infrared Spectroscopy
EE and enteric polymer, at 1:1 weight ratio, were physically mixed using a mortar and pestle. Tablets with 200 mg of the polymers were compacted manually from the physical mixtures using a 9-mm punch in a tablet compression machine. Tablets were exposed to 500 ml of pH 6.8 phosphate buffer using glass vessels in a dissolution apparatus at 37°C for 2 h, with subsequent filtration. The filtered solids were allowed to dry at room temperature in glass petri dishes, ground into powder in a mortar and pestle, and then analyzed by Fourier transform infrared (FT-IR) spectroscopy according to the KBr disk method using a PerkinElmer FT-IR spectrometer (USA). For comparative purposes, FT-IR analysis was also performed on pure EE, pure enteric polymers, and an unexposed physical mixture of the polymers. The compressed disks were scanned over 400 to 4000 cm−1 at ambient temperature using an accumulation of 16 runs in each sample with the resolution of 4 cm−1, and characteristic peaks were recorded and evaluated by using spectrum software.
In Vitro Drug Release
In vitro drug release testing from tablets was conducted according to the USP 27 apparatus 2 specifications using a dissolution tester (Electrolab, India). The dissolution testing for acetaminophen was conducted in 900 ml of 0.1 N HCl or pH 4.5 acetate buffer or pH 6.8 phosphate buffer. During dissolution testing, the media was maintained at 37 ± 0.5°C. The paddles were rotated at a speed of 50 rpm. The tablets were placed into 900 mL of dissolution medium. Aliquots of 10 mL were withdrawn from the dissolution apparatus at different time intervals and filtered through a cellulose acetate membrane (0.45 μm). The drug content was determined spectrophotometrically at a wavelength of 243 nm. At each time of withdrawal, 10 mL of fresh medium was replaced into the dissolution flask. The mean of three determinations was used to calculate the drug release from each of the formulation.
Swelling Studies
The swelling of the polymers upon hydration by the test medium was determined by a method similar to the equilibrium weight gain method as reported earlier (24). The matrix tablets of selected formulations were weighed and placed in tared metallic baskets. These baskets were then immersed in 900 ml of pH 6.8 phosphate buffer medium at 100 rpm and 37 ± 0.5°C (USP 25 basket method). At specified time intervals, the baskets containing the matrix tablets were removed, lightly blotted with tissue paper so as to remove excess water and weighed again. They were then placed back in the dissolution vessel as quickly as possible. The percent degree of swelling was calculated as follows:
| 2 |
where Ws is the weight of the swollen matrix at time t and Wd is the weight of the dry matrix. The swelling study was done in triplicate for all samples tested.
Drug Release Kinetics
To study the release kinetics, data obtained from in vitro drug release studies were plotted in various kinetic models: zero order (Eq. 3) as cumulative amount of drug released vs. time and Higuchi’s model (Eq. 4) as cumulative percentage of drug released vs. square root of time.
| 3 |
Where Mt / M∞ is the fraction of drug released at any time t; where K0 is the zero-order rate constant.
| 4 |
where KH is the constant reflecting the design variables of the system and t is the time in hours. Hence, drug release rate is proportional to the reciprocal of the square root of time.
To evaluate the drug release with changes in the surface area and the diameter of the particles/tablets, the data were also plotted using the Hixson-Crowell cube root law:
| 5 |
where Qt is the amount of drug released in time t, Q0 is the initial amount of the drug in the tablet, and KHC is the rate constant for the Hixson-Crowell rate equation, as the cube root of the percentage of drug remaining in the matrix vs. time.
The following plots were made: cumulative % drug release vs. time (zero-order kinetic model); cumulative % drug release vs. square root of time (Higuchi model) and cube root of drug % remaining in matrix vs. time (Hixson-Crowell cube root law). The model with the highest correlation coefficient was considered to be the best-fitting one.
Mechanism of Drug Release
To study the release kinetics from the matrix tablets, the release data were fitted to the well-known exponential equation (power law or Korsmeyer-Peppas equation), which is often used to describe the drug release behavior from polymeric systems (25).
| 6 |
Where Mt / M∞ is fraction of drug released at time t, k is the rate constant incorporating the structural and geometric characteristics of the matrix tablets, and n is the release exponent indicative of the drug release mechanism. To clarify the release exponent for different batches of matrices, the log value of percentage drug released was plotted against log time for each batch according to the Eq. 7.
| 7 |
In case of Fickian release (diffusionaly controlled release), the n has the limiting values of 0.45 for release from cylinders. Case II transport or relaxation controlled delivery; the exponent n is 0.89 for release from cylinders. The non-Fickian release or anomalous transport of drug occurred when the n values are between the limiting values of Fickian and case II transport. The non-Fickian kinetics corresponds to coupled diffusion/polymer relaxation. Occasionally, values of n > 0.89 for release from cylinders have been observed, which has been regarded as super case II kinetics (25).
Release Profile Comparison
The drug release profiles were compared using two model-independent methods, mean dissolution time (MDT), and similarity factor (f2) (26).
MDT was calculated from dissolution data using Eq. 8 and has been used for comparison.
| 8 |
Where j is the sample number, n the number of time increments considered, t ^j the time at midpoint between tj and t j − 1, and ΔQj the additional amount of drug dissolved in the period of time tj and tj − 1.
The similarities between two dissolution profiles were assessed by a pair-wise model-independent procedure such as similarity factor (f2):
| 9 |
Where n is the number of pull points, Rt is the reference profile at time point t, and Tt is the test profile at the same time point; the value of f2 should be between 50 and 100. An f2 value of 100 suggests that the test and reference profiles are identical and, as the value becomes smaller, the dissimilarity between release profiles increases.
RESULTS AND DISCUSSION
Infrared Spectroscopic Analysis
The spectrum of EL (Fig. 3a) exhibited a characteristic absorption band at 1720 cm−1, which corresponds to the absorption by carboxylic acid groups of the acrylic copolymer and in agreement with data presented in the product specifications of Evonik (27). The spectrum also showed a wide absorption range of the associated hydroxyl groups between 2500 and 3500 cm−1 and characteristic peak associated CHX vibrations at 2900–3000 cm−1. As EE and EL belong to the same derivatives of methacrylic acid copolymers, the FT-IR spectra would exhibit many common features. The spectrum of EE (Fig. 3b) showed a C = O ester vibration band at 1728 cm−1. In addition, the bands at 2769 and 2823 cm−1 can be assigned to the dimethylamino groups. The spectrum of HPMCAS and HPMCP exhibited characteristic absorption peaks at 3400 cm–1 due to polyhydroxy group (−OH group), 1750 cm–1 due to C = 0 stretching, 1400–1350 cm–1 due to C–O–C stretching, and 1064 cm–1 due to C–O stretch of cyclic ethers group (Fig. 3c, d) (28). The physical mixture of polymer mixtures showed the bands for the single components (data not shown). The spectra of the treated polymer mixtures (EE-EL, EE-HPMCP, and EE-HPMCAS,) exposed to pH 6.8 phosphate buffer are shown in Fig. 4a–c. As may be appreciated, the latter is different from the rest of the spectra. The two bands of absorption at 2770 and 2824 cm−1, corresponding to non-ionized dimethylamine groups in EE spectrum (29) were considerably reduced for the PEC. This might be due to the interaction of protonated dimethylamino group from EE with carboxylate group from anionic polymers. In addition, the spectrum showed peaks at 1751 and 1542 cm−1 that might be assigned to the ionized carboxylate groups and hydrogen-bonded carbonyl groups. The FT-IR spectrum demonstrated the formation of PEC similar to those published in the literature.
Fig. 3.
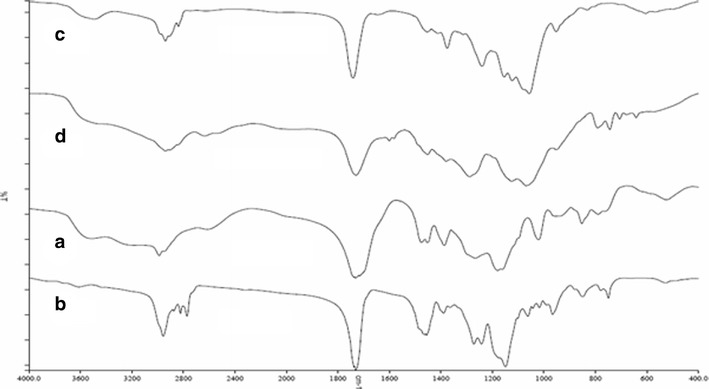
FT-IR spectrum of pure polymers. a EL. b EE, c HPMCAS, and d HPMCP
Fig. 4.
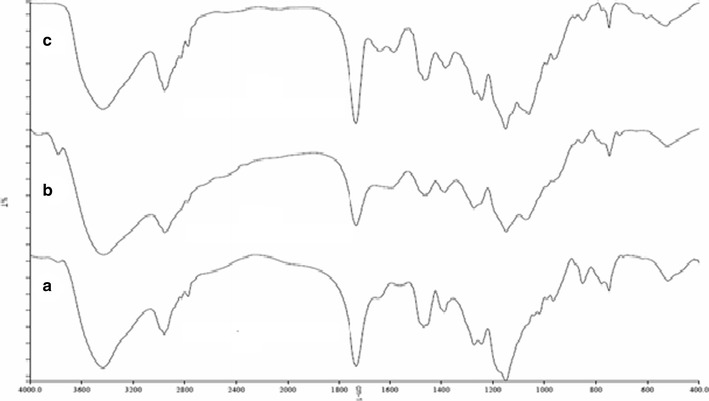
FT-IR spectrum of treated polymers. a EE-EL, b EE-HPMCP, and c EE-HPMCAS
Physical Characterization of the Designed Tablets
The physical appearance, weight variation, tablet thickness, tablet hardness, and friability of all formulations were found to be satisfactory and reproducible as observed from the data in Tables I and II. The thickness of the tablets varied depending on bulk density of the dried granules used and the compression force applied. Tablet hardness was found to be good (between 12 and 18 kp) depending on the compression force applied, and friability was less than 1.0% (w/w). The manufactured tablets showed low weight variation indicating that the wet granulation method is an acceptable method for preparing good-quality matrix tablets.
Drug Release Studies
Combination of anionic polymers (EL) and cationic polymers (EE) for possible sustained release drug delivery has been reported in the literature (23). In this work, we have evaluated the combination of anionic polymers like HPMCP and HPMCAS with EE as cationic polymers for possible use as polymeric carrier for sustained release of acetaminophen. The drug release from the matrix tablets containing a single polymer as matrix former in 0.1 N HCl and pH 6.8 phosphate buffer is shown in Fig. 5a, b. The drug release was found to be rapid and complete at 3–4 h for all formulations except HPMCAS LF formulation [F5] in 0.1 N HCl dissolution medium. Thus, it can be concluded that the use of single anionic or cationic polymer will not provide sustained drug release from the matrix tablets. Hence, matrix tablets containing a combination of anionic and cationic polymers were prepared and the drug release profile was evaluated.
Fig. 5.
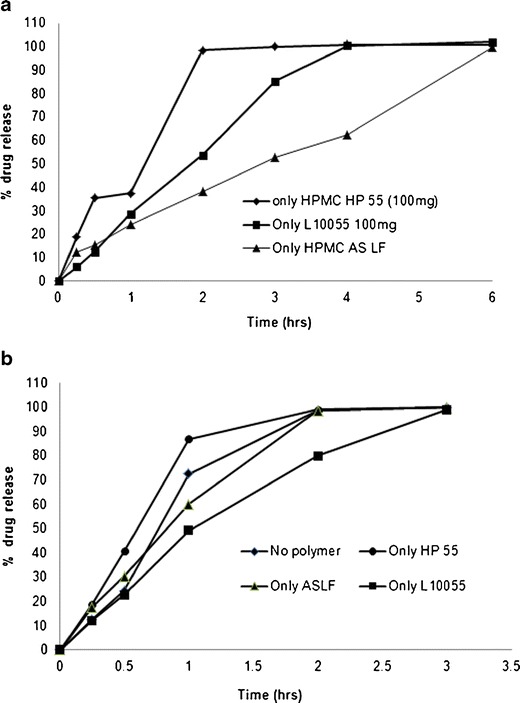
Dissolution of tablets prepared using single polymer in a 0.1 N HCl and b pH 6.8 phosphate buffer
Effect of Polymer Type
To study the effect of polymer type, matrix tablets were prepared with different polymer type combinations like EE with EL (F6), EE with HPMCP (F7), and EE with HPMCAS (F8). The drug release profile from these formulations in 0.1 N HCl are shown in Fig. 6. The drug release rate was fastest from the formulation containing EE and HP55 with a K value of 37.76% h−0.790 and t50% value of 1.43 h. The release rate was slowest from the formulation containing EE and HPMCAS with a K value of 10.81%h−0.625 and t50% value of 11.59 h. Formulation with EE and EL (F6) showed intermediate drug release profile compared to the other two polymer combinations. The faster drug release from the EE and HPMCP formulations could be attributed to the lower ability to form PEC in 0.1 N HCl and rapid disintegration of the tablet. The slower drug release rate observed for EE and HPMCAS (F8) formulation could be attributed to the formation of stronger PEC in 0.1 N HCl which in turn controlled the drug release rate. On the other hand, sustained drug release was observed in pH 6.8 phosphate buffer for all three polymer combinations evaluated (data not shown). This slower drug release performance could be attributed to the PEC formation at this pH.
Fig. 6.
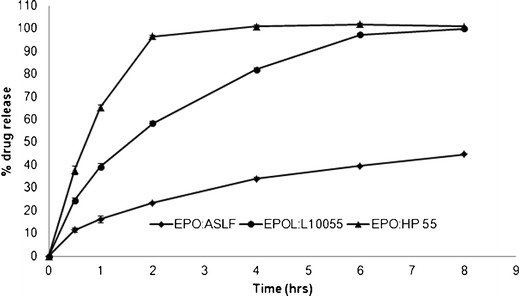
Dissolution of tablets prepared using different polymer combinations in 0.1 N HCl dissolution medium
Effect of Polymer Concentration
The release of acetaminophen from matrix tablets prepared with different concentrations of EE/HPMCAS is shown in Fig. 7. It is clear that the release rate is greatly dependent on the concentration of polymers in the formulation. Increasing the total amount of polymers in the formulation from 100 mg (F10) to 150 mg (F9) and 200 mg (F8) resulted in a slower release rate and extended drug release from the tablet. The release rate was slowest for the higher polymer concentration formulation (F8) with a K value of 7.76%h−0.667 and t50% value of 16.32 h. The release rate was fastest for the lower polymer concentration formulation (F10) with a K value of 14.72%h−0.619 and t50% value of 7.21 h. This slow release is because of the formation of a stronger PEC gel structure that delays drug release from the tablet matrix. The increase in polymer concentration resulted in an increase of the MDT values, where for 100-mg polymer concentration the MDT value was 4.1 h, compared with 5.0 and 4.9 h for the 150- and 200-mg polymer concentration, respectively. The slight increase in the MDT value with increasing polymer concentration can be ascribed to the entanglement density of the polymer at higher concentrations.
Fig. 7.
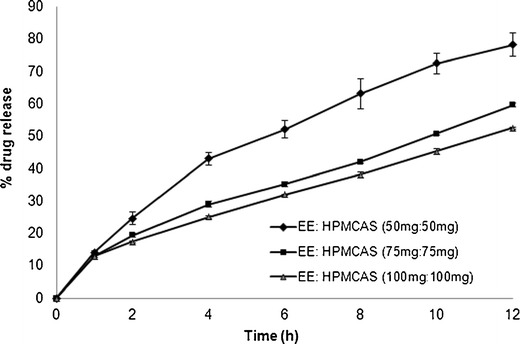
Dissolution of tablets prepared using different polymer concentrations in pH 6.8 phosphate buffer
Effect of Polymer Grade
Tablets containing EE and HPMCAS showed the best control on the drug release profile among the three different polymer combination formulas. This is due to the high degree of interaction that could exist as both polymers were ionized and maximum level charge density was obtained especially in acidic and buffer media. HPMCAS is available in several grades, which vary in extent of substitution, mainly of acetyl and succinoyl groups (Table III), and in particle size (fine or granular). The dissolution profiles of acetaminophen from the matrix tablets with different polymer grades of HPMC AS-LF (F10), HPMC AS-MF (F11), and HPMC AS-HF (F12) in pH 6.8 phosphate buffer are shown in Fig. 8. It can be observed that the release rate did not vary much for tablets prepared with different polymer grades of HPMC AS. The calculated MDT values were found to be 4.10, 4.09, and 3.52 h, respectively, for the release profiles of HPMCAS LF, MF, and HF formulations. The release profiles were also analyzed for the similarity factor (f2) values for the assessment of statistical difference or similarity between the release profiles. The f2 factor value was observed to be 57.4 between LF and MF formulations, 53.8 between LF and HF, and 72.4 between MF and HF formulations indicating no significant difference between the release profiles of HPMCAS LF, MF, and HF formulations.
Table III.
Substitution Type for Different Grades of Hypromellose Acetate Succinate
| Test | HPMCAS-LF | HPMCAS-MF | HPMCAS-HF |
|---|---|---|---|
| Methoxyl content (%) | 20.0–24.0 | 21.0–25.0 | 22.0–26.0 |
| Hydroxypropoxyl content (%) | 5.0–9.0 | 5.0–9.0 | 6.0–10.0 |
| Acetyl content (%) | 5.0–9.0 | 7.0–11.0 | 10.0–14.0 |
| Succinoyl content (%) | 14.0–18.0 | 10.0–14.0 | 4.0–8.0 |
HPMCAS hydroxypropyl methylcellulose acetate succinate
Fig. 8.
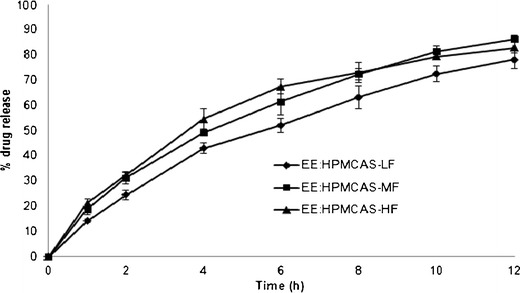
Dissolution of tablets prepared using different polymer grades of HPMCAS in pH 6.8 phosphate buffer
Effect of Polymer Ratio
To study the effect of polymer ratio (anionic/cationic) on drug release properties, three batches were manufactured with different polymer ratio of EPO/HPMCAS (0.5:1 (F13), 1:1 (F10), and 1:0.5 (F14)) but with same polymer concentration level (100 mg/tablets). It can be seen from Fig. 9 that the drug release rate was similar for F10 and F13 formulations whereas the release rate is higher for F14 formulation. The f2 factor value was observed to be 57.1 between 1:1 ratio (F10) and 0.5:1 ratio (F13) formulations, indicating no significant difference between the release profiles, whereas the f2 factor values were found to be 47.1 between F10 (1:1 ratio) and F14 (1:0.5 ratio) formulations and 44.6 between F13 (0.5:1 ratio) and F14 (1:0.5 ratio) formulations, indicating a significant difference between the release profiles of different formulation ratios. The calculated t50% values were found to be 7.21, 5.95, and 8.46 h for F10, F13, and F14 formulations, respectively.
Fig. 9.
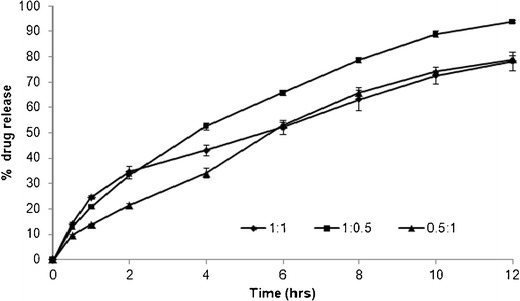
Dissolution of tablets prepared using different polymer ratios of EE/HPMCAS in pH 6.8 phosphate buffer
Effect of Dissolution Medium
The effect of dissolution media (pH 1.2, 4.5, and 6.8) on drug release properties from formulation prepared using 200 mg of EE/HPMCAS (1:1 ratio) polymer combination (F8) is shown in Fig. 10. No significant difference was observed in the drug release from the formulations containing EE/HPMCAS polymer combination (F8) in different dissolution media based on the f2 values obtained. The f2 values determined by comparing drug release profiles in pH 1.2 with pH 6.8, pH 4.5 with pH 6.8, and pH 1.2 with pH 4.5 were found to be 59.8, 57.9, and 76.9, respectively, indicating similar drug release profiles in all the three dissolution media studied.
Fig. 10.
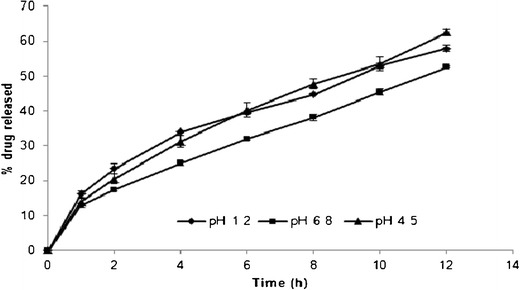
Comparative dissolution profile of matrix tablets prepared using EE/HPMCAS-LF polymer combination in different dissolution media (pH 1.2, 4.5, and 6.8)
Swelling Study
It is well known that the release properties of polymeric carriers can be somehow predicted by the determination of their swelling and erosion characteristics (23). A comparative analysis of the swelling characteristics of matrix systems prepared using different polymer combinations is shown in Fig. 11. The rate of swelling of tablet matrices that contain mixture of EE/HPMCAS was slower than that of other two matrices prepared using EE/HPMCP and EE/EL. At 1 h, the maximum swelling index of 43% was observed for the EE/HPMCP, and thereafter, a gradual decrease in the swelling index was observed for 2–6 h. The rate of swelling of tablet matrices prepared using EE/EL was found to be intermediate, and gradual increment was observed till 6 h. The rate of swelling was found to be different for different polymer combinations, and this could be attributed to the different drug release profiles and mechanisms observed during the dissolution analysis of matrix tablets.
Fig. 11.
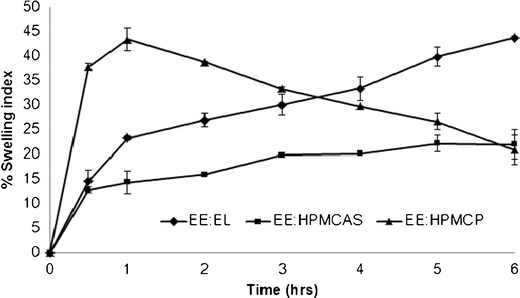
Comparative swelling index of matrix tablets prepared using different polymer combinations in pH 6.8 dissolution media
Kinetic Analysis of Release Data
To describe the kinetics of drug release from the selected matrix formulation (F8), release data was analyzed according to different kinetic equations. The data was analyzed by the regression coefficient method. On analyzing regression coefficient values, it was found that F8 formulation exhibits first-order kinetics (0.98). The in vitro release profiles of drug from this formulations could be best expressed by Hixson-Crowell equation as the plots showed highest linearity (r2 = 0.9924). To confirm the diffusion mechanism, the data was further fitted into Korsmeyer-Peppas equation (25). The formulation showed good linearity (r2 = 0.99), and the n value (0.6194) was higher than 0.45 indicating that the diffusion transport of the drug was not the only factor controlling the drug release, and in this case, the release was non-Fickian or anomalous; this suggested that other events occurred during drug diffusion process such as matrix swelling, dissolution, and erosion that might contribute to the overall release mechanism.
CONCLUSION
The present study demonstrated the successful application of the combination of anionic polymethacrylates and cationic enteric polymer such as hypromellose phthalate and hypromellose acetate succinate to sustain the acetaminophen release up to 12 h at different pH conditions. The drug release from the novel matrix system was found to be dependent on the polymer combination type, their ratio, and their concentrations. The prolonged drug release from the matrix system could be better explained by the in situ formation of PEC. The PEC was the result of the interaction between the carboxylic group of anionic polymers and the dimethylaminoethylethyl groups of Eudragit EPO which is supported by FT-IR analysis result. The formation of interpolymer interaction between countercharged types of well-known excipients like Eudragit EPO and HPMCAS opens new possibilities for oral controlled drug release.
Acknowledgments
The authors are grateful to Mylan laboratories Limited, Hyderabad, India, for the generous gift samples of acetaminophen and excipients. The authors wish to thank Dr. Abhijit Deshmukh for supporting the project.
Conflict of Interest
The authors report no conflict of interest.
REFERENCES
- 1.Bani-Jaber AK, Alkawareek MY, Al-Gousous JJ, Abu Helwa AY. Floating and sustained-release characteristics of effervescent tablets prepared with a mixed matrix of Eudragit L-100-55 and Eudragit E PO. Chem Pharm Bull. 2011;59:155–60. doi: 10.1248/cpb.59.155. [DOI] [PubMed] [Google Scholar]
- 2.Mustafin RI, Bukhovets AV, Sitenkov AY, Garipova VR, Kemenova VA, Rombaut P, et al. Synthesis and characterization of a new carrier based on Eudragit® EPO/S100 interpolyelectrolyte complex for controlled colon-specific drug delivery. Pharm Chem J. 2011;45:568–74. doi: 10.1007/s11094-011-0681-0. [DOI] [Google Scholar]
- 3.Bani-Jaber A, Al-Aani L, Alkhatib H, Al-Khalidi B. Prolonged intragastric drug delivery mediated by Eudragit® E-Carrageenan polyelectrolyte matrix tablets. AAPS PharmSciTech. 2011;12:354–61. doi: 10.1208/s12249-011-9595-0. [DOI] [PMC free article] [PubMed] [Google Scholar]
- 4.Obeidat WM, Abu Znait AH, Sallam AS. Novel combination of anionic and cationic polymethacrylate polymers for sustained release tablet preparation. Drug Dev Ind Pharm. 2008;34:650–60. doi: 10.1080/03639040701836578. [DOI] [PubMed] [Google Scholar]
- 5.Prado HJ, Matulewicz MC, Bonelli P, Cukierman AL. Basic butylated methacrylate copolymer/kappa-carrageenan interpolyelectrolyte complex: preparation, characterization and drug release behaviour. Eur J Pharm Biopharm. 2008;70:171–8. doi: 10.1016/j.ejpb.2008.04.017. [DOI] [PubMed] [Google Scholar]
- 6.Bawa P, Pillay V, Choonara YE, du Toit LC, Ndesendo VM, Kumar P. A composite polyelectrolytic matrix for controlled oral drug delivery. AAPS PharmSciTech. 2011;12:227–38. doi: 10.1208/s12249-010-9576-8. [DOI] [PMC free article] [PubMed] [Google Scholar]
- 7.Saleem MA, Kotadia DR, Kulkarni RV. Effect of formulation variables on dissolution of water-soluble drug from polyelectrolyte complex beads. Dissolut Technol. 2012;19:21–8.
- 8.Devi N, Maji TK. Preparation and evaluation of gelatin/sodium carboxymethyl cellulose polyelectrolyte complex microparticles for controlled delivery of isoniazid. AAPS PharmSciTech. 2009;10:1412–9. doi: 10.1208/s12249-009-9344-9. [DOI] [PMC free article] [PubMed] [Google Scholar]
- 9.Arora S, Gupta S, Narang RK, Budhiraja RD. Amoxicillin loaded chitosan-alginate polyelectrolyte complex nanoparticles as mucopenetrating delivery system for h. Pylori Sci Pharm. 2011;79:673–94. doi: 10.3797/scipharm.1011-05. [DOI] [PMC free article] [PubMed] [Google Scholar]
- 10.Wang L, Khor E, Wee A, Lim LY. Chitosan-alginate PEC membrane as a wound dressing: assessment of incisional wound healing. J Biomed Mater Res. 2002;63:610–8. doi: 10.1002/jbm.10382. [DOI] [PubMed] [Google Scholar]
- 11.Calvo P, Remuñán-lopez C, Vila-Jato JL, Alonso MJ. Novel hydrophilic chitosan–polyethylene oxide nanoparticles as protein carriers. J Appl Polym Sci. 1997;63:125–32. doi: 10.1002/(SICI)1097-4628(19970103)63:1<125::AID-APP13>3.0.CO;2-4. [DOI] [Google Scholar]
- 12.Leclercq L, Boustta M, Vert M. A physico-chemical approach of polyanion-polycation interactions aimed at better understanding the in vivo behaviour of polyelectrolyte-based drug delivery and gene transfection. J Drug Target. 2003;11:129–38. doi: 10.1080/1061186031000150287. [DOI] [PubMed] [Google Scholar]
- 13.Liu F, Lizio R, Meier C, Petereit HU, Blakey P, Basit AW. A novel concept in enteric coating: a double-coating system providing rapid drug release in the proximal small intestine. J Control Release. 2009;133:119–24. doi: 10.1016/j.jconrel.2008.09.083. [DOI] [PubMed] [Google Scholar]
- 14.Ho C, Hwang GC. Development of extended-release solid dispersions of nonsteroidal antiinflammatory drugs with aqueous polymeric dispersions: optimization of drug release via a curve-fitting technique. Pharm Res. 1992;9:206–10. doi: 10.1023/A:1018933306162. [DOI] [PubMed] [Google Scholar]
- 15.Schilling SU, Shah NH, Waseem Malick A, McGinity JW. Properties of melt extruded enteric matrix pellets. Eur J Pharm Biopharm. 2010;74:352–61. doi: 10.1016/j.ejpb.2009.09.008. [DOI] [PubMed] [Google Scholar]
- 16.Rowe RC. Handbook of pharmaceutical excipients. 5. Washington DC: American Pharmacists Association; 2005. [Google Scholar]
- 17.Hilton AK, Deasy PB. Use of hydroxypropyl methylcellulose acetate succinate in an enteric polymer matrix to design controlled-release tablets of amoxicillin trihydrate. J Pharm Sci. 1993;82:737–43. doi: 10.1002/jps.2600820713. [DOI] [PubMed] [Google Scholar]
- 18.Tirpude RN, Puranik PK. Rabeprazole sodium delayed-release multiparticulates: effect of enteric coating layers on product performance. J Adv Pharm Technol Res. 2011;2:184–91. doi: 10.4103/2231-4040.85539. [DOI] [PMC free article] [PubMed] [Google Scholar]
- 19.Kim MS, Kim JS, Kang SH, Yoo YH, Lee S, Park JS, et al. Influence of water soluble additives and HPMCP on drug release from Surelease-coated pellets containing tamsulosin hydrochloride. Arch Pharm Res. 2007;30:1008–13. doi: 10.1007/BF02993970. [DOI] [PubMed] [Google Scholar]
- 20.Siepmann F, Siepmann J, Walther M, MacRae RJ, Bodmeier R. Blends of aqueous polymer dispersions used for pellet coating: importance of the particle size. J Control Release. 2005;105:226–39. doi: 10.1016/j.jconrel.2005.03.028. [DOI] [PubMed] [Google Scholar]
- 21.Lankalapalli L, Kolapalli VRM. Polyelectrolyte complexes: a review of their applicability in drug delivery technology. Indian J Pharm Sci. 2009;71:481–7. doi: 10.4103/0250-474X.58165. [DOI] [PMC free article] [PubMed] [Google Scholar]
- 22.Philipp B, Dautzenberg H, Linow K, Kotz J, Dawydoff W. Polyelectrolyte complexes-recent developments and open problems. Prog Polym Sci. 1989;14:91–172. doi: 10.1016/0079-6700(89)90018-X. [DOI] [Google Scholar]
- 23.Moustafine RI, Zaharov IM, Kemenova VA. Physicochemical characterization and drug release properties of Eudragit E PO/Eudragit L 100-55 interpolyelectrolyte complexes. Eur J Pharm Biopharm. 2006;63:26–36. doi: 10.1016/j.ejpb.2005.10.005. [DOI] [PubMed] [Google Scholar]
- 24.Margulis EB, Moustafine RI. Swellability testing of chitosan/Eudragit L100-55 interpolyelectrolyte complexes for colonic drug delivery. J Control Release. 2006;116:e36–7. doi: 10.1016/j.jconrel.2006.09.037. [DOI] [PubMed] [Google Scholar]
- 25.Korsmeyer RW, Gurnya R, Doelkera E, Buria P, Peppas NA. Mechanism of solute release from porous hydrophilic polymers. Int J Pharm. 1983;15:25–35. doi: 10.1016/0378-5173(83)90064-9. [DOI] [Google Scholar]
- 26.Costa P, Lobo JMS. Modeling and comparison of dissolution profiles. Eur J Pharm Sci. 2001;13:123–33. doi: 10.1016/S0928-0987(01)00095-1. [DOI] [PubMed] [Google Scholar]
- 27.Evonik Pharma polymers 2012. Eudragit® Technical information. Available at: http://eudragit.evonik.com/product/eudragit/Documents/evonik-specification-eudragit-e-100,eudragit-epo-and-eudragit-e-12,5.pdf. Accessed on 12 April 2014.
- 28.Sharma M, Sharma V, Panda AK, Majumdar DK. Enteric microsphere formulations of papain for oral delivery. Yakugaku Zasshi. 2011;131:697–709. doi: 10.1248/yakushi.131.697. [DOI] [PubMed] [Google Scholar]
- 29.Evonik Pharma polymers 2012. Eudragit® Technical information. Available at: http://eudragit.evonik.com/product/eudragit/Documents/evonik-specification-eudragit-l-100-55.pdf. Accessed on 12 April 2014.


