

Abstract
Oil-in-water (o/w) emulsions are commonly converted into solid-like powders in order to improve their physical and chemical stabilities. The aim of this study was to investigate whether whey protein/polysaccharide-stabilized o/w emulsions could be converted into stable oil powders by means of freeze-drying. Moreover, during this study, the effects of pH and polymer type on release and trans(dermal) delivery of salicylic acid, a model drug, from these oil powders were investigated and compared to those of the respective template emulsions and redispersed oil powders. Physical characterization of the various formulations was performed, such as droplet size analysis and oil leakage, and relationships drawn with regards to release and trans(dermal) delivery. The experimental outcomes revealed that the oil powders could be redispersed in water without changing the release characteristics of salicylic acid. pH and polymer type affected the release of salicylic acid from the oil powders, template emulsions, and redispersed powders similarly. Contrary, the transdermal delivery from the oil powders and from their respective redispersed oil powders was differently affected by pH and polymer type. It was hypothesized that the release had been influenced by the electrostatic interactions between salicylic acid and emulsifiers, whereas the transdermal performance could have been determined by the particle or aggregate sizes of the formulations.
KEY WORDS: carrageenan, chitosan, oil powders, release, salicylic acid, topical delivery, whey proteins
INTRODUCTION
Oil-in-water (o/w) emulsions are commonly converted into solid-like powders by evaporating the aqueous phase, usually by spray- or freeze-drying, in order to encapsulate lipophilic active ingredients in the oil droplets (1). There are several advantages of these powders compared to conventional emulsions, such as the prevention of oxidation of the oil, the reduction in microbial contamination, the improvement in chemical stability of the active ingredients, or the enhancement of dissolution and bioavailability (2–6). Spray-dried emulsions of tuna oil, for example, stabilized by mixtures of chitosan and lecithin were found to have improved stability against oxidation, compared to the bulk oil. The inhibition of lipid oxidation may have resulted from sugar crystallization and hence the reduction in oxygen permeability to the lipids, or from Maillard reaction products that have acted as antioxidants (2). The chemical stability of all-trans-retinol at elevated temperature (40°C) could be enhanced by freeze-dried emulsions, compared to the initial o/w emulsions (3). Gallarate et al. (4) investigated dry emulsions for topical application and found an improved stability of anthocians from Vitis vinifera extracts when used in dry emulsions compared to conventional emulsions. A study by Simovic et al. (5) showed that conversion of a silica nanoparticle-stabilized o/w emulsion into spray-dried lipid microcapsules had significantly increased the release, as well as the bioavailability of indomethacin, compared to the initial o/w emulsion and the pure drug. The enhanced release of indomethacin was explained by an increased surface area of the amorphous silica matrices of the spray-dried lipid microcapsules. The photostability and bioavailability of amlodipine were also improved by spray-dried emulsion, compared to the pure amlodipine powder. It was suggested that the dextrin matrix of the dry emulsion constituted a compact physical barrier resulting in improved photostability (6).
Generally, hydrophilic carriers, such as maltodextrin, starch, lactose, and cellulose are added to the aqueous phase of the o/w emulsion in order to co-stabilize the oil droplets against coalescence during evaporation of the water, and to prevent oil leakage during storage of the oil powder (1,7). However, more recent studies have shown that stable oil powders are also possible without adding hydrophilic carriers. For example, it was found that the use of thermal cross-linked β-lactoglobulin for stabilizing emulsions allowed the conversion of the emulsion into the oil powder. No additional hydrocolloids were required, and hence, the oil content was much higher (>90 wt%), compared to oil powders containing hydrophilic carriers (8).
Other studies have investigated the effects of process parameters on the stability and performance of the resultant oil powders. A study by Lim et al. (7), for example, revealed that the choice of wall material to encapsulate red-fleshed pitaya seed oil had affected the encapsulation efficacy and stability of the oil. They investigated various proteins and polysaccharides as wall materials and found that sodium caseinate had resulted in the highest microencapsulation efficiency and that lactose was the most effective polysaccharide for retarding oxidation. Another study by Shen et al. (9) indicated the importance of the pH value on the stability of fish oil powders. It was shown that those oil powders at a higher pH (pH = 6) were more stable against oxidation than those prepared at pH 4.9. It was postulated that the increased stability of the fish oil powders at higher pH values was due to increased electrostatic interactions between chitosan and emulsifying starch. The type of constituents and their ratio in the formulation could also significantly influence the release of vitamin E acetate and the flowing properties of the spray-dried powders as shown in a study by Takeuchi et al. (10).
The aim of this study was to formulate oil powders, either stabilized solely by whey proteins or in combination with a polysaccharide (chitosan or carrageenan), by means of freeze-drying and to test them for topical application. It was, furthermore, investigated whether formulation parameters, such as the type of polymer and pH value, could affect release and trans(dermal) delivery of salicylic acid from these oil powders in comparison to the redispersed oil powders.
MATERIALS AND METHODS
Materials
Whey protein isolate (BiPro®) was kindly donated by Davisco Foods International (Le Sueur, MN, USA). As per the manufacturer, the whey protein isolate powder comprised at least 97% of dry basis protein, with the main proteins being β-lactoglobulin and α-lactalbumin. Miglyol 812 N® was kindly donated by Cremer (Hamburg, Germany). Carrageenan (commercial grade, type I, predominantly κ-carrageenan, lesser amounts of λ-carrageenan) and chitosan glutamate were purchased from Sigma-Aldrich (Johannesburg, RSA) and CarboMer (San Diego, CA, USA), respectively. Salicylic acid (99+%), the model active ingredient chosen for this study, was acquired from SAFC (St. Louis, MO, USA). Potassium chloride was purchased from Sigma-Aldrich (Johannesburg, RSA). Sodium dihydrogen orthophosphate, di-sodium hydrogen orthophosphate anhydrous, propylene glycol, 1 N hydrochloric acid (HCl), 1 N sodium hydroxide (NaOH), and methanol were purchased from ACE Chemicals (Johannesburg, RSA). Acetonitrile (LiChrosolv®, gradient grade for liquid chromatography) and acetic acid (glacial) were acquired from Merck Chemicals (Johannesburg, RSA). Sicomet Yellow F 11920 oil colorant was from BASF (Ludwigshafen, Germany).
Aqueous and Oil Phase Preparation
The aqueous phase was prepared by dispersing 3.5% wt. whey protein powder into deionized water, adjusted with 1 N HCl or 1 N NaOH to pH 4, 5, and 6, respectively, on a mixing plate at room temperature for approximately 2 h to ensure complete hydration. One percent wt. chitosan glutamate and 0.5% wt. carrageenan were separately dissolved in deionized water, each adjusted to pH 4, 5, and 6, respectively, at 60°C, and the resultant solutions were allowed to cool to room temperature.
The oil phase consisted of 2% wt. salicylic acid in Miglyol 812 N®. Salicylic acid was left to dissolve in Miglyol 812 N® overnight at 37°C.
Emulsion Preparation
The template emulsions were prepared in two steps. The primary emulsions were prepared by ultrasonication for 30 s (Model UP200St, Hielscher Ultrasonics, Teltow, Germany) at room temperature to obtain 30% wt. o/w emulsions. The aqueous phase of the primary emulsions consisted of 3.5% wt. whey solution at the different pH values. The primary emulsions were then placed in a water bath at 80°C for 15 min and subsequently allowed to cool to room temperature. The secondary emulsions were prepared by diluting the primary emulsions 1:1 (v/v), with deionized water, 1% chitosan solution, or 0.5% carrageenan solution, followed by ultrasonication for 30 s at room temperature. After the preparation of the secondary emulsions, their pH values were adjusted to pH 4, 5, and 6, by adding 1 N HCl or NaOH. These emulsions were then sonicated for a further 30 s at room temperature.
Oil Powder Preparation
The prepared emulsions were first allowed to cool at 4°C for 3 h and subsequently placed and left in the freezer at −80°C overnight, prior to placing them in the freeze dryer. Freeze-drying was carried out using a VirTis freeze dryer (SP Scientific, Gardiner, NY, USA). The freeze-drying conditions were set according to those used by Adelmann et al. (1). Briefly, the drying chamber was set at room temperature, the cooling unit at −50°C at a vacuum of 10−2 mbar.
The final composition of the oil powders are presented in Table I.
Table I.
Composition of Oil Powders
| Ingredient %wt. | Whey protein (whey) | Whey protein/carrageenan (Car) | Whey protein/chitosan (Chi) |
|---|---|---|---|
| Salicylic acid | 1.8 | 1.8 | 1.8 |
| Miglyol 812 N® | 90.0 | 90.0 | 90.0 |
| Whey protein | 8.2 | 6.7 | 5.2 |
| Chitosan glutamate | – | – | 3.0 |
| Carrageenan | – | 1.5 | – |
Oil Leakage
All nine powders were tested for oil leakage. For this purpose, the same oil powders, as described above, were prepared and a known amount of Sicomet Yellow F 11920 oil colorant added into the oil phase. After preparation of the oil powders, a weighted amount of oil powder (100 mg) was dispersed in 1.5 ml Miglyol 812 N® and vortex mixed for 1 min. Miglyol 812 N®, containing the leaked colored oil, was then separated from the powder by centrifugation, subsequently filtered, diluted with Miglyol 812 N®, and analyzed using a UV-VIS spectrophotometer (Specord 200 Plus, Analytic Jena, Germany) at 387 nm. Samples per oil powder were prepared in duplicate and two measurements taken per sample. The extent of oil leakage was determined over a period of 3 months as an estimation of the stability of the powders.
Particle Size Analysis
Droplet sizes of the template emulsions (before being subjected to freeze-drying) and of the redispersed powders (after freeze-drying) were determined by using the Malvern Mastersizer 2000, equipped with a wet cell Hydro 2000 SM dispersion unit (Malvern Instruments, Worcestershire, UK). The template emulsions were diluted with deionized water on the day of preparation to yield obscuration values between 10 and 20%. The oil powders were redispersed in deionized water at the day of removal from the freeze dryer to also yield obscuration values between 10 and 20%. Measurements were taken from two freshly prepared samples per emulsion and redispersed powder, and readings taken in duplicate.
The particle sizes were confirmed on the day of preparation of the template emulsions and redispersed oil powders by means of microscopy. A Motic microscope (Motic, Hong Kong) was used, equipped with a Moticam 3 camera and Motic Images Plus 2.0 software.
Additionally, grains of oil powder were embedded in resin; 0.5 μm thick sections were cut with a Reichert Jung Ultracut E microtome (Newark, DE, USA) and stained with 0.5% aqueous toluidine blue and 0.05% neofuchsin. Sections were viewed with a Motic microscope (Motic, Hong Kong), equipped with a Moticam 3 camera and Motic Images Plus 2.0 software.
Release of Active Ingredient from the Formulations
The release of the active ingredient from all nine emulsions, oil powders, and the redispersed oil powders was tested in triplicate, using Franz-type diffusion cells with a diffusion area of 1.13 cm2 and a receptor capacity of approximately 2 ml. These release experiments were performed at 37 ± 1°C in a heated water bath for 8 h. Cellulose acetate membranes (0.2 μm pore size, Whatman, Dassel, Germany) were used, and the receptor phase consisted of phosphate buffer pH 7.4 and propylene glycol (PG) (1:1, v/v). Fifty percent of PG was included into the receptor phase to increase the solubility of salicylic acid, thereby ensuring sink conditions of the active ingredient throughout the duration of the study. The cellulose acetate membranes were soaked overnight in the receptor phase. The receptor compartment was filled with 2 ml of preheated and degassed receptor phase and left to equilibrate before adding the donor phase. The donor compartment was filled with 1 ml of emulsion, 200 mg of powder, or 200 mg of oil powder redispersed in 1 ml deionized water. The entire volume of the receptor phase was withdrawn at 1, 2, 3, 4, 6, and 8 h and replaced with fresh pre-heated receptor media. The samples were subsequently analyzed by HPLC-UV.
Skin Preparation
The utilization of human skin for research purposes have been approved by the Ethics Committee of the North-West University, Potchefstroom, South Africa (Ethics number: NWU-00114-11-A5). Caucasian female skin was collected from cosmetic surgeries, following abdominoplastic surgery, with the written informed consent of each patient for use of their skin in research. The skin was thawed at room temperature, and skin membranes with a thickness of 400 μm were removed, using an electric dermatome (Zimmer Inc. Warsaw, Indiana, USA). The dermatomed skin membrane was placed on Whatman® filter paper, with the stratum corneum facing upwards. The skin samples were stored in aluminum foil and frozen at −20°C until use. Prior to the diffusion experiments, the skin membranes were thawed at room temperature, cut into the required size (circular pieces of approximately 1.5 cm in diameter), and mounted onto the Franz-type diffusion cells.
In Vitro Skin Absorption Study
A randomized, complete block design was used to assess the effect of skin donor variability, as well as the effect of formulation on dermal and transdermal delivery. Three different skin donors were used per formulation, and each formulation was applied in duplicate on each donor skin, giving a total of six replicates per formulation.
Based on the results of the release and oil powder characterization data, ten formulations were selected for the skin diffusion study. Chi oil powders at pH 4, 5, and 6; whey oil powder at pH 6; and Car oil powder at pH 6 were chosen and applied as powders, and also as redispersed powders in water. The setting up of the skin absorption study was the same as for the release study. Prior to the skin absorption experiment, the skin integrity was assessed by measuring the electric resistance across the skin. For skin resistance, the donor and the receptor compartments were filled with a 0.9% potassium chloride solution and placed in a heated water bath for an equilibration period of 30 min. Electrical resistance was measured by using a Tinsley LCR Databridge Model 6401 (Tinsley Precision Instruments, Croydon, UK). The reading was taken at 1 kHz with a maximum voltage of 300 mV root-mean-square in the parallel equivalent circuit mode, using an alternating current (11). Skin samples with resistance values below 10 kΩ were excluded from the study. The donor compartment was filled with 200 mg oil powder, or 200 mg oil powder redispersed in 1 ml deionized water. Receptor samples were collected after 24 h and subsequently analyzed by HPLC-UV.
Skin Sample Preparation
After completion of the 24 h transdermal diffusion studies, the formulations were removed from the donor compartments and the skin membranes pinned onto Whatman® filter paper, with the stratum corneum facing upwards. The skin samples were gently dabbed with paper towel to remove the remaining formulation from the skin surface; 3 M Scotch® Magic™ tape was used to remove the stratum corneum, using sixteen strips in total. The first strip of each sample was discarded due to possible traces of formulation still left on the skin. The remainder of the skin after tape stripping was cut into pieces to increase the surface area for extraction. The tape strip samples and the remainder of the skin were placed into two separate vials, containing 5 ml of methanol and stored for a period of at least 12 h at 4°C for subsequent extraction. The samples were then vortex mixed, filtered through hydrophilic PVDF pre-filters with a pore size of 0.45 μm (Agela Technologies Inc., Wilmington, DE, USA) and analyzed by HPLC-UV.
Statistical Analysis
Data from the release study was analyzed by one-way analysis of variance (ANOVA), using STATISTICA® (StatSoft Inc., Tulsa, OK, USA). Data from the skin absorption study was log transformed and analyzed by two-way ANOVA, employing the formulation as fixed effect and the skin donor as random effect. Subsequently, Tukey’s Honestly Significant Difference (HSD) test was performed on both data sets to compare the various formulations with each other. The release data of each template emulsion and its respective oil powder and redispersed powder, as well as the skin absorption data of each oil powder and its respective redispersed powder, were analyzed, using the Student’s t test in Excel® (Microsoft Corp., Seattle, WA, USA). Data with p < 0.05 were considered statistically significant.
HPLC-UV Method
HPLC analysis of salicylic acid was performed using an Agilent® 1100 Series HPLC system (Agilent Technologies, Palo Alto, CA, USA), equipped with a high performance, silica based, reversed phase C18-2 column (150 × 4.60 mm) with 5 μm particle size (Venusil XBP Agela Technologies, Wilmington, DE, USA). This instrument was equipped with a G1311A quaternary pump, a G1313A autosampler, and a G1315A multi-wavelength, diode array detector. The mobile phase consisted of 1% acetic acid, 45% acetonitrile, and 54% Milli-Q® water and was degassed after preparation. The flow rate was set at 1 ml min−1, with a run time of approximately 6 min. The UV-detector was set at 236 nm. All samples were injected in duplicate. Chromatograms were analyzed, using ChemStation Rev. A.10.03 software.
RESULTS
Characterization of Oil Powders and Respective Redispersed Powders in Water
Upon freeze-drying of thermal cross-linked whey protein/polysaccharide-stabilized emulsions white, fluffy oil powders, consisting of aggregated oil droplets, were obtained. Most of these powders felt dry on touch, except for the Car oil powder (pH 4) and whey oil powder (pH 6) that were slightly sticky, while the whey oil powders (pH 4 and 5) appeared very sticky. Light microscopy images of whey protein oil powders are depicted in Fig. 1. The whey proteins were stained with toluidine blue/neofuchsin for better visualization. Figure 1 clearly illustrates the shells that the whey proteins had formed around the oil droplets. The sizes of the oil droplets at all pH values were determined as being ≤10 μm, which were similar to the results reported by Mezzenga and Ulrich (8).
Fig. 1.

Light microscopy images of toluidine blue/neofuchsin-stained whey oil powders at pH 4, 5, and 6. The scale bar in each image represents 10 μm
The data of the droplet size analyses of each template emulsion (whey, Chi, and Car) and their respective redispersed oil powders in water are summarized in Table II and are presented as volume-weighted means (D [4,3]) and surface-weighted means (D [3,2]). The light microscopy images of the template emulsions and redispersed oil powders in water are furthermore represented in Figs. 2 and 3, respectively. Overall, the laser light scattering data revealed that the droplet sizes of the redispersed powders were much larger than those of the template emulsions. However, the droplet size data were contradicted by the microscope images (Fig. 3), in which the redispersed particles were much smaller. The light microscopy images in Figs. 2 and 3 show that the droplet sizes of the various template emulsions and their respective redispersed oil powders were similar, with a slight tendency of larger oil droplets shown by the redispersed oil powders. All template emulsions and redispersed oil powders consisted of oil droplets in the lower micrometer range (≤5 μm). Moreover, agglomeration of oil droplets was present in most of the formulations tested.
Table II.
Droplet Size Data Presented as Volume-Weighted Means (D [4,3]) and Surface-Weighted Means (D [2,3]) of Template Emulsions and Redispersed Oil Powders (Average ± S.D., n = 4)
| Template emulsion | Redispersed oil powder | ||||
|---|---|---|---|---|---|
| D [4,3] [μm] | D [3,2] [μm] | D [4,3] [μm] | D [3,2] [μm] | ||
| Whey | pH 4 | 7.64 ± 4.95 | 2.47 ± 0.10 | 192.57 ± 14.33 | 19.59 ± 5.30 |
| pH 5 | 12.15 ± 13.60 | 2.25 ± 0.25 | 238.37 ± 25.12 | 35.41 ± 6.23 | |
| pH 6 | 2.69 ± 0.06 | 1.99 ± 0.02 | 227.40 ± 09.16 | 36.78 ± 1.37 | |
| Car | pH 4 | 61.07 ± 8.42 | 4.13 ± 0.12 | 246.82 ± 8.79 | 64.74 ± 14.59 |
| pH 5 | 6.80 ± 3.10 | 2.94 ± 0.07 | 305.87 ± 24.72 | 60.46 ± 9.61 | |
| pH 6 | 2.23 ± 0.04 | 1.74 ± 0.04 | 289.31 ± 44.77 | 55.58 ± 9.93 | |
| Chi | pH 4 | 14.49 ± 4.62 | 4.07 ± 0.48 | 126.67 ± 5.47 | 9.05 ± 0.38 |
| pH 5 | 4.29 ± 0.39 | 2.68 ± 0.11 | 62.72 ± 10.42 | 7.62 ± 0.91 | |
| pH 6 | 3.61 ± 0.06 | 2.38 ± 0.03 | 519.10 ± 52.94 | 98.51 ± 19.47 | |
Fig. 2.

Light microscopy images of whey, carrageenan, and chitosan template emulsions (before being subjected to freeze-drying) at pH 4, 5, and 6. The scale bar in each image represents 10 μm
Fig. 3.

Light microscopy images of whey-, carrageenan-, and chitosan-redispersed oil powders at pH 4, 5, and 6 in water. The scale bar in each image represents 10 μm
The oil leakage results are summarized in Table III. In general, oil leakage was similar for the various oil powders, except for the whey oil powders at pH 4 and 5, which yielded higher oil leakage values. The data also show that oil leakage had not significantly increased over a time period of 3 months. Furthermore, no significant differences were found among samples taken at different locations (e.g. bottom, middle, and top) within one powder sample, with the exception of the whey protein oil powder at pH 4 and 5. It was found that the more sticky oil powders resulted in a higher variation in oil leakage over time and location, indicating that the oil was not homogeneously distributed in the entire oil powder sample. For example, whey oil powders at pH 4 and 5 appeared very sticky and resulted in high variation in oil leakage (Table III), whereas the powders that felt dry on touch (Car pH 5 and 6 and all Chi oil powders) showed similar oil leakage results from different locations (Table III).
Table III.
Oil Leakage Data Presented as Average ± S.D. (n = 4)
| Oil leakage [%] | Center of powder 1 week | Top of powder 2 months | Side of powder (glass wall) 3 months | Bottom of powder 3 months | |
|---|---|---|---|---|---|
| Whey | pH 4 | 39.5 ± 1.0 | 21.9 ± 0.1 | 16.8 ± 0.8 | 17.5 ± 0.2 |
| pH 5 | 41.0 ± 0.1 | 34.0 ± 0.9 | 33.2 ± 0.4 | 30.9 ± 0.8 | |
| pH 6 | 20.8 ± 0.4 | 13.8 ± 1.1 | 14.7 ± 0.9 | 12.1 ± 1.3 | |
| Car | pH 4 | 26.6 ± 2.1 | 19.7 ± 1.6 | 22.6 ± 1.6 | 20.5 ± 1.0 |
| pH 5 | 21.0 ± 0.2 | 20.1 ± 1.1 | 23.0 ± 0.8 | 20.7 ± 0.5 | |
| pH 6 | 13.1 ± 0.04 | 9.9 ± 0.5 | 9.9 ± 0.1 | 13.7 ± 0.2 | |
| Chi | pH 4 | 24.1 ± 1.0 | 25.9 ± 0.4 | 27.7 ± 0.5 | 24.4 ± 0.03 |
| pH 5 | 21.5 ± 2.0 | 18.1 ± 0.3 | 21.1 ± 1.0 | 18.7 ± 0.8 | |
| pH 6 | 20.5 ± 1.0 | 21.4 ± 1.0 | 21.9 ± 1.0 | 21.7 ± 1.0 | |
The top line of the heading indicates the location from where the samples were taken and the bottom line indicates the time point of sampling
Release of Active Ingredient from Formulations
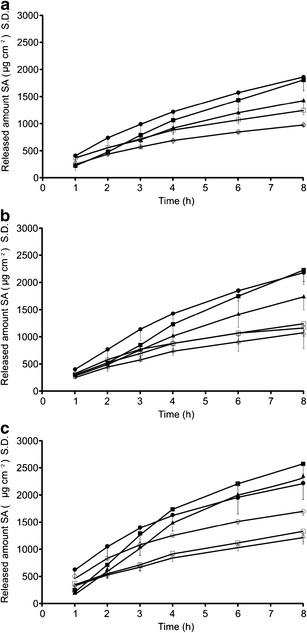
The release study was divided into two groups, i.e., the effect of pH (Fig. 4) and the effect of polymer (Fig. 5). Furthermore, the release of salicylic acid from the oil powders was compared to the release from the respective redispersed oil powders in water, as well as to the release of salicylic acid from the template emulsions (before being subjected to freeze-drying) (Table IV).
Fig. 4.

Salicylic acid release through cellulose acetate membranes from a whey, b Car, and c Chi oil powders (closed symbols) and redispersed oil powders (open symbols). Effect of pH: black circle pH 4, black square pH 5, and black triangle pH 6. The data are presented as average—S.D. (n = 3)
Fig. 5.
Release of salicylic acid through cellulose acetate membranes from oil powders (closed symbols) and redispersed oil powders (open symbols) at a pH 4, b pH 5, and c pH 6. Effect of polymer: black circle whey, black square Car, and black triangle Chi. The data are presented as average—S.D. (n = 3)
Table IV.
Release Rate, Cumulative Release in 8 h, and Lag Time of Salicylic Acid from Template Emulsions, Oil Powders, and Redispersed Oil Powders Through Cellulose Acetate Membranes Presented as Average ± S.D. (n = 3)
| Release rate K H | R 2 | Cumulative release in 8 h | Lag time | |||
|---|---|---|---|---|---|---|
| [μg cm−2 h-1/2] | [μg cm−2] | [min] | ||||
| Template emulsion | Whey | pH 4 | 370.6 ± 56.3 | 0.998 | 976.1 ± 59.8e | 4.1 ± 6.2 |
| pH 5 | 501.7 ± 6.5 | 0.999 | 1274.3 ± 32.9 | 5.4 ± 2.3 | ||
| pH 6 | 463.7 ± 36.0 | 0.999 | 1360.3 ± 113.8 | 0 | ||
| Car | pH 4 | 365.3 ± 59.4a | 0.998 | 1004.4 ± 113.3 | 1.3 ± 1.1 | |
| pH 5 | 435.4 ± 40.6 | 0.999 | 1144.0 ± 55.1 | 6.7 ± 11.2 | ||
| pH 6 | 515.9 ± 94.8 | 0.997 | 1262.2 ± 178.6 | 8.6 ± 7.3 | ||
| Chi | pH 4 | 415.5 ± 56.4 | 0.998 | 1075.4 ± 98.5 | 4.8 ± 6.1 | |
| pH 5 | 422.5 ± 13.1 | 0.998 | 1137.0 ± 57.6 | 1.7 ± 1.8 | ||
| pH 6 | 460.9 ± 48.0 | 0.999 | 1181.0 ± 112.5 | 4.4 ± 1.0 | ||
| Redispersed powder | Whey | pH 4 | 376.3 ± 14.1b | 0.999 | 931.7 ± 41.5b | 6.0 ± 1.0 |
| pH 5 | 453.7 ± 195.8 | 0.973 | 1210.5 ± 373.8 | 15.6 ± 20.3 | ||
| pH 6 | 653.8 ± 34.2 | 0.995 | 1700.0 ± 71.3 | 1.4 ± 0.9 | ||
| Car | pH 4 | 469.4 ± 34.1 | 0.999 | 1192.3 ± 79.4 | 4.4 ± 0.6 | |
| pH 5 | 502.6 ± 65.4 | 0.999 | 1290.2 ± 220.3 | 4.1 ± 4.2 | ||
| pH 6 | 517.8 ± 55.3 | 0.995 | 1329.7 ± 191.1 | 5.4 ± 1.1 | ||
| Chi | pH 4 | 371.3 ± 9.9 | 0.999 | 950.5 ± 42.0 | 4.0 ± 2.2 | |
| pH 5 | 444.1 ± 30.4 | 0.999 | 1130.7 ± 72.7 | 4.1 ± 1.1 | ||
| pH 6 | 498.0 ± 55.5 | 0.999 | 1248.9 ± 153.1 | 5.8 ± 2.9 | ||
| Oil powder | Whey | pH 4 | 771.5 ± 72.8 | 0.996 | 1789.7 ± 229.1 | 18.1 ± 12.3g |
| pH 5 | 993.8 ± 83.0 | 0.998 | 2230.6 ± 166.0 | 19.6 ± 10.1 | ||
| pH 6 | 866.5 ± 106.0c | 0.993 | 2218.2 ± 302.6 | 4.8 ± 4.9c | ||
| Car | pH 4 | 862.0 ± 151.6a | 0.997 | 1736.9 ± 199.4f | 41.6 ± 15.2 | |
| pH 5 | 1089.5 ± 209.6 | 0.986 | 2278.8 ± 264.5 | 38.3 ± 5.8 | ||
| pH 6 | 1346.3 ± 124.2 | 0.992 | 2572.1 ± 182.9 | 41.6 ± 1.6 | ||
| Chi | pH 4 | 645.2 ± 75.1 | 0.996 | 1375.8 ± 138.4 | 27.8 ± 8.5 | |
| pH 5 | 815.8 ± 126.8 | 0.991 | 1798.0 ± 246.7 | 26.5 ± 6.4 | ||
| pH 6 | 1239.5 ± 43.8d | 0.994 | 2354.2 ± 112.1d | 45.7 ± 7.9 | ||
a p < 0.05 against Car pH 6
b p < 0.05 against whey pH 6
c p < 0.05 against Car and Chi pH 6
d p < 0.05 against Chi pH 4 and 5
e p < 0.05 against whey pH 5 and 6
f p < 0.05 against Car pH 5 and 6
g p < 0.05 against Car pH 4
Figures 4 and 5 represent the cumulative amounts of salicylic acid released per surface area, plotted against time. The release data were fitted to the following release models: zero order, first order, and Higuchi model, and it was found that the release of salicylic acid from the various formulations could best be described by the Higuchi equation (Eq. 1).
| 1 |
where ft is the cumulative amount of salicylic acid released per surface area, KH is the Higuchi dissolution constant, and t1/2 represents the square root of time. The release rate KH was calculated from the linear portion (t1h–t8h) of the correlation between the cumulative amount of released salicylic acid per surface area and square root of time. Calculated release rates and regression coefficients are presented in Table IV.
The first set of data, investigating the effect of pH on the release of salicylic acid from the emulsions, oil powders, and redispersed oil powders, generally showed an increase in the release of salicylic acid with increasing pH. No significant differences were observed between the release (neither release rate nor cumulative amount of salicylic acid released after 8 h) from the template emulsions and from their respective redispersed powders (p > 0.05). However, the oil powders had yielded higher release (release rate and cumulative amount released) of salicylic acid, with the trend being similar to those of the template emulsions and redispersed powders. It was further observed that the lag time was considerably longer for the oil powders than for the respective emulsions and redispersed powders.
The second set of experiments, representing the effect of polymer on release, revealed no significant trend in the performance of the three polymers with regards to the release of salicylic acid. However, a tendency for a lower release of salicylic acid from the chitosan-containing formulations was observed.
In Vitro Skin Absorption
The skin absorption test results are shown in Figs. 6 and 7, where the data are presented as the total amount of active delivered over 24 h of permeation as least square means (formulation effect) ± 95% confidence interval (C.I.) obtained after two-way ANOVA. The results from the skin absorption study were also divided into two sets, i.e., the effect of pH on chitosan oil powders and the respective redispersed oil powders in water, as well as the effect of the various polymers at pH 6.
Fig. 6.

Salicylic acid skin absorption from Chi oil powders and redispersed oil powders through human abdominal skin, expressed as total amount delivered over 24 h as least square means (formulation effect) ± 95% confidence interval (C.I.), obtained after two-way ANOVA (n = 6). Effect of pH. * p < 0.05 against pH 5 and 6; ** p < 0.05 against pH 4 and 5
Fig. 7.
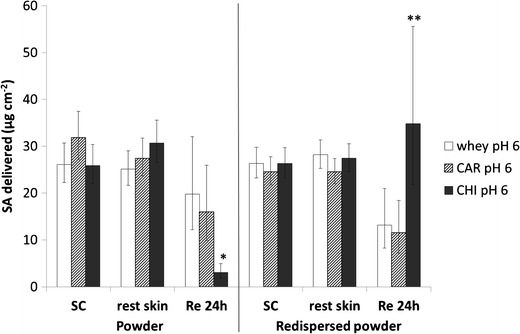
Salicylic acid skin absorption from whey, Car, and Chi oil powders and redispersed oil powders at pH 6 through human abdominal skin, expressed as total amount delivered over 24 h as least square means (formulation effect) ± 95% confidence interval (C.I.), obtained after two-way ANOVA (n = 6). Effect of polymer. * p < 0.05 against whey and Car; ** p < 0.05 against Car
The investigation of the effect of pH (Fig. 6) demonstrated no differences in dermal delivery of salicylic acid among the various pH values, neither from oil powders, nor from the redispersed powders in water. However, significant differences were obtained in transdermal delivery, with the trend being different for the oil powders and their respective redispersed powders. After 24 h, significantly more salicylic acid had permeated the skin from Chi oil powder at pH 5, compared to pH 4 (p = 0.0268) and pH 6 (p = 0.0002). The redispersed oil powder of chitosan at pH 4, however, showed statistically higher salicylic acid permeation than at pH 5 (p = 0.0002) and pH 6 (p = 0.0063).
The second set of results also showed no significant differences in dermal delivery between the various polymers, whereas statistically significant differences occurred in transdermal delivery, with the trend again being different for the oil powders and the redispersed powders. The Chi formulation statistically significantly showed the lowest permeation of salicylic acid from the oil powder (p = 0.0015 against whey, and p = 0.0040 against Car), whereas permeation had been the highest from the redispersed oil powder (p = 0.0654 against whey, and p = 0.0314 against Car).
DISCUSSION
Characterization of Oil Powders
It was demonstrated that thermal cross-linked whey protein-stabilized o/w emulsions had been successfully converted into stable oil powders by means of freeze-drying, after adding either carrageenan or chitosan to the emulsions using the layer-by-layer technique. It was hypothesized that the improved stability of the carrageenan and chitosan oil powders, as indicated by less oil leakage, had been due to the addition of the polysaccharides, which could have yielded cryoprotective properties. Various carbohydrates, such as glucose, mannitol, trehalose, and κ-carrageenan are reported to have been used as cryoprotectants during freeze-drying of emulsions (12,13).
The increase in particle size from the template emulsions to their respective redispersed oil powders, as determined by laser light scattering measurements (Table II), could either have been attributed to coalescence, or flocculation of the oil droplets. The light microscopy images (Figs. 2 and 3), however, revealed no significant increase in droplet size from the emulsions to the redispersed oil powders, indicating that the large increase in particle size, as observed from the data in Table II, had rather been caused by agglomeration of the particles during preparation of the oil powders, than by coalescence. Not all of the light microscopy images of the redispersed oil powders, e.g., whey (pH 6) and Car (pH 6) showed extensive agglomeration, as indicated by the laser light scattering data. This could be explained by the fact that only a small part of the redispersed oil powder was visible, which may not necessarily have represented aggregates, due to accumulation of larger particles/aggregates at the top of the redispersed oil powder samples, whereas the samples taken for the preparation of the microscope slides were withdrawn from the center of the redispersed oil powders.
Release of Active Ingredient from Formulations
The release data obtained for the template emulsions and redispersed powders were similar to that obtained by Combrinck et al. (14). It was therefore concluded that electrostatical interactions between the salicylic acid and the emulsifiers of the emulsion droplets had affected the release of salicylic acid from these formulations. The same trend was also observed for release from the oil powders, although initially no water had been present in these formulations. During the release study, though, water had diffused into the donor phase, which could have resulted in electrostatic interactions between salicylic acid and the emulsifiers. Figure 8 illustrates that more water appeared in the donor phase over time when cellulose acetate membranes were used, compared to skin membranes. As the water had to first diffuse from the receptor into the donor phase, the onset of release was delayed, as indicated by the longer lag times of the oil powders, when compared to the template emulsions and redispersed powders. The higher release rate, as well as the higher cumulative release from the oil powders could be explained by the lower amount of water present in the donor phase, yielding higher salicylic acid concentrations and therefore higher driving force for diffusion.
Fig. 8.

Images taken of Franz-type diffusion cells containing whey oil powder at pH 6
In Vitro Skin Absorption
The transdermal delivery results of salicylic acid from the redispersed oil powders were also similar to that obtained by Combrinck et al. (14). With regards to the effect of pH, the degree of ionization of salicylic acid could have affected the transdermal delivery thereof, with a decrease in permeation with increasing ionization of salicylic acid, according to the pH partition hypothesis. With regards to the effect of polymer, the enhanced permeation of salicylic acid from the redispersed chitosan oil powder could have been caused by the interaction between the positively charged amino groups of chitosan and the negatively charged skin surface. Additionally, the enhancing effect could also have been related to the permeation enhancing effects of chitosan. Lima et al. (15) stated that chitosan is known to lower the diffusion resistance of the stratum corneum and hence to enhance permeation across skin.
The oil powders showed a different trend in skin absorption when compared to the redispersed powders. With regards to the effect of pH, the ionization degree of salicylic acid could not have played a role, because no water was present in the donor phase. However, a correlation between the powder particle size and the transdermal delivery was observed, because with an increase in particle size (pH 5 < pH 4 < <pH 6—with reference to the Mastersizer results of the redispersed powders in Table II), the transdermal delivery decreased (pH 5 > pH 4 > pH 6). It was hypothesized that smaller powder particles and agglomerates, respectively, may have caused better contact with skin (achieving a better coverage of the skin diffusion area), hence resulting in higher percutaneous absorption. The same explanation could apply with regards to different polymers, where with increasing particle size, according to the Mastersizer results of the redispersed powders (whey < Car < < Chi), transdermal delivery decreased (whey > Car > > Chi). The differences in transdermal performance between the Chi oil powder at pH 6 (the lowest transdermal delivery) and the Chi redispersed oil powder at pH 6 (the highest transdermal delivery) may have been due to the fact that chitosan was undissolved in the oil powder and therefore it could have not acted as a permeation enhancer. Contrary, with regards to the redispersed oil powder containing water, chitosan could have dissolved and acted as permeation enhancer, hence resulting in a higher transdermal delivery of salicylic acid from the redispersed powder (Fig. 7).
CONCLUSION
The outcomes of this study showed that whey protein-stabilized emulsions could be converted into stable oil powders by the freeze-drying method after adding chitosan or carrageenan. The resultant oil powders were redispersible in water, and the size of the oil droplets were maintained after redispersion. However, agglomeration of the oil droplets occurred, but this did not affect the release characteristics, as the release of salicylic acid from the redispersed powders was similar to the release from the respective template emulsions. The various polymers and pH values, used for the preparation of the oil powders, had affected the release of salicylic acid, and the trend generally was similar for the template emulsions, oil powders, and redispersed oil powders. It was concluded that electrostatical interactions between the salicylic acid and the emulsifiers of the emulsion droplets had influenced the release of salicylic acid from these formulations. The transdermal delivery of salicylic acid was also significantly influenced by pH and type of polymer. However, in contrast to the release, the trend in transdermal delivery was different for the oil powders and the respective redispersed powders. It was found that the powder particle size/aggregate size could have determined the differences in performance after topical application.
Acknowledgments
The authors would like to thank the North-West University for funding this project and Prof. Jan du Preez for his support with the HPLC analyses.
References
- 1.Adelmann H, Binks BP, Mezzenga R. Oil powders and gels from particle-stabilized emulsions. Langmuir. 2012;28:1694–7. doi: 10.1021/la204811c. [DOI] [PubMed] [Google Scholar]
- 2.Klinkesorn U, Sophanodora P, Chinachoti P, McClements DJ, Decker EA. Stability of spray-dried tuna oil emulsions encapsulated with two-layered interfacial membranes. J Agric Food Chem. 2005;53:8365–71. doi: 10.1021/jf050761r. [DOI] [PubMed] [Google Scholar]
- 3.Ghouchi-Eskandar N, Simovic S, Prestidge CA. Solid-state nanoparticle coated emulsions for encapsulation and improving the chemical stability of all-trans-retinol. Int J Pharm. 2012;423:384–91. doi: 10.1016/j.ijpharm.2011.12.027. [DOI] [PubMed] [Google Scholar]
- 4.Gallarate M, Mittone E, Carlotti ME, Trotta M, Piccerelle P. Formulation of dry emulsion for topical applications. J Disp Sci Technol. 2009;30:823–33.
- 5.Simovic S, Heard P, Hui H, Song Y, Peddie F, Davey AK, et al. Dry hybrid lipid-silica microcapsules engineered from submicron lipid droplets and nanoparticles as a novel delivery system for poorly soluble drugs. Mol Pharm. 2009;6:861–72. doi: 10.1021/mp900063t. [DOI] [PubMed] [Google Scholar]
- 6.Jang DJ, Jeong EJ, Lee HM, Kim BC, Lim SJ, Kim CK. Improvement of bioavailability and photostability of amlodipine using redispersed dry emulsion. Eur J Pharm Sci. 2006;28:405–11. doi: 10.1016/j.ejps.2006.04.013. [DOI] [PubMed] [Google Scholar]
- 7.Lim HK, Tan CP, Bakar J, Ng SP. Effects of different wall materials on the physicochemical properties and oxidative stability of spray-dried microencapsulated red-fleshed pitaya (Hylocereuspolyrhizus) seed oil. Food Bioprocess Technol. 2012;5:1220–7. doi: 10.1007/s11947-011-0555-1. [DOI] [Google Scholar]
- 8.Mezzenga R, Ulrich S. Spray-dried oil powder with ultrahigh oil content. Langmuir. 2010;26:16658–61. doi: 10.1021/la103447n. [DOI] [PubMed] [Google Scholar]
- 9.Shen Z, Augustin MA, Sanguansri L, Cheng LJ. Oxidative stability of microencapsulated fish oil powders stabilized by blends of chitosan, modified starch, and glucose. J Agric Food Chem. 2010;58:4487–93. doi: 10.1021/jf904102k. [DOI] [PubMed] [Google Scholar]
- 10.Takeuchi H, Sasaki H, Niwa T, Hino T, Kawashima Y, Uesugi K, et al. Preparation of powered redispersible vitamin E acetate emulsion by spray-drying technique. Chem Pharm Bull. 1991;39:1528–31. doi: 10.1248/cpb.39.1528. [DOI] [PubMed] [Google Scholar]
- 11.Fasano WJ, Manning LA, Green JW. Rapid integrity assessment of rat and human epidermal membranes for in vitro dermal regulatory testing: correlation of electrical resistance with tritiated water permeability. Toxicol In Vitro. 2002;16:731–40. doi: 10.1016/S0887-2333(02)00084-X. [DOI] [PubMed] [Google Scholar]
- 12.Bamba J, Cavé G, Bensouda Y, Tchoreloff P, Puisieux F, Couarraze G. Cryoprotection of emulsions in freeze-drying: freezing process analysis. Drug Dev Ind Pharm. 1995;21:1749–60. doi: 10.3109/03639049509069262. [DOI] [Google Scholar]
- 13.Choi MJ, Briançon S, Bazile D, Royere A, Min SG, Fessi H. Effect of cryoprotectant and freeze-drying process on the stability of w/o/w emulsions. Dry Technol. 2007;25:809–19. doi: 10.1080/07373930701370183. [DOI] [Google Scholar]
- 14.Combrinck J, Otto A, Du Plessis J. Whey protein/polysaccharide-stabilized emulsions: effect of polymer type and pH on release and topical delivery of salicylic acid. AAPS PharmSciTech. 2014;15:588–600. doi: 10.1208/s12249-014-0081-3. [DOI] [PMC free article] [PubMed] [Google Scholar]
- 15.Lima EL, Muňoz LC, Harris RE, Caballero AMH. Potential applications of chitosan as a marine cosmeceutical. In: Kim SK, editor. Marine cosmeceuticals: trends and prospects. Boca Raton: CRC Press; 2012. pp. 319–33. [Google Scholar]