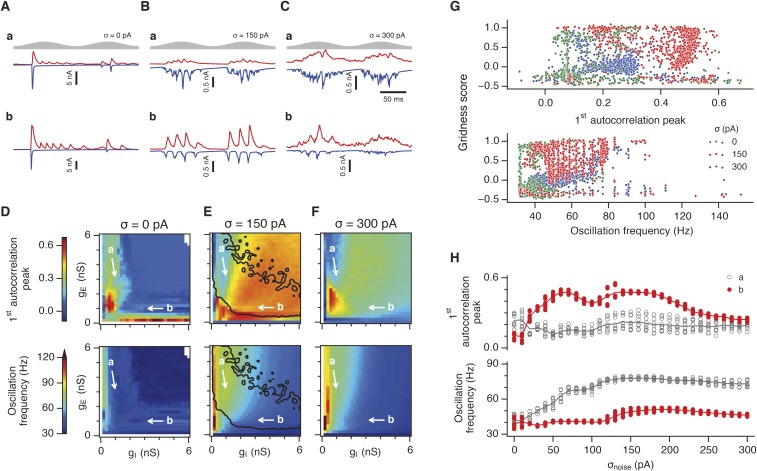
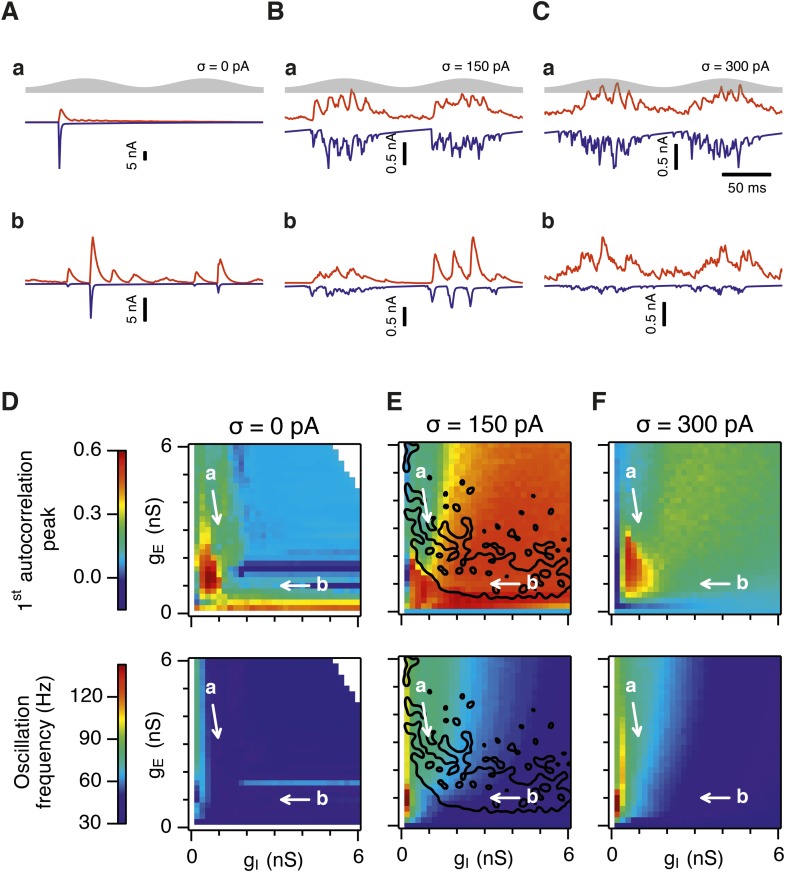
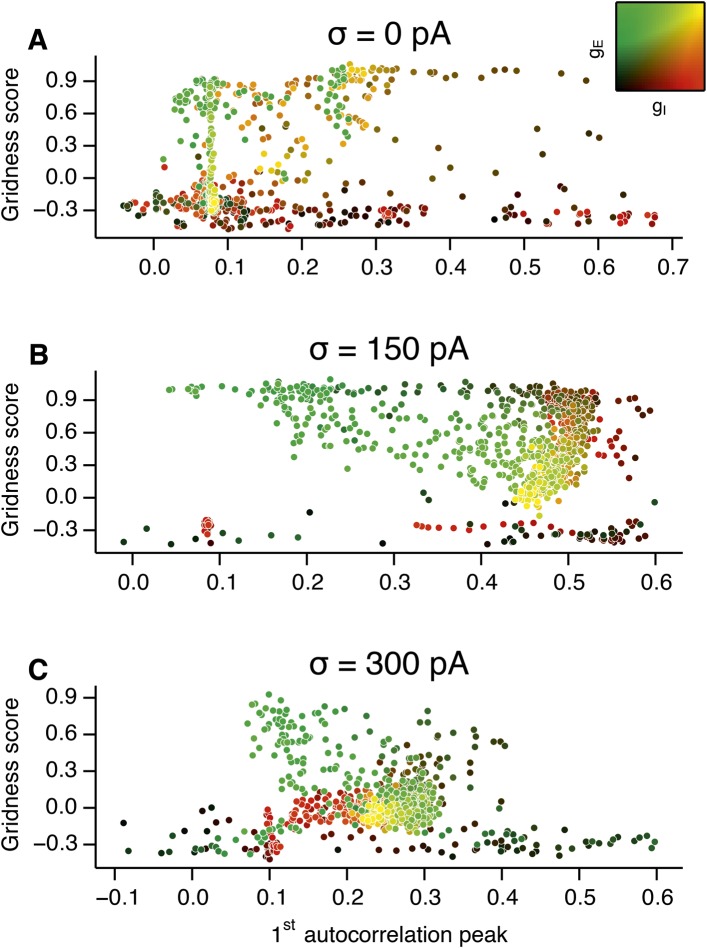
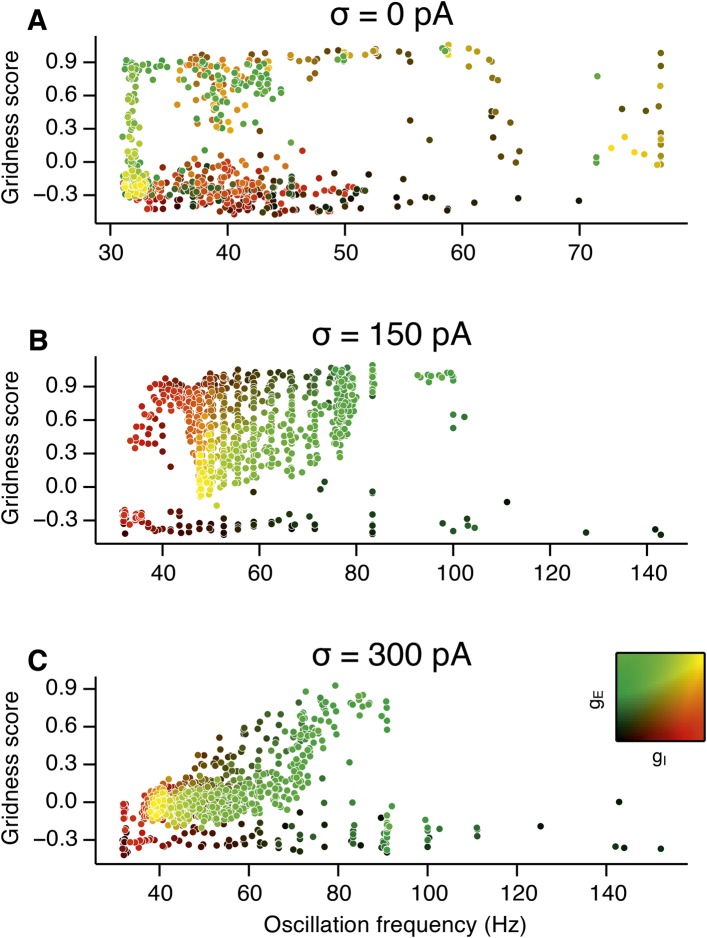
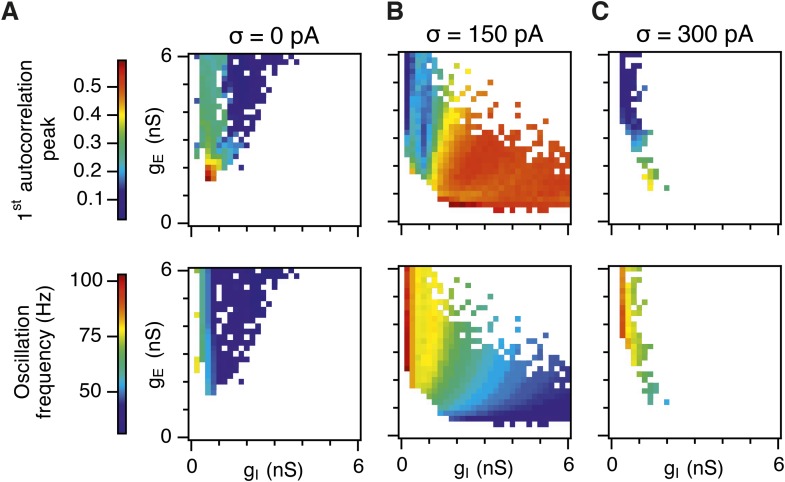
Figure 3. Differential sensitivity of gamma oscillations and grid fields to changes in the strength of E and I synapses.
(A–C) Examples of inhibitory (red) and excitatory (blue) synaptic currents recorded respectively from excitatory and inhibitory neurons from simulations highlighted by arrows in panels (D–F). (D–F) Top: Correlation value at the first local maximum of the autocorrelation of inhibitory synaptic currents (I → E cells, 25 randomly selected E cells), plotted as a function of gE and gI, for networks without noise (D), with noise level set to σ = 150 pA (E), and noise level set to σ = 300 pA (F). Each point is an average over five simulation trials. In these simulations velocity and place cell inputs were disabled. The duration of simulations was 10 s. Bottom: Frequency corresponding to the peaks of the autocorrelation functions for simulations in the top panels. Black lines in (E) indicate the region from Figure 2E where the gridness score = 0.5. (G) Scatter plots show gridness score as a function of gamma oscillation strength (top) and frequency (bottom) for simulations with noise absent (green), with an intermediate level of noise (red) and highest simulated noise level (blue). Each dot represents data from a single network configuration. (H) Top: Gamma oscillation strength plotted as a function of standard deviation of the noise current. Grey color indicates simulations with gE = 3 nS, gI = 1 nS (A). Red color indicates simulations with gE = 1 nS, gI = 3 nS (B). Bottom: Frequency corresponding to the detected autocorrelation peak.

