

Abstract
One of the many ways that climate change may affect human health is by altering the nutrient content of food crops. However, previous attempts to study the effects of increased atmospheric CO2 on crop nutrition have been limited by small sample sizes and/or artificial growing conditions. Here we present data from a meta-analysis of the nutritional contents of the edible portions of 41 cultivars of six major crop species grown using free-air CO2 enrichment (FACE) technology to expose crops to ambient and elevated CO2 concentrations in otherwise normal field cultivation conditions. This data, collected across three continents, represents over ten times more data on the nutrient content of crops grown in FACE experiments than was previously available. We expect it to be deeply useful to future studies, such as efforts to understand the impacts of elevated atmospheric CO2 on crop macro- and micronutrient concentrations, or attempts to alleviate harmful effects of these changes for the billions of people who depend on these crops for essential nutrients.
Subject terms: Environmental health, Risk factors, Plant physiology, Plant breeding
Background & Summary
Climate change may have numerous effects on human health, not least via effects on agriculture and nutrition. Because plant productivity is fundamentally tied to atmospheric CO2 by photosynthesis, changes in atmospheric CO2 concentration ([CO2]) may have cascading effects on numerous aspects of plant biochemistry. If these cascading effects include changes in the nutrient content of staple crops, this could have substantial implications for public health in regions where people rely on those crops for critical nutrients. Indeed, nutrient deficiencies are already a major global public health problem1–3.
Previous attempts to examine how increasing atmospheric [CO2] affects crop nutrition have been hampered by artificial growing conditions and/or small sample sizes. For instance, there were several reports of decreases in zinc, iron, and protein in wheat4–7, barley5, and rice8 grown in outdoor open-topped chambers or in indoor climate-controlled growth chambers. However, the advent of free-air CO2 enrichment (FACE) technology has allowed researchers to grow plants under standard field management practices while precisely manipulating local CO2 concentrations. Lieffering et al.9 grew rice in a FACE experiment more representative of standard field conditions and found no effect of elevated [CO2] on nutrients other than nitrogen. These authors suggested that previous significant results may be due to unintentional nutrient limitation caused by growing plants in pots. Several subsequent FACE experiments did find decreased nutrient concentrations associated with elevated [CO2] in soybean10, sorghum10, potatoes11, wheat12–14, and barley15, but many of these studies lacked the sample sizes necessary to determine whether potentially meaningful differences were significant.
Myers et al.16 grew and analyzed samples of rice (Oryza sativa, 18 cultivars), wheat (Triticum aestivum, 8 cultivars), maize (Zea mays, 2 cultivars), soybeans (Glycine max, 7 cultivars), field peas (Pisum sativum, 5 cultivars), and sorghum (Sorghum bicolor, 1 cultivar) under ambient versus elevated [CO2] in FACE experiments between 1998–2010. Ambient [CO2] was between 364–386 ppm and elevated [CO2] was between 546–586 ppm across all study sites, consistent with the lower end of global [CO2] predictions for the next 40–60 years17. We reported nutrient concentrations of the edible portions of these crops, and found that elevated [CO2] decreased many of their zinc, iron, and sometimes protein concentrations16.
These effects varied among plant functional types, with C3 grasses and legumes consistently affected and C4 plants less so. Effects on nutrient concentrations varied among different cultivars of the same crop species. Both large-scale (e.g., C3/C4 photosynthetic pathways) and small-scale (intraspecific) differences in plant physiology contribute to the effects observed. Interestingly, effects of elevated [CO2] also differed among 12 nutrients measured, indicating mechanisms more complex than carbohydrate dilution18,19. This study improved on previous work by using more crops, larger sample sizes, and FACE methods more representative of field conditions than older techniques such as open-topped chambers or fully enclosed growth chambers, resulting in over tenfold more samples than were previously available16, though see Loladze20.
Here we report the raw data presented by Myers et al.16 for use in further studies on the role of atmospheric [CO2] and other cultivation conditions on the nutrient content of food crops. While some aggregated data have been presented concerning agronomic response to elevated [CO2]13,14,21,22, we report cultivation conditions including water availability, fertilizer application, temperature, and growing season length, along with the nutrient concentrations of edible portions of crops. We also report edible tissue concentrations of phytic acid, a compound that has been shown to inhibit absorption of zinc and other nutrients in mammalian guts, and is mathematically related to bioavailable zinc uptake through the Miller equation23.
These data are expected to permit detailed analysis of the roles of cultivation conditions, including [CO2], on crop plants’ nutritional content, as well as more basic studies of their biochemistry that may include numerous nutrients simultaneously. This information will help identify threats to the health of billions of people worldwide who rely on these crops for essential nutrients. It will also provide insights about how to address these threats, for instance, by revealing which cultivars are more likely to provide more nutrition under elevated [CO2], thereby informing future crop breeding efforts.
Methods
Cultivation
Crops were grown in FACE experiments with paired designs, such that samples grown at ambient [CO2] (approximately 380 ppm) could be compared with samples grown under identical conditions except that [CO2] was elevated to approximately 550 ppm during daylight hours (during both day and night in the case of sorghum, and elevated to approximately 580 ppm, or 200 ppm above ambient, in the case of rice). More recent work has suggested that elevating [CO2] 24 h d−1 may give a more complete picture of the effects of climate change on plant physiology and biochemistry24. Many of these experiments also tested other variables, such as cultivar, irrigation, nitrogen application, and temperature. Detailed agronomic methods are available for wheat25, soybean26, maize27, sorghum28, rice29, and field peas25. The following descriptions outline the experimental designs for each crop, which underlie the structure of the data we present.
Wheat
Wheat samples (Triticum aestivum) were grown in Horsham, Victoria, Australia between 2007–2009. In 2007 and 2008, cultivars Yitpi and Janz were grown under full factorial manipulations of daytime [CO2] (ambient or elevated), irrigation (rainfed only or supplemental irrigation), and time of sowing (early or late), with four replicates per cultivar per year. Crops sown early, consistent with local practice, experience a cool, wet early season and a warmer, drier, late season. Late time of sowing was used to simulate predicted climate change more holistically by moving the growing season toward warmer and drier conditions. For cultivar Yitpi, these treatments were crossed further with a nitrogen (N) fertilizer treatment, with some plants receiving N fertilizer and others receiving none; cultivar Janz received no N fertilizer. Superphosphate was drilled with the seed at sowing at 7–9 kg P ha−1 and 8–11 kg S ha−1 each year, according to local practice. In 2009, this experiment was continued for cultivars Yitpi and Janz, and six more cultivars (Drysdale, Gladius, H45, Hartog, Silverstar, and Zebu) were added and exposed to the same treatments as Janz, again with four replicates per cultivar.
Additional samples of cultivar Yitpi were grown in Walpeup, Victoria, Australia (details published21) in 2008 and 2009. Time of sowing (early or late) and daytime [CO2] (ambient or elevated) were crossed in a full factorial design with four replicates per treatment per year. All plants received some supplemental irrigation in one season to avoid total crop loss to drought, and none received N fertilizer, as pre-sowing soil nitrate concentrations were high. Superphosphate was drilled at sowing at rates of 9 kg P ha−1 and 11 kg S ha−1 each year. Rainfall, temperature, and other meteorological conditions were recorded daily using automatic weather stations. Several papers analyzing these data have been published13,14,21,22.
Soybean
Soybean (Glycine max) was grown in Champaign, Illinois, USA between 2001–2008. The only growth condition manipulated was daytime [CO2] (ambient or elevated); plants received neither irrigation nor fertilizer. The choice of cultivars varied among years. In 2001, 2002, and 2004, seven cultivars were planted: Clark, Dwight, Flyer, Loda, Pana, Spencer, and Williams. In 2006 and 2007, only cultivar Pana was planted, and in 2008, only cultivars Pana and Loda were planted. In every case, samples were grown and collected from four replicates per cultivar per year.
In most cases, precipitation was recorded for the entire growing season. For the 2002 soybean crop, precipitation data were available for May 15 to September 30, but the growing season was June 1 to October 16. The presented precipitation value is total precipitation from June 1 to September 30; it may be more accurate to add the additional 40.5 mm of precipitation from May 15–31 to compensate for the lack of precipitation data for October 1–16.
Maize
Maize (Zea mays) was grown in Champaign, Illinois, USA in 2008. The two commercial hybrids Cv34B43 (Pioneer Hi-Bred International) and DKC61–19 (Dekalb) were both subjected to full factorial combinations of daytime [CO2] (ambient or elevated) and nitrogen fertilizer (present or absent), with four replicates per treatment per hybrid. Maize did not receive any irrigation. Although the hybrids used are not cultivars in the technical sense, we refer to them as cultivars elsewhere in this paper and dataset for simplicity.
Sorghum
Sorghum (Sorghum bicolor) was grown in Maricopa, Arizona, USA in 1998 and 1999. Atmospheric [CO2] (ambient or elevated 24 h d−1) and irrigation (low or high) treatments were varied in a full factorial design with four replicates per treatment per year. All crops received roughly equal applications of nitrogen and phosphorus fertilizer in both years.
Rice
Rice (Oryza sativa) was grown in Shizukuishi, Iwate, Japan in 2007 and 2008, and in Tsukubamirai, Ibaraki, Japan, in 2010. Rice fields in both sites were flooded for most of the growing season consistent with local practices. In 2007, three replicates of cultivar Akitakomachi were grown in Shizukuishi in a full factorial experiment crossing daytime [CO2] (ambient or elevated by approximately 200 ppm30) and temperature (normal, or elevated 2 °C by heating cables installed on the submerged soil surface31). In 2008, the 2007 experiment was repeated, and three replicates each of cultivars Koshihikari and Takanari were grown under ambient or elevated daytime [CO2] at normal (unmodified) temperatures. All rice grown in Shizukuishi received NPK fertilizer consistent with local practices.
A more complex rice experiment was grown in Tsukubamirai in 2010. Experimental variables included daytime [CO2] (ambient or elevated by approximately 200 ppm32), nitrogen application (none, standard, or increased 50–100% above standard levels), and temperature (ambient or elevated 2 °C by heating cables installed on the submerged soil surface31). There were four replicates per cultivar per treatment combination, but while daytime [CO2] was varied within each treatment, the rest of the design was not fully factorial. For 14 cultivars, only daytime [CO2] was varied and temperature was not manipulated. Of these, cultivars Aikoku, Akidawara, Akihikari, Akita63, Akitakomachi, and Norin8 received standard N application and cultivars Bekoaoba, Hoshiaoba, IR72, Hokuriku193, Lemont, Milyang23, Momiroman, and Nipponbare received increased N application. Cultivar Takanari was grown at ambient temperature under fully crossed daytime [CO2] and nitrogen (standard and increased) treatments. Cultivar SY63 was grown with standard N applications under fully crossed daytime [CO2] and temperature (ambient or increased) treatments. For cultivars 86Y8 and Koshihikari, all three variables (daytime [CO2], nitrogen, and temperature) were manipulated. Cultivar 86Y8 received only standard and increased N applications, while Koshihikari received zero, standard, and increased N applications. Samples of these two cultivars receiving standard N application were exposed to both ambient and increased temperature treatments, with other N treatments being grown only at ambient temperature. Increased N application levels were 100% above standard for all cultivars except Koshihikari, for which increased N applications were 50% above standard levels. All rice grown in Tsukubamirai received phosphorus and potassium fertilizer consistent with local practices.
Field peas
Field peas were grown in Horsham, Victoria, Australia in a full factorial experiment crossing daytime [CO2] (ambient or elevated) with supplemental irrigation (present or absent). Eight replicates of each of five cultivars (Bohatyr, Kaspa, OZP0601, OZP0902, and Sturt) were grown in 2010. Plants did not receive nitrogen fertilizer, but received superphosphate at rates of 9 kg P ha−1 and 11 kg S ha−1.
Elemental analysis
Samples of the edible portions of each crop were dried and ground for elemental analysis. Nitrogen concentration of soybeans, maize, sorghum, rice, and peas was determined by flash combustion coupled with thermal conductivity/IR detection of the resulting N2, NOx, and CO2 gases on a LECO TruSpec CN Analyzer33. Nitrogen concentration of wheat was measured by a similar technique on a LECO TruMac calibrated with EDTA34.
Inductively coupled plasma optical emission spectroscopy (ICP-OES) was used to measure sample P, K, S, B, Ca, Mg, Zn, Mn, Fe, and Cu concentrations. Wheat samples were prepared by sample digestion in nitric acid35. Samples of all other crops were digested by microwave heating in closed vessels with nitric acid and hydrogen peroxide. All nutrient concentrations are reported at 0% grain moisture concentration.
Phytic acid analysis
Phytic acid concentrations in the edible portions of crops were determined using a modification of the method of Haug and Lantzsch (1983; hereafter referred to as the ‘HL’ method)36. This method takes advantage of the ability of phytic acid to precipitate iron from a solution and consists of two basic steps. First, extracts containing phytic acid are incubated with solutions with known iron concentration. Following precipitation of iron phytate, the iron remaining in solution is quantitated. To determine phytic acid in tissue extracts, the results are compared with those obtained using a phytic acid standard curve. We express phytic acid as its phosphorus content (phytic acid phosphorus). One can convert phytic acid phosphorus to phytic acid by multiplying by 3.548.
Tissue samples were stored in a desiccator until analysis. If the samples received were whole grains, they were first milled to pass 40 mesh. For the iron precipitation step, 50 mg of tissue were extracted in 1.0 ml of extraction media (0.2 M HCL:10% Na2SO4) in 1.5 ml Eppendorf tubes overnight at 4 °C with shaking. Extracts were centrifuged (4,500 RCF, 20 min). The iron precipitations were set up as follows. A 25 μl aliquot of extract was placed in a second Eppendorf tube, to which was added 225 μl of extraction media and 500 μl of iron solution (0.2 gm Ammonium iron (III) sulfate dodecahydrate dissolved in 1.0 L 0.2 N HCl). A phytic acid phosphorus standard curve was set up similarly except that instead of aliquots of extract, 25 μl aliquots of phytic acid standards (see below) were used, to give from 0.625 to 12.5 μg phytic acid P per assay (Fig. 1). All tubes were then placed in a boiling water bath for 30 min, cooled to room temperature, and centrifuged (4,500 RCF:20 min). Aliquots (100 μl) of precipitation supernatant were pipetted into microtitre plate wells and 150 μl of ‘HL reagent’ (5.0 g 2,2'-bipyridine and 5.0 ml thioglycolic acid dissolved in 500 ml distilled water) was added. The plates were then read on a microtitre plate spectrophotometer at 510 nm. Duplicate extractions were conducted for each tissue sample and for each extraction, duplicate precipitations were conducted. The colorimetric assay of precipitation supernatant was conducted in triplicate. If the mean values obtained for the two extractions of a given tissue sample were not within 15% agreement, a third extraction was conducted, and the two values in best agreement were used to calculate sample mean.
Figure 1. A typical standard curve used to assay phytic acid using the HL method.
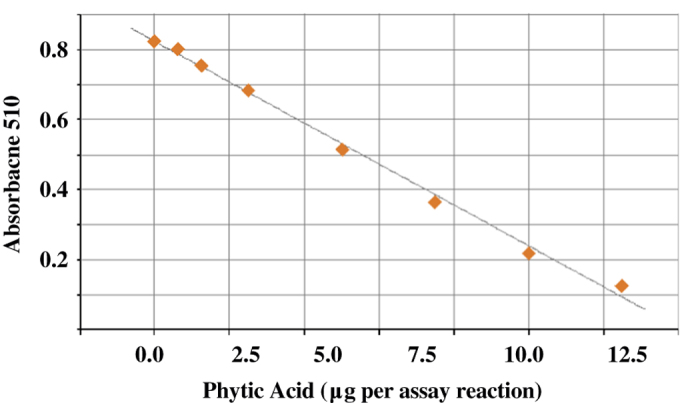
The known concentrations of phytic acid standards are plotted against their absorbance at 510 nm after sample processing. Please see text for details.
The phytic acid standard curve was prepared using commercially-obtained phytic acid (Sigma): a phytic acid dodecasodium salt hydrate. A stock solution of 100 ml of 1.0 mg phytic acid P ml−1 was prepared as follows: 549.9 mg Sigma phytic acid dodecasodium salt hydrate was dissolved into either 100 ml of 0.8 N HCl or 100 ml of 0.2 N HCl [(1.0 mg PAP/ml)(100 ml)(1022.8 g phytic acid dodecasodium salt hydrate/186 g PAP)=549.9 mg phytic acid dodecasodium salt hydrate per 100 ml]. These 1.0 mg ml−1 stocks were then used to prepare standard solutions that are 25, 50, 100, 200, 300, 400, and 500 μg phytic acid P ml−1.
Data Records
The dataset (Data Citation 1) is structured such that each row contains all of our data from a single plant sample, with columns representing growing conditions and resulting nutrient concentrations. Cells marked ‘NA’ indicate missing, unavailable, or inapplicable data. Column variable definitions are provided in Table 1 (available online only).
Table 1. Definitions of reported variables, corresponding to columns of the dataset (Data Citation 1).
| Variable | Definition |
|---|---|
| Row | An index, numbered 2–1153, to aid in sorting the dataset. |
| Study | Name of the study in which the plants were grown. |
| Data_Type | Indicates whether samples are raw data for use in analyses (‘RawData’), or duplicate samples used for technical validation (‘Validation’). |
| City | City in which samples were grown. |
| State | State in which samples were grown. |
| Country | Country in which samples were grown. |
| Year | Year in which samples were grown. |
| Crop | Crop species grown. Either wheat (Triticum aestivum), soybean (Glycine max), sorghum (Sorghum bicolor), corn (Zea mays), rice (Oryza sativa), or field peas (‘peas,’ Pisum sativum). |
| Elevated_CO2_Target_ppm | Target concentration for elevated [CO2] treatments, in parts per million (ppm). |
| Elevated_CO2_Achieved_ppm | Daytime average [CO2] in elevated [CO2] treatments, in ppm. |
| Ambient_CO2_ppm | Daytime average [CO2] in ambient (control) [CO2] treatments, in ppm. |
| FACE_Ring_Diameter_m | Diameter of FACE rings, in meters. |
| SampleCode | A unique number or character string identifying each sample. |
| Replicate | Denotes the experimental replicate, sometimes called ‘block’ in the accompanying literature, in which samples were grown. |
| Ring | Denotes the specific FACE ring in which samples were grown. |
| Plot | Location within a FACE ring in which samples were grown. This may differ among paired samples within a replicate. |
| Temperature_Qualitative | Temperature at which crops were grown; either ‘Ambient,’ for most crops, or ‘Elevated’ by 2 °C for some rice samples. |
| Water_Qualitative | Studies used up to two irrigation treatments. For studies using two irrigation treatments, ‘Wet’ and ‘Dry’ refer to samples that received more and less water, respectively. For studies that did not vary irrigation, this is ‘NA.’ |
| Precipitation_mm | Water crops received as precipitation during the growing season, in mm. |
| Irrigation_mm | Water crops received as irrigation during the growing season, in mm. |
| Total_Water_mm | Sum of precipitation and irrigation; the total amount of water available to crops during the growing season, in mm. |
| Nitrogen_Application_Qualitative | Studies used up to three levels of nitrogen fertilizer application per cultivar. ‘Low’ means no nitrogen applied to crops, ‘Medium’ means some nitrogen fertilizer applied to crops, and ‘High’ is reserved for greater amounts of nitrogen application than ‘Medium’ samples. ‘High’ nitrogen applications vary among rice cultivars. |
| Nitrogen_Application_Quantitative | Amount of nitrogen applied to crops as fertilizer, in kg N ha−1. |
| Phosphorus_Application_Quantitative | Amount of phosphorus applied to crops as fertilizer, in kg P ha−1. |
| Potassium_Application_Quantitative | Amount of potassium applied to crops as fertilizer, in kg K ha−1. |
| Sowing_Timing_Qualititative | Time of sowing (TOS) was an independent variable for the wheat experiments. ‘TOS1’ represents late autumn planting, typical for the region, and ‘TOS2’ represents a mid-winter planting. In general, ‘TOS2’ crops matured under hotter, drier conditions. For all other crops this is ‘NA.’ |
| Sowing_Timing_Quantitative | Date that crops were sown (mm/dd/yy). For rice, we present the date that seedlings were transplanted into hills in the field; seeds were planted in seedling trays approximately one month prior28,43. |
| Cultivar | Cultivar grown. |
| CO2_Treatment | Denotes whether a sample was grown at ambient [CO2] (‘aCO2’) or elevated [CO2] (‘eCO2’). |
| N_percent | Nitrogen concentration of sample, in percent of dry mass. |
| P_percent | Phosphorus concentration of sample, in percent of dry mass. |
| K_percent | Potassium concentration of sample, in percent of dry mass. |
| Ca_percent | Calcium concentration of sample, in percent of dry mass. |
| Mg_percent | Magnesium concentration of sample, in percent of dry mass. |
| Zn_ppm | Zinc concentration of sample, in ppm of dry mass. |
| Fe_ppm | Iron concentration of sample, in ppm of dry mass. |
| S_ppm | Sulfur concentration of sample, in ppm of dry mass. |
| B_ppm | Boron concentration of sample, in ppm of dry mass. |
| Mn_ppm | Manganese concentration of sample, in ppm of dry mass. |
| Cu_ppm | Copper concentration of sample, in ppm of dry mass. |
| Phy_Ext1_Precip1 | First of two precipitation measurements of phytic acid phosphorus from the first of up to three phytic acid extractions, in mg g−1. |
| Phy_Ext1_Precip2 | Second of two precipitation measurements of phytic acid phosphorus from the first of up to three phytic acid extractions, in mg g−1. |
| Phy_Ext1_Avg | Average of the two phytic acid phosphorus measurements from the first of up to three phytic acid extractions, in mg g−1. |
| Phy_Ext2_Precip1 | First of two precipitation measurements of phytic acid phosphorus from the second of up to three phytic acid extractions, in mg g−1. |
| Phy_Ext2_Precip2 | Second of two precipitation measurements of phytic acid phosphorus from the second of up to three phytic acid extractions, in mg g−1. |
| Phy_Ext2_Avg | Average of the two phytic acid phosphorus measurements from the second of up to three phytic acid extractions, in mg g−1. |
| Phy_Ext3_Precip1 | First of two precipitation measurements of phytic acid phosphorus from the third of up to three phytic acid extractions, in mg g−1. |
| Phy_Ext3_Precip2 | Second of two precipitation measurements of phytic acid phosphorus from the third of up to three phytic acid extractions, in mg g−1. |
| Phy_Ext3_Avg | Average of the two phytic acid phosphorus measurements from the third of up to three phytic acid extractions, in mg g−1. |
| Phy_Grand_Avg | Sample phytic acid phosphorus concentration in mg g−1. This is the average of the results from the first two extractions if they differed by less than 15%, otherwise a third extraction was performed and the two extractions in best agreement were averaged to generate this value. |
Technical Validation
Elemental analysis
Element concentration measurements were validated in two ways. First, experimental samples were interspersed with standard reference materials of known element concentrations, whose measured concentrations were confirmed to be within their certified acceptable ranges. Second, for most crops, every tenth sample was run in duplicate to ensure consistency; fewer than 5% of element concentration measurements in duplicated samples differed by more than 10%. For wheat samples, every 25th sample was run in duplicate. All results were different by less than 10%, and the series was reanalyzed if duplicates differed by more than 5%.
Phytic acid analysis
The following procedures were used to test the accuracy and reproducibility of the phytic acid assay method used here.
We first verified the concentration of the commercially-obtained phytic acid (Sigma) used to prepare the phytic acid standard curve. This reagent is a phytic acid dodecasodium salt hydrate, with a dodecasodium salt formula weight of 923.8, and a water content of 5.5 moles H2O per mole phytic acid. This product would then be 90.3% phytic acid dodecasodium salt with a phytic acid dodecasodium•H2O formula weight of 1022.8. To confirm this, two standard solutions were prepared with this product and were assayed six times, using the ‘ferric precipitation’ assay described below, and found to be within 2% of the predicted value, based on the above assumptions. Care was also taken to determine where the phytic acid standard curves produced from this reagent are linear for each method (Fig. 1).
Eight tissue standards with greatly varying levels of endogenous phytic acid were used as controls to indicate accuracy and reliability of the methods used (Table 2). One set of these eight tissue standards were tested for every 100 samples tested. Flours were produced using seed produced by three barley (Hordeum vulgare L.) lines37, two maize (Zea mays L.) hybrids38, and three soybean [Glycine max L. (Merr.)] lines39,40. Seed of the barley lines were produced by the USDA-ARS at Aberdeen, Idaho in 2006. Seed of the maize lines were produced for the USDA-ARS at a winter nursery station near Santiago, Chile in the winter of 2001. Seed of the soybean line CX183 was kindly provided by Seedomics Hybrid Corn Inc. (Forest, IN) and were produced in Indiana in the summer of 2002. Seed of the soybean lines Jack and CAPPA were produced at the University of Missouri, Columbia, in 2008.
Table 2. Validation of phytic acid phosphorus measurements.
| Species | Line |
Phytic Acid P |
||
|---|---|---|---|---|
| Ferric. Precip. (mg g−1) | HPLC (mg g−1) | HL Method (mg g−1±s.d.) | ||
| Phytic acid phosphorus in samples used as tissue controls as determined using the ‘ferric precipitation method,’ HPLC, or the HL method used in the FACE analyses in the Raboy lab. (s.d.=Standard Deviation). | ||||
| Barley | Harrington | 1.99 | 2.71 | 2.55±0.32 |
| Barley | lpa1-1-M422 | 1.05 | 1.17 | 1.08±0.21 |
| Barley | lpa-M955 | 0.15 | 0.15 | 0.25±0.11 |
| Maize | Normal-WT | 2.73 | 3.86 | 3.68±0.46 |
| Maize | lpa1-1 | 1.2 | 1.65 | 1.36±0.21 |
| Soybean | Jack | 4.21 | 4.95 | 4.68±0.25 |
| Soybean | CX-183 | 1.42 | 1.45 | 1.28±0.23 |
| Soybean | CAPPA | 0.48 | 0.38 | 0.17±0.06 |
| Standard Deviation of the Mean | 0.16 (n=3) | 0.07 (n=3) | 0.12 (n=5) |
The lines included as tissue standards in this study either produced seed with phytic acid levels typical of crops produced today or with reduced seed phytic acid due to either low phytic acid (lpa) genotype or genetic engineering to over-express the enzyme phytase in seeds. The ‘normal phytic acid’ lines were the barley cv. Harrington (the genetic background in which the lpa genotypes included in this study were isolated), a maize hybrid produced by crossing the public inbred lines A632 and A619 (the ‘near-isogenic’ hybrid for the A631XA619 lpa1-1 included in this study), and the soybean cultivar ‘Jack’ (the control for the lpa CX183 and the ‘high phytase’ ‘CAPPA’, respectively). The ‘reduced phytic acid’ lines were the genotypes barley lpa1-1 and barley lpa-M955, each in the Harrington background, maize lpa1-1 as a A632XA619 isohybrid, soybean CX183, and the genetically-engineered soybean line ‘CAPPA’, in which a bacterial phytase is overexpressed in developing seed.
To calibrate the level of phytic acid in seed produced by these lines, these tissue standards were analyzed for phytic acid phosphorus using two methods previously shown to be highly accurate and reproducible; the ‘ferric precipitation’ method38 and a high pressure liquid chromatography (HPLC) method (analyses kindly provided by Dr Sören Rasmussen, University of Copenhagen, Denmark).
The ferric precipitation method assays total, acid-soluble inositol phosphates, referred to here as phytic acid P38,41. Previous HPLC analyses indicate that in most genotypes >90% of total seed inositol phosphate consists of phytic acid (inositol hexakisphosphate), with the remainder consisting of less highly phosphorylated inositol phosphates such as inositol tetrakisphosphate or pentakisphosphate37. Thus use of the term ‘phytic acid P’ for total inositol phosphate is accurate in most cases. Aliquots of tissue (0.5 gm) were extracted in 0.4 M HCl:0.7 M Na2SO4 by shaking overnight at 4 °C. Following centrifugation (10,000 g for 10 min) and filtering through Whatman #1, phytic acid P in 10 ml of supernatant was obtained as a ferric precipitate, wet-ashed and assayed for P colorimetrically. Phytic acid P is expressed in terms of its P (atomic weight 31) content to facilitate comparisons between seed P fractions and methods of determination. All assays were conducted in triplicate.
For determination of flour phytic acid P using HPLC, flour samples (40 mg) were extracted in 1.6 ml 0.5 M HCl (30% Suprapur, Merck) by shaking overnight at 4 °C. Following centrifugation (10,000 g for 10 min) supernatants were filtered through a 0.45 μm syringe filter (Pall Life Sciences). Aliquots of filtered extract (100 μl) were fractionated via ion-exchange chromatography using a chemically inert HPLC system 10Avp series (Shimadzu, Kyoto, Japan) equipped with a CarboPac PA-100 column (Dionex). Phytic acid peaks were detected post-column as described by Bohn et al.42 following the protocol of Carlsson et al.43, and quantitated via comparison with a standard curve prepared using reagent grade phytic acid (Sigma). The range of quantification was 1 to 30 nmol phytic acid per 100 μl sample injected. All assays were conducted in triplicate.
The accuracy and reproducibility of the ‘HL’ method used here is illustrated by comparing the means and Standard Deviation of the Means (‘Standard Errors’) obtained in an HL method run with that obtained with these other two methods (Table 2).
Additional Information
Table 1 is only available in the online version of this paper.
How to cite this article: Dietterich, L. H. et al. Impacts of elevated atmospheric CO2 on nutrient content of important food crops. Sci. Data 2:150036 doi: 10.1038/sdata.2015.36 (2015).
Supplementary Material
Acknowledgments
We thank H. Nakamura, T. Tokida, and C. Zhu for contributions to the RiceFACE project. We thank the following for financial support of this work: the Bill & Melinda Gates Foundation; the Winslow Foundation; the Commonwealth Department of Agriculture (Australia), the International Plant Nutrition Institute, (Australia), the Grains Research and Development Corporation (Australia), the Ministry of Agriculture, Forestry and Fisheries (Japan); the National Science Foundation (NSF IOS-13-58675); USDA NIFA 2008-35100-044459; research at SoyFACE was supported by the US Department of Agriculture, Agricultural Research Service, which also provided support via the Small Grains and Potato Research Unit, Aberdeen ID; Illinois Council for Food and Agricultural Research (CFAR); Department of Energy’s Office of Science (BER) Midwestern Regional Center of the National Institute for Climatic Change Research at Michigan Technological University, under Award Number DEFC02- 06ER64158; and the National Research Initiative of Agriculture and Food Research Initiative Competitive Grants Program Grant no. 2010-65114-20343 from the USDA National Institute of Food and Agriculture. Early stages of this work received support from Harvard Catalyst|The Harvard Clinical and Translational Science Center (National Center for Research Resources and the National Center for Advancing Translational Sciences, National Institutes of Health Award 8UL1TR000170-05). Samuel S. Myers had full access to all the data in the study and takes responsibility for the integrity of the data and the accuracy of the data analysis.
Footnotes
The authors declare no competing financial interests.
Data Citations
- Dietterich L. H. 2015. Figshare. http://dx.doi.org/10.6084/m9.figshare.1399218
References
- Tulchinsky T. H. Micronutrient deficiency conditions: global health issues. Public Health Reviews 32, 243–255 (2010). [DOI] [PMC free article] [PubMed] [Google Scholar]
- Caulfield L. E., Black R. E. in Comparative Quantification of Health Risks: Global and Regional Burden of Disease Attributable to Selected Major Risk Factors (eds Ezzati M., Lopez A. D., Rodgers A. & Murray C. J. L. ) 1 (World Health Organization, 2004). [Google Scholar]
- Stoltzfus R. J., Mullany L., Black R. E. in Comparative Quantification of Health Risks: Global and Regional Burden of Disease Attributable to Selected Major Risk Factors (eds Ezzati M., Lopez A. D., Rodgers A. & Murray C. J. L. ) 1 (World Health Organization, 2004). [Google Scholar]
- la Puente, de L. S., Perez P. P., Martinez-Carrasco R., Morcuende R. M. & del Molino I. M. M. Action of elevated CO2 and high temperatures on the mineral chemical composition of two varieties of wheat. Agrochimica 44, 221–230 (2000). [Google Scholar]
- Manderscheid R., Bender J., Jäger H.-J. & Weigel H. J. Effects of season long CO2 enrichment on cereals. II. Nutrient concentrations and grain quality. Agriculture, Ecosystems and Environment 54, 175–185 (1995). [Google Scholar]
- Fangmeier A., Grüters U., Högy P., Vermehren B. & Jäger H.-J. Effects of elevated CO2, nitrogen supply and tropospheric ozone on spring wheat-II. Nutrients (N, P, K, S, Ca, Mg, Fe, Mn, Zn). Environmental Pollution 96, 43–59 (1997). [DOI] [PubMed] [Google Scholar]
- Pleijel H. et al. Effects of elevated carbon dioxide, ozone and water availability on spring wheat growth and yield. Physiologia Plantarum 108, 61–70 (2000). [Google Scholar]
- Seneweera S. P. & Conroy J. P. Growth, grain yield and quality of rice (Oryza sativa L.) in response to elevated CO2 and phosphorus nutrition. Soil Science and Plant Nutrition 43, 1131–1136 (1997). [Google Scholar]
- Lieffering M., Kim H.-Y., Kobayashi K. & Okada M. The impact of elevated CO2 on the elemental concentrations of field-grown rice grains. Field Crops Research 88, 279–286 (2004). [Google Scholar]
- Prior S. A., Runion G. B., Rogers H. H. & Torbert H. A. Effects of atmospheric CO2 enrichment on crop nutrient dynamics under no-till conditions. Journal of Plant Nutrition 31, 758–773 (2008). [Google Scholar]
- Högy P. & Fangmeier A. Atmospheric CO2 enrichment affects potatoes: 2. Tuber quality traits. European Journal of Agronomy 30, 85–94 (2009). [Google Scholar]
- Högy P. et al. Effects of elevated CO2 on grain yield and quality of wheat: results from a 3-year free-air CO2 enrichment experiment. Plant Biology 11, 60–69 (2009). [DOI] [PubMed] [Google Scholar]
- Fernando N. et al. Elevated CO2 alters grain quality of two bread wheat cultivars grown under different environmental conditions. Agriculture, Ecosystems and Environment 185, 24–33 (2014). [Google Scholar]
- Fernando N. et al. Intra-specific variation of wheat grain quality in response to elevated [CO2] at two sowing times under rain-fed and irrigation treatments. Journal of Cereal Science 59, 137–144 (2014). [Google Scholar]
- Erbs M. et al. Effects of free-air CO2 enrichment and nitrogen supply on grain quality parameters and elemental composition of wheat and barley grown in a crop rotation. Agriculture, Ecosystems and Environment 136, 59–68 (2010). [Google Scholar]
- Myers S. S. et al. Increasing CO2 threatens human nutrition. Nature 510, 139–142 (2014). [DOI] [PMC free article] [PubMed] [Google Scholar]
- Fisher B. S. et al. in Climate Change 2007: Mitigation. Contribution of Working Group III to the Fourth Assessment Report of the Intergovernmental Panel on Climate Change (eds Metz, B., Davidson, O. R., Bosch, P. R. Dave, R., Meyer, L. A.) (Cambridge University Press, Cambridge, UK, 2007). [Google Scholar]
- Gifford R. M., Barrett D. J. & Lutze J. L. The effects of elevated [CO2] on the C: N and C: P mass ratios of plant tissues. Plant Soil 224, 1–14 (2000). [Google Scholar]
- McGrath J. M. & Lobell D. B. Reduction of transpiration and altered nutrient allocation contribute to nutrient decline of crops grown in elevated CO2 concentrations. Plant, Cell & Environment 36, 697–705 (2013). [DOI] [PubMed] [Google Scholar]
- Loladze I. Hidden shift of the ionome of plants exposed to elevated CO2 depletes minerals at the base of human nutrition. elife 3, e02245 (2014). [DOI] [PMC free article] [PubMed] [Google Scholar]
- Fernando N. et al. Rising atmospheric CO2 concentration affects mineral nutrient and protein concentration of wheat grain. Food Chemistry 133, 1307–1311 (2012). [Google Scholar]
- Fernando N. et al. Wheat grain quality under increasing atmospheric CO2 concentrations in a semi-arid cropping system. Journal of Cereal Science 56, 684–690 (2012). [Google Scholar]
- Miller L. V., Krebs N. F. & Hambidge K. M. A mathematical model of zinc absorption in humans as a function of dietary zinc and phytate. Journal of Nutrition 137, 135–141 (2007). [DOI] [PMC free article] [PubMed] [Google Scholar]
- Asensio J. S. R., Rachmilevitch S. & Bloom A. J. Responses of Arabidopsis and wheat to rising CO2 depend on nitrogen source and nighttime CO2 levels. Plant Physiology 168, 156–163 (2015). [DOI] [PMC free article] [PubMed] [Google Scholar]
- Mollah M., Norton R. & Huzzey J. Australian grains free-air carbon dioxide enrichment (AGFACE) facility: design and performance. Crop and Pasture Science 60, 697 (2009). [Google Scholar]
- Gillespie K. M. et al. Greater antioxidant and respiratory metabolism in field-grown soybean exposed to elevated O3 under both ambient and elevated CO2 . Plant, Cell & Environment 35, 169–184 (2011). [DOI] [PubMed] [Google Scholar]
- Markelz R. J. C., Strellner R. S. & Leakey A. D. B. Impairment of C4 photosynthesis by drought is exacerbated by limiting nitrogen and ameliorated by elevated [CO2] in maize. Journal of Experimental Botany 62, 3235–3246 (2011). [DOI] [PubMed] [Google Scholar]
- Ottman M. J. et al. Elevated CO2 increases sorghum biomass under drought conditions. New Phytologist 150, 261–273 (2001). [Google Scholar]
- Hasegawa T. et al. Rice cultivar responses to elevated CO2 at two free-air CO2 enrichment (FACE) sites in Japan. Functional Plant Biology 40, 148 (2013). [DOI] [PubMed] [Google Scholar]
- Okada M. et al. Free‐air CO2 enrichment (FACE) using pure CO2 injection: system description. New Phytologist 150, 251–260 (2001). [Google Scholar]
- Adachi M. et al. Soil and water warming accelerates phenology and down-regulation of leaf photosynthesis of rice plants grown under free-air CO2 enrichment (FACE). Plant and Cell Physiology 55, 370–380 (2014). [DOI] [PMC free article] [PubMed] [Google Scholar]
- Nakamura H. et al. Performance of the enlarged rice-FACE system using pure CO2 installed in Tsukuba, Japan. Journal of Agricultural Meteorology 68, 15–23 (2012). [Google Scholar]
- 972.43, A. O. M. in Official Methods of Analysis of AOAC International 18th edn. Revision 1, 2006 Ch. 12, 5–6 (AOAC International, 2006). [Google Scholar]
- Panozzo J. F. et al. Elevated carbon dioxide changes grain protein concentration and composition and compromises baking quality. A FACE study. Journal of Cereal Science 60, 461–470 (2014). [Google Scholar]
- Zarcinas B. A., Cartwright B. & Spouncer L. R. Nitric acid digestion and multi‐element analysis of plant material by inductively coupled plasma spectrometry. Communications in Soil Science & Plant Analysis 18, 131–146 (1987). [Google Scholar]
- Haug W. & Lantzsch H.-J. Sensitive method for the rapid determination of phytate in cereals and cereal products. Journal of the Science of Food and Agriculture 34, 1423–1426 (1983). [Google Scholar]
- Dorsch J. A. et al. Seed phosphorus and inositol phosphate phenotype of barley low phytic acid genotypes. Phytochemistry 62, 691–706 (2003). [DOI] [PubMed] [Google Scholar]
- Raboy V. et al. Origin and seed phenotype of maize low phytic acid 1-1 and low phytic acid 2-1. Plant Physiology 124, 355–368 (2000). [DOI] [PMC free article] [PubMed] [Google Scholar]
- Wilcox J. R., Premachandra G. S., Young K. A. & Raboy V. Isolation of high seed inorganic P, low-phytate soybean mutants. Crop Science 40, 1601–1605 (2000). [Google Scholar]
- Bilyeu K. D. et al. Quantitative conversion of phytate to inorganic phosphorus in soybean seeds expressing a bacterial phytase. Plant Physiology 146, 468–477 (2008). [DOI] [PMC free article] [PubMed] [Google Scholar]
- Raboy V., Dickinson D. B. & Below F. E. Variation in seed total phosphorus, phytic acid, zinc, calcium, magnesium, and protein among lines of Glycine max and G. soja . Crop Science 24, 431–434 (1984). [Google Scholar]
- Bohn L., Josefsen L., Meyer A. S. & Rasmussen S. K. Quantitative analysis of phytate globoids isolated from wheat bran and characterization of their sequential dephosphorylation by wheat phytase. Journal of Agricultural and Food Chemistry 55, 7547–7552 (2007). [DOI] [PubMed] [Google Scholar]
- Carlsson N.-G., Bergman E.-L., Skoglund E., Hasselblad K. & Sandberg A.-S. Rapid analysis of inositol phosphates. Journal of Agricultural and Food Chemistry 49, 1695–1701 (2001). [DOI] [PubMed] [Google Scholar]
Associated Data
This section collects any data citations, data availability statements, or supplementary materials included in this article.
Data Citations
- Dietterich L. H. 2015. Figshare. http://dx.doi.org/10.6084/m9.figshare.1399218