Abstract
The Mars Science Laboratory (MSL) made a successful landing at Gale crater early August 2012. MSL has an environmental instrument package called the Rover Environmental Monitoring Station (REMS) as a part of its scientific payload. REMS comprises instrumentation for the observation of atmospheric pressure, temperature of the air, ground temperature, wind speed and direction, relative humidity (REMS-H), and UV measurements. We concentrate on describing the REMS-H measurement performance and initial observations during the first 100 MSL sols as well as constraining the REMS-H results by comparing them with earlier observations and modeling results. The REMS-H device is based on polymeric capacitive humidity sensors developed by Vaisala Inc., and it makes use of transducer electronics section placed in the vicinity of the three humidity sensor heads. The humidity device is mounted on the REMS boom providing ventilation with the ambient atmosphere through a filter protecting the device from airborne dust. The final relative humidity results appear to be convincing and are aligned with earlier indirect observations of the total atmospheric precipitable water content. The water mixing ratio in the atmospheric surface layer appears to vary between 30 and 75 ppm. When assuming uniform mixing, the precipitable water content of the atmosphere is ranging from a few to six precipitable micrometers.
Key Points
Atmospheric water mixing ratio at Gale crater varies from 30 to 140 ppm
MSL relative humidity observation provides good data
Highest detected relative humidity reading during first MSL 100 sols is RH75%
Keywords: Mars, atmosphere, humidity, total water content, MSL, Gale
1. Introduction
The Mars Science Laboratory (MSL) landed on 6 August 2012 (Ls≈151°) at 4.6°S, 137.4°E at 4.5 km below the datum. The site is on the floor of the Gale crater, a 154 km diameter formation located in the NE portion of the Aeolis quadrangle, on the boundary between the southern cratered highlands and the lowlands of Elysium Planitia [Wray, 2013].
The MSL payload includes the Rover Environmental Monitoring Station (REMS), which comprises instrumentation for the measurement of several atmospheric and surface parameters [Gómez-Elvira et al., 2012]. This paper describes the first observations of the relative humidity subsystem (REMS-H) as well as initial interpretation of those results. Section 2 provides background regarding the REMS-H and water in the Martian system, the design and structure of the REMS-H are described in section 3, calibration in section 4, operations and performance in section 5, observations in section 6 with conclusions and discussion in section 7.
2. Background
The general size, surface gravity, rotation rate, inclination, and length of year of Earth and Mars are either very close or at least within 1 order of magnitude of each other [Kieffer et al., 1992]. They allude to parallels in atmospheric characteristics and phenomena as well [Zurek, 1992; Zurek et al., 1992].
The conspicuousness of oceans attests of the significance of water in the Earth system and in its physical and chemical processes. Water is also a prerequisite for Earth-type life. Presence and behavior of water in the Mars system is hence of paramount scientific interest.
Three reservoirs of water have been identified in the current Martian system: the polar caps, the regolith, and the atmosphere (including clouds). The atmosphere is also the primary conduit of exchange between the other two reservoirs.
Mars has been known to possess an atmosphere since the early nineteenth century [Martin et al., 1992; Zurek, 1992]. The first firm detection of water vapor in the atmosphere was made by Spinrad et al. [1963] using spectroscopic ground-based observations. They estimated the globally averaged column abundance (thickness of liquid water, if the entire column content were condensed onto the surface) to be ∼10 precipitable μm (pr μm). The corresponding quantity in the Earth's atmosphere is several centimeters [e.g., Jakosky and Haberle, 1992]. The Martian atmosphere is hence extremely dry in absolute terms. Despite of the thinness of the atmosphere, latent heat associated with phase changes of water (unlike in the terrestrial atmosphere) plays virtually no role in the dynamics of the atmosphere.
Polar caps and their seasonal cycle had been observed since the second half of the nineteenth century [Thomas et al., 1992]. The compositions of the caps were not known, but they were suspected to include water ice.
In late 1960s Mariner 9 detected water ice clouds from orbit [Masursky et al., 1972], but the observations covered only a part of the globe and were equally temporally limited. Occurrence of water clouds implies that relative humidity of the atmosphere can reach saturation. The images also revealed geological features, which highly likely were shaped by water [Milton, 1973]. The Viking Orbiters' Infrared Thermal Mapper instrument inferred that the northern polar cap was composed of water ice [Kieffer et al., 1976], and the Mars Atmospheric Water Detector (MAWD) spectrometers made the first spatially and temporally comprehensive (seasonal) observations of atmospheric water vapor, which also indicated that the exposed northern polar cap was composed of water ice [Farmer et al., 1977]. The Phobos 2 solar occultation instrument Auguste provided water vapor vertical profiles [Korablev et al., 2001] and the Mars Global Surveyor Thermal Emission Spectrometer (MGS/TES) mapped the spatial and temporal variations in water vapor in greater detail and over a longer period of time [Smith et al., 2001]. The Mars Odyssey Gamma Ray Spectrometer (GRS) instrument discovered subsurface hydrogen, a plausible explanation for this is the presence of ice-rich layers in the regolith [Boynton et al., 2002].
In situ observations related to water started with the Viking Landers: their imaging systems observed condensation and sublimation of ground frost [Wall, 1981], and the mass spectrometers were able to measure water content of the regolith [Biemann et al., 1977]. The two Mars Exploration Rovers detected both geological evidence of past water flowing on the surface of Mars [Morris et al., 2006] and despite of lack of dedicated meteorological instrumentation, the Thermal Emission Spectrometer (Mini-TES) instruments allowed for estimation of atmospheric water column abundance as well its diurnal and seasonal variations above the rovers. Nighttime observations are, however, rare due to operational constraints [Smith et al., 2006]. The Phoenix lander confirmed the Odyssey/GRS results with the discovery of water ice table 4 cm below the surface [Sizemore et al., 2010], and the Phoenix LIDAR observed water ice clouds and precipitation of water ice [Whiteway et al., 2009].
The Martian atmospheric pressure and temperature conditions imply that pure liquid water can occur (even theoretically) only in the lowest areas of the planet's surface [Haberle et al., 2001]. However, the Phoenix lander images have been interpreted to indicate water (brine) droplets on the surface and on lander structures [Rennó et al., 2009].
Observations of the Martian atmosphere—its circulation and climate characteristics—have been accompanied, supplemented, and interpreted by increasingly sophisticated and varied modeling efforts in a range of spatial and temporal scales since late 1960s [e.g., Leovy and Mintz, 1969; Pollack et al., 1990, 1993; Haberle et al., 1993; Barnes et al., 1993; Forget et al., 1999; Richardson et al., 2007].
The thermodynamics of water (especially phase changes), insolation, and radiative processes, the water inventories of the reservoirs, atmospheric general circulation patterns as well as the exchange processes within and between the reservoirs provide the basis and constraints of the water cycle and need to taken into account in modeling it. This section provides an overview of the present-day Martian water cycle to the degree it is relevant to understanding and interpretation of the REMS-H observations.
The axial tilt of Mars' rotation axis results in qualitatively similar seasons as those of Earth. The longer period and larger eccentricity of the orbit cause significant quantitative differences, e.g., hemispherical asymmetries—also affected by the asymmetries of Mars' topography [Smith et al., 1999]. The sizes of the polar caps differ, the maximum size of the southern cap is up to 3 times that of the northern cap [James et al., 1992].
During the winter seasons the poles are in darkness and the low temperatures allow both water and CO2 to condense. Both polar caps have a permanent (or residual) and a seasonal component. The seasonal component is composed primarily of CO2 and to lesser degree of water ice. Due to Mars' orbital eccentricity, the southern CO2 condensation season is significantly longer than the northern one, and as a result the amount of CO2 condensed is larger in the south. In the north the seasonal frost sublimates essentially completely during the spring and early summer, exposing all or most of the underlying residual water ice cap; in the south large fraction of the CO2 ice remains, and only part of the water ice is exposed. Water ice sublimates; water vapor content in the atmosphere above increases; and water is carried away by the winds. The summertime water ice caps are the major sources of atmospheric water vapor. With decreasing temperatures first water ice begins to condense onto the residual cap, and polar ice cap water sources will shut off. When temperatures fall even further, CO2 ice again begins to cover the water ice.
Although there is interannual variation (e.g., in some years the water ice in the south appears not to have been exposed at all, and the atmosphere is thought to lose water into south pole CO2 cold traps [Trainer et al., 2010]), the year-to-year atmospheric water budget appears to be essentially in equilibrium. Some unidentified source (e.g., regolith or surface ice units at the south pole [Jakosky, 1983]) is compensating for the water lost to the cold traps and global circulation model (GCM) simulations suggest that an active regolith may not be necessary to maintain the equilibrium [Richardson and Wilson, 2002]. The regolith may, however, play an important role in the real Martian atmosphere [Böttger et al., 2005].
Thermal considerations of present-day Mars imply that water ice is unstable between latitudes ±30°N. There is, however, evidence of water reservoirs even in these latitudes, e.g., metastable subsurface ice left over from a previous epoch, hydrated salts, and liquid aquifers as well as pockets of near-surface water ice due to local geography such as poleward facing slopes [e.g., Vincendon et al., 2010]—all of potential relevance to in situ water measurements in this latitude range.
The surface of Mars is covered by a blanket of particles called regolith, consisting of silicate dust and sandy materials with some areas covered in rocks and boulders. Due to its particulate nature, the regolith is porous. The voids (which may represent a large fraction of the volume) may be filled to a varying degree with water vapor, liquid, or ice; thus, the regolith can act as source or sink toward the atmosphere. The water ice content may vary the regolith thermal conductivity by an order of magnitude; hence, the exchange of water between the regolith and the atmosphere could significantly modify the regolith's response to insolation due to changes in thermal inertia [Kuzmin et al., 2012] or due to frost deposits around the edge of the polar caps [Presley and Christensen, 1997].
The REMS-H observations take place in the near-surface layer of the atmosphere and are hence directly and primarily relevant for characterization of the current water cycle and exchange processes between the atmosphere and the regolith in MSL's region and seasons of operation, in timescales from diurnal to seasonal. Due to the mobility of the MSL platform, the REMS-H samples areas of varying surface characteristics, which may affect the surface-atmosphere exchange processes in a detectable way. The observations provide also support for orbital remote sensing observations as well as constraints for modeling of the cycles and processes in larger spatial and longer temporal scales (from interannual to geological).
3. The REMS-H Humidity Device
The REMS-H transducer includes three Humicap®; sensor heads and one Thermocap®; temperature sensor head manufactured by Vaisala, Inc. The transducer electronics and the sensor heads are placed on a single multilayer printed circuit board (PCB) of a 36 × 15 mm size protected by a metallic Faraday cage. The PCB is supported by a mechanical interface mounted on the REMS Boom. The Faraday cage is perforated to allow sufficient ventilation. The holes are covered with a polytetrafluoroethylene (PTFE) filter material to protect the sensor head from dust. Figure 1 illustrates the REMS-H device on the sensor head level as well as with the Faraday cage and the filter.
Figure 1.
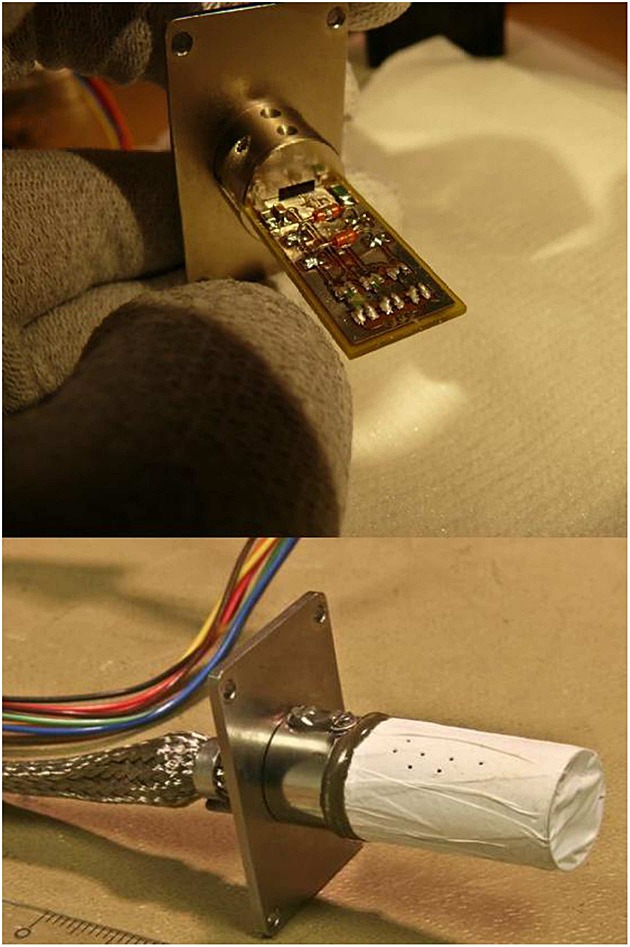
The REMS-H instrument depicted (top) without the dust filter and (bottom) with the filter.
The Humicap®; sensor heads contain an active polymer film that changes its capacitance as function of relative humidity, with 0 to 100% relative humidity (RH) measurement range. The capacitance is calculated with help of known, constant reference channels that are part of the transducer electronics. The algorithm of deducing capacitance from the raw frequencies of the channels is proprietary information of Vaisala Inc. The calibration discussion in section 4 is based on the capacitances calculated from raw data.
The polymer film of Humicap®; sensor heads reacts to the relative humidity, even if the instrument is not powered. Once powered, the relative humidity can be read almost immediately (1 s is allowed for electronic stabilization). Nominal capacitance of Humicap®; is in order of 6 pF. The dynamic range of the Humicap®; changes with temperature, being approximately 1 pF around 0°C and about 0.3 pF around −70°C. The Humicap®; also becomes logarithmically slower with lower temperature, its time constant is about 0.1 s at +20°C, but, for example, at −40°C it is about 30 s and at −70°C about 700 s. The protective dust filter adds to the time lag. The lag is in order of hours in −70°C. It can be mathematically partially compensated on-ground, as explained in section 4 below. The Thermocap®; temperature sensor head has a negligible time lag.
The Humicap®; sensor heads also have Pt heating resistors that are used periodically to heat the sensor heads to +135°... 150°C to eliminate possible contaminants that can affect the capacitance. This is called regeneration of the sensor. Regeneration consumes about 0.5 W during 5 min period. The immediate effect of the regeneration in dry conditions is that relative humidity reading rises about 1–2% RH. In wet conditions the rise can be in order of few percent RH. Without periodic regeneration, the capacitance of the Humicap®; sensor heads tends to get lower thus producing lower humidity values.
An example of regeneration effect in laboratory conditions is presented in Figure 2.
Figure 2.
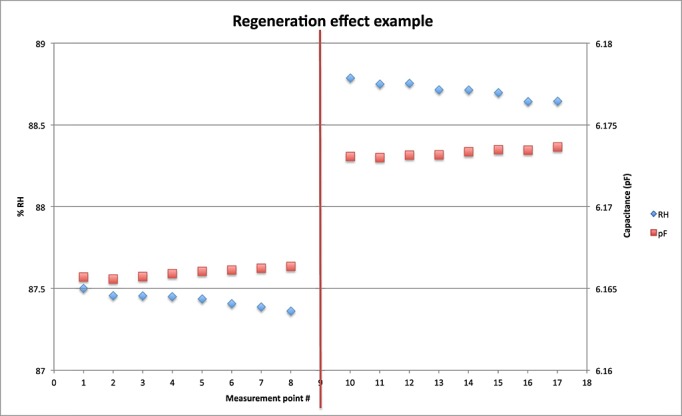
An example of immediate regeneration effect on REMS-H reference model Humicap®; channel capacitance and resulting humidity reading in laboratory (ambient temperature −50°C). Vertical red line marks the regeneration.
4. REMS-H Calibration
Three pieces of REMS-H devices were calibrated simultaneously: flight model, spare model, and reference model. All three models were manufactured at the same time from the same material and component lots, and their properties are very close to each other. The purpose of the reference model is to study aging of REMS-H and to make reference measurements on-ground when needed.
The REMS-H calibration is performed by first calibrating the Thermocap®; temperature sensor. Temperature calibration is done in at least eight stable temperature points in a climate chamber. To get the most accurate results, the stability criteria for the climate chamber temperature is ΔT/Δt≤ 1°C/h and ΔT≤ 0.1°C during the measurement. Pt100 sensors attached directly to the instrument are used as reference sensors in the temperature calibration. These Pt100 sensors are in turn calibrated in a temperature calibration bath, the reference sensor of which is calibrated at Finnish Metrology and Accreditation Center and is traceable to national standards. As the result of the temperature calibration, ±0.1°C accuracy compared to the Pt100 reference sensor is achieved for the Thermocap®;. At the same time with Thermocap®;, also the heating resistor used for regeneration is calibrated against reference Pt100. ±0.1°C accuracy is achieved also here.
After temperature calibration, the Humicap®; sensor head readings are measured in room temperature in six points ranging from almost dry to almost wet (100%) to get the basic shape of the calibration function. This is called basic calibration. After this two-point calibration is made in dry (approximately 0% RH) and wet (approximately 100% RH) conditions in six to eight temperature points, at least five of which are below 0°C. The lowest temperature point for humidity calibration is −70°C. Dry conditions are achieved in a vacuum chamber and wet conditions in a closed vessel with substantial humidity, which is then cooled down until dew/frost point is achieved.
The dry point equations are
| (1) |
where Cd,i is dry point capacitance of the Humicap®;, i is the index of the Humicap®;, T is sensor temperature given by Thermocap®; in ° Celsius, and a, b, and c are calibration coefficients.
The wet point equations are
| (2) |
where Cw,i is wet point capacitance of the Humicap®;, i is the index of the Humicap®;, T is sensor temperature given by Thermocap®; in °Celsius, and d and e are calibration coefficients.
Humicap®; behavior is nearly linear in terms of both temperature and humidity. Using the equations for dry and wet points, each measured point of Humicap®; capacitance can be scaled between dry point and wet point capacitance corresponding to the measured Thermocap®; temperature. This scaled capacitance is used as input for the basic calibration function mentioned above, resulting in relative humidity.
The calibration of the sensor is verified by measuring arbitrary humidity points in arbitrary temperatures. In temperatures above −40°C the results are compared against Vaisala humidity and temperature transmitter HMT334/337. These devices are calibrated at Vaisala in accredited calibration laboratory and their calibration is traceable to national standards. In temperatures below −40°C (down to −70°C) the reference humidity is calculated based on readings from Vaisala's DM500 precision surface-acoustic-wave (SAW) hygrometer capable of measuring dew point temperatures with 0.2°C accuracy down to −75°C and accurate temperature measurements with Pt100 reference sensors. The reference model of REMS-H has also been measured in the humidity generator of Finnish Center of Metrology and Accreditation. The results of these measurements are shown in Table 1.
Table 1.
Results of REMS-H Reference Model Measurements at Finnish Center of Metrology and Accreditation in a
| Ref. RH | ||||
|---|---|---|---|---|
| Ref. T | Ref. RH. | uncertainty | Mean RH | RMS Error |
| [°C] | (% RH) | (% RH) | (% RH) | (% RH) |
| 9.96 | 7.2 | 0.2 | 8.8 | 1.2 |
| 10.06 | 28.4 | 0.6 | 29.8 | 1.1 |
| 10.07 | 61.5 | 1.1 | 55.7 | 4.1 |
| 10 | 90.6 | 1.6 | 85.0 | 3.3 |
| −70.26 | 18.4 | 2 | 12.3 | 4.1 |
| −70.3 | 49 | 3.5 | 45.7 | 3.2 |
| −70.51 | 94.6 | 5 | 92.7 | 3.7 |
| −59.13 | 19.6 | 1.5 | 19.1 | 1.1 |
| −59.13 | 58.6 | 3 | 55.5 | 3.0 |
| −60.14 | 92.5 | 3.5 | 90.5 | 2.8 |
| −49.95 | 10.4 | 1 | 11.3 | 1.2 |
| −49.98 | 30.8 | 1.5 | 31.7 | 1.4 |
| −49.98 | 60.1 | 2.5 | 58.1 | 2.1 |
| −49.97 | 92.4 | 3.5 | 88.1 | 3.8 |
| −39.92 | 9.7 | 0.6 | 11.2 | 1.3 |
| −39.9 | 29.8 | 1.5 | 32.0 | 2.0 |
| −39.91 | 60.4 | 2.5 | 60.5 | 1.8 |
| −39.89 | 90 | 3 | 85.4 | 3.8 |
| −24.77 | 9.5 | 0.6 | 13.0 | 2.7 |
| −24.85 | 30.2 | 1 | 34.4 | 3.2 |
| −24.88 | 60.6 | 2 | 62.1 | 1.8 |
| −24.88 | 90.3 | 3 | 87.4 | 2.9 |
| −9.82 | 10.2 | 0.5 | 14.3 | 3.1 |
| −9.79 | 30 | 0.9 | 35.3 | 3.9 |
| −9.77 | 60.6 | 1.7 | 63.1 | 2.2 |
| −9.88 | 91.9 | 2.5 | 92.6 | 2.0 |
The reference temperature, humidity, and uncertainty are provided by the Center and are traceable to national standards. Mean RH is the mean of three Humicap®; readings.
The REMS-H device measures the relative humidity directly on the sensor surface. During the first couple of minutes of operation the sensor heats up about 1.5°C that would lead to a considerable difference with the actual ambient humidity. Hence, the first 5 to 10 humidity readings measured just after power up while the temperature of the sensor is roughly the same as of the ambient are the most accurate. As stated in section 3, the Humicap®; sensor heads react to humidity changes even when the instrument is not powered.
Due to a dust filter slowing the gas flow between the atmosphere and the sensor, the raw humidity reading might not be accurate, depending on the circumstances. If the relative humidity is changing sufficiently fast in either direction, the sensor will be lagging behind. To compensate for this, we have developed a method for retrieving the true humidity in the atmosphere based on the relative humidity reading and the speed of change of the relative humidity reading. The basis of this method is the fact that the speed of change through the filter depends on the atmospheric temperature and the difference of RH between the inside and the outside. Therefore, the difference in RH can be calculated by knowing the ambient temperature and the speed of the change in raw RH values.
The basic form of the equation is
| (3) |
where uraw is the RH reading before the filter correction, t is time, uΔ is the difference between the true RH and uraw (i.e., the “lag” amount), m is a constant, and
| (4) |
where a and b are constants and T is the temperature in kelvins. This form has been determined to fit the time lag measurements quite well with the following values for constants: m = 17,a = 29.24,b = 0.0996.
Due to limited measurement resolution, the true  is not known. We calculate the estimated derivative, k, with
| (5) |
where the Δuraw and Δt are calculated from the mean values of the measurements 2–4 of two successive measurement sessions. If we refer to the current session, i.e., the session the data point in question belongs to, as i, the sessions for calculating k are either be iand i − 1 or i + 1 and i, as explained below in more detail. Here k is defined to be always constant for any given session. The true derivative is obviously not always constant especially for longer sessions, but the warm up of the electronics and the decreasing RH caused by that makes it currently impossible to estimate the local derivative for each point independently. However, this is subject to active research, and future publications may include data produced with more accurate estimates for k.
From equations (3) and (5), we can derive an equation for uΔ:
| (6) |
where the top signs of ±and ∓ are used for k≥0 and the bottom signs are used for k < 0.
The true RH, then, will be
| (7) |
In determining the proper k, we calculate uΔ using k from both the sessions i + 1and i, and i and i − 1. The uΔ with the smaller absolute value is selected as the actual uΔ. There is an exception: if there is a sunrise between the two session starting times, we never use those sessions for determining k. Session starting times are defined as the times of the second measurement point of the sessions for the purposes of sunrise timings. If there is a sunrise at precisely the same time as the measurement time of the second measurement point of session i (the precision of both times is 1 s), the sunrise is defined to occur between i + 1 and i. This heuristic method of determining k is a result of extensive empirical testing, and it seems to avoid most of the artifacts that the more straightforward methods (such as using always i and i − 1) can produce.
Figure 3 illustrates the performance of this procedure. The figure shows data from a calibration test performed at Finnish Metrology and Accreditation Center. In this test the temperature was changing while the dew point was kept constant at −70.5° C and the pressure at 1038 hPa, corresponding to volume mixing ratio (VMR) of 2.3 ppm. The temperature cycle was chosen to mimic the conditions at Gale crater during the mission. We show the raw RH (uraw), the reference RH, and the corrected RH (u), as well as the sensor temperature (T). Although the raw RH seems to underestimate the reference RH by up to 10 percentage points, the correction brings that error down to a few percentage points.
Figure 3.
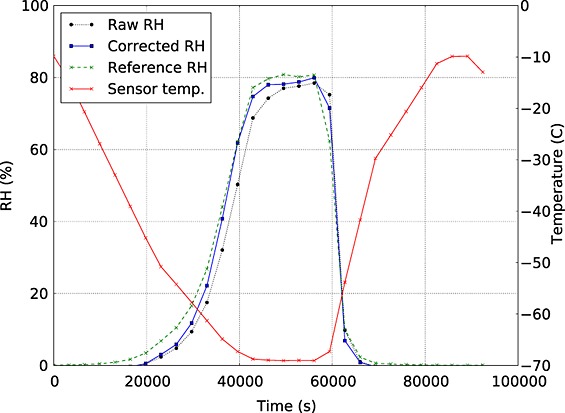
This figure illustrates the strength of the correction algorithm for the dust filter lag. It can be seen that the correction removes the lag almost altogether.
5. REMS-H Operations and Performance
REMS-H is accommodated on REMS Boom 2 that is attached to MSL mast (Figure 4).
Figure 4.
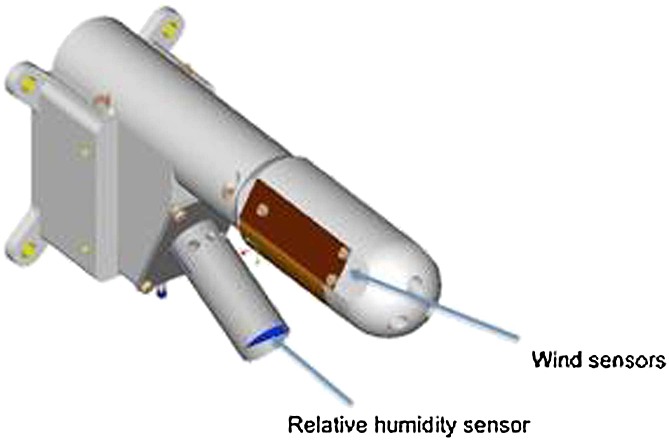
The REMS-H relative humidity instrument as mounted on the REMS boom a couple of centimeters below the Wind sensor accommodated roughly 1.5 m above the surface.
The first REMS-H measurements in flight configuration were obtained at prelaunch tests at Jet Propulsion Laboratory. The measurements were taken in dry conditions (nitrogen purge) over the whole temperature range expected on Mars.
One of the reference channels of REMS-H transducer electronics started to behave differently after REMS Boom 2 was integrated to MSL lander. The temperature dependence of this channel changed such that in room temperature its behavior was still nominal, but in colder temperatures a change in its frequency was discovered (Figure 5). This resulted in distorted (too high) humidity readings if the channel in question was used for deducing Humicap®; sensor head capacitances. The too-high values were in line with constant housekeeping channel capacitance readings that were also too high. After this discovery, the misbehaving channel was disregarded and a spare housekeeping channel used for capacitance calculation. All calibration data were reprocessed using the new channel for capacitance calculation, and new temperature and humidity calibration coefficients were calculated. The resulting humidity readings were in line with dry conditions at the prelaunch test, and also, measurements taken after launch during cruise checkouts were consistent with prelaunch tests.
Figure 5.
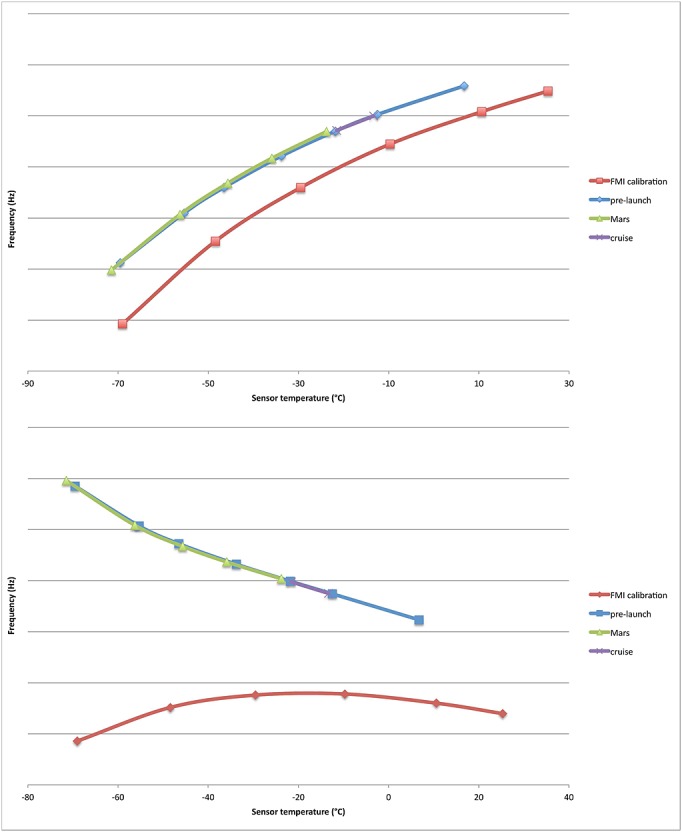
An example of nominal evolution of (top) a “well-behaving” reference channel and (bottom) the channel with changed temperature dependence. The scale on Y axis is omitted on purpose to protect proprietary information. The change in curve shape occurred at the time of integration of REMS Boom 2 to the lander, between FMI calibration measurements and prelaunch measurements. After that there are no significant changes in the reference channels.
The first checkout measurements after landing were taken on Sol 1 afternoon in relatively high ambient temperature of approximately −10°C. As expected, the humidity readings of Sol 1 afternoon showed dry conditions (Figure 6).
Figure 6.
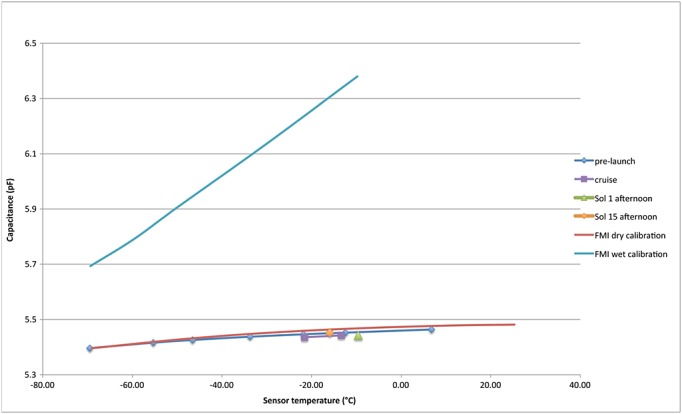
Capacitances of one Humicap®; channel at dry calibration, prelaunch tests, cruise, Sol 1 afternoon (before regeneration), and Sol 15 afternoon (after regeneration). The difference of level between Sol 1 afternoon and Sol 15 afternoon is explained with regeneration effect. Also wet calibration capacitances are given in the plot for reference. All capacitances are obtained using the spare housekeeping reference channel.
The REMS instrument began its regular scientific operations on Sol 9 after landing. The first nighttime measurements in cold temperatures revealed another problem in the humidity device. In cold temperatures the capacitances of humidity sensor heads seemed to be lower than during dry calibration, the difference being larger in colder temperatures. This behavior was different from prelaunch tests. The behavior of humidity channel capacitances could not be compared with a constant housekeeping channel, because after discarding data of the misbehaving channel discovered during prelaunch tests, there were no more spare constant channels available. However, all three sensor heads behave in similar fashion compared to each other, as they have done during the whole calibration and testing campaign. The sensor heads also reacted properly to regeneration, showing 1–2% RH higher readings just after regeneration. This makes us conclude that the sensor heads themselves are intact and the too low capacitances are the results of an unknown transducer electronics artifact.
An example of humidity sensor head capacitance as function of temperature measured on Sol 26 is presented in (Figure 7). The Figure shows that the capacitance curve is very smooth down to approximately −50°C, and it also follows the shape of the dry calibration curve. After approximately −50°C, there is more divergence in the data points, and the curve starts to sweep upward at approximately −65°C, which indicates that relative humidity is rising.
Figure 7.
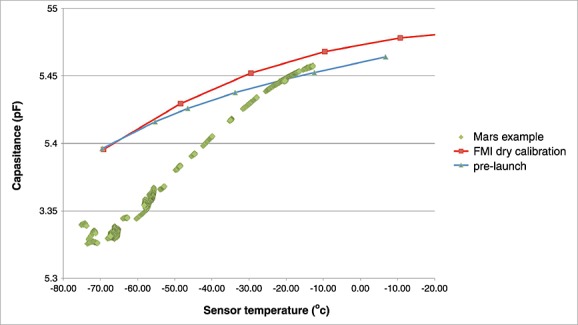
Capacitance of one Humicap®; sensor as function of humidity sensor temperature during one sol. Dry calibration and prelaunch test capacitances are given for reference. The difference between dry calibration curve and prelaunch test results is explained with lack of regeneration.
The following compensation of the transducer artifact producing too low capacitances of humidity channels has been developed. First, it is assumed that at least down to −30°C relative humidity in Gale crater is very close to 0%, which provides us a natural “system calibration.” This assumption is justified, e.g., when noting that even 0.5% RH (1.0% RH) at −30°C would cause a supersaturation of 155% RH (310% RH) at the typical MSL early morning temperature of −75°C. Such situation has not been detected by MSL instrumentation. Hence, the humidity level at −30°C and higher temperatures is less than 1% RH. The measured capacitance curve is then adjusted so that it follows the dry calibration curve down to −30°C. This provides compensated capacitance readings for humidity channels. The calibration coefficients are then applied to these capacitances resulting in relative humidity readings. The results are the same within approximately 1% RH even if the assumption of zero relative humidity is extended to −40°C.
The transducer artifact compensation procedure is illustrated in the Figure 8. The capacitances measured in a zero humidity environment are shown in blue. The raw capacitances of Humicap 2 measured in Gale crater shortly after landing are shown in green. A second-order polynomial curve is fitted to both the dry calibration measurements and the Gale capacitances for down to −30°C. These curves are shown in black (dotted line) and magenta (dashed line), respectively. The difference of these two curves is the compensation curve, which is added to the raw capacitances to compensate for the decline in the baseline. The resulting reconstructed capacitances is shown in red in Figure 8.
Figure 8.
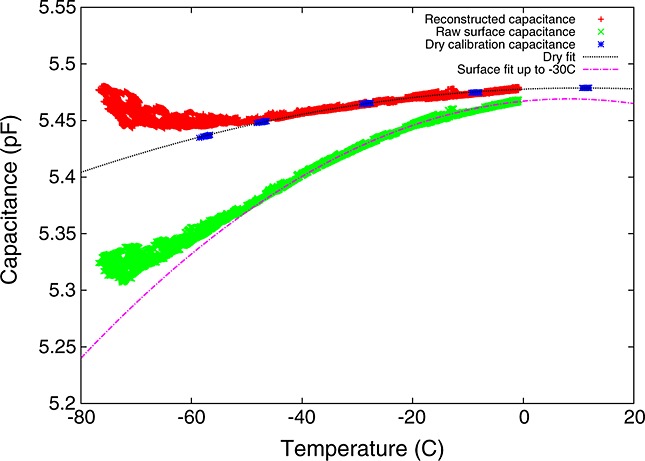
An example of the parabolic capacitance correction.
6. REMS-H Observations and First Results
The REMS-H observations were performed once per hour by reading the three humidity sensor heads and the temperature sensor constantly for a period of 5 min. The temperature sensor is attached to the same small platform as the humidity sensor heads and thus gives the actual temperature of the humidity sensors. This temperature reading is used for temperature compensation of the humidity sensor heads as well as to estimate the ambient temperature. About once per sol REMS is given more observation time allowing it to make continuous observation for a period of 1–2 h. The results of this paper are using the once per hour observations.
A first glimpse of the REMS-H results can be seen in Figure 9, which depicts the REMS-H relative humidity readings for the MSL Sols 15–17 and Sols 80–82. A clear difference in relative humidity is visible between these two sets of sols showing the maximum relative humidity of Sols 15–17 being up to about 40% and for the Sols 80–82 about 15% of relative humidity. This kind of trend of higher relative humidity prevailing during the beginning of the MSL mission and gradually diminishing toward the end of the first 100 MSL sols is apparent in the REMS-H data. This is presented by Figure 10 depicting all the individual REMS-H relative humidity observations for the first 100 MSL sols accompanied by the temperature of the sensor heads. This downward trend of relative humidity in the course of the first 100 sols of the MSL mission is partially due to the higher nighttime temperatures, but they are also due to the actual decrease of absolute atmospheric humidity. This is shown by Figure 12 presenting the total precipitable water content and mixing ratio representing the absolute atmospheric humidity.
Figure 9.
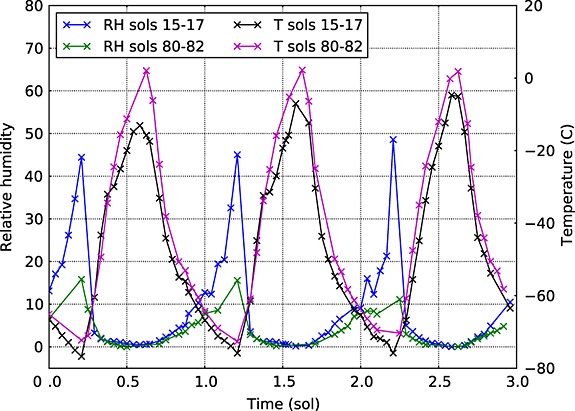
Relative humidity observations during Sols 10–12 and 80–82. There is a clear temperature-driven difference in relative humidity between the two groups of sols, even if also the absolute humidity is lower at the end of the 100 sol period compared to humidity in the beginning of the period.
Figure 10.
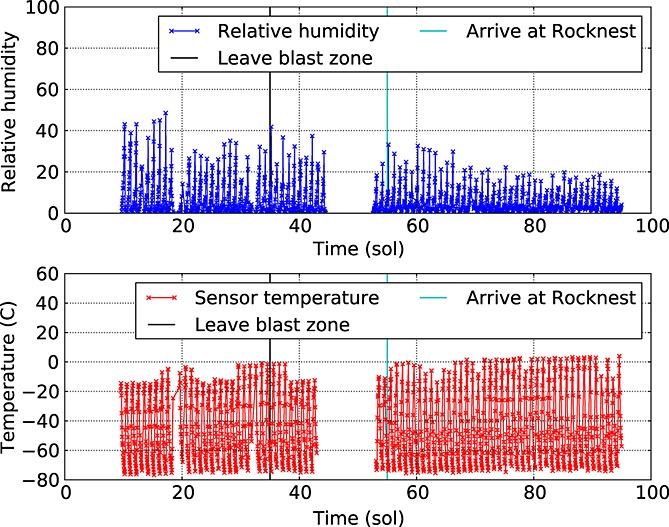
REMS-H relative humidity observations for the first 100 sols of the MSL operations accompanied by temperature observations close to the humidity sensor heads.
Figure 12.
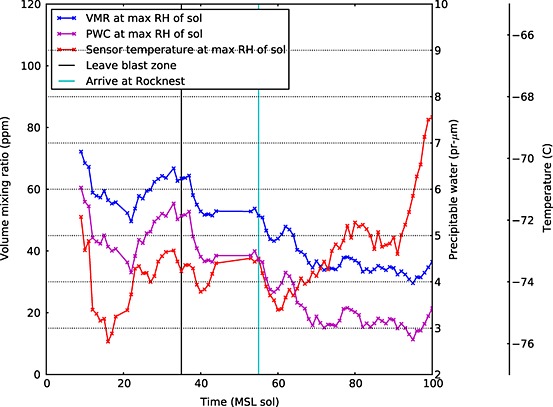
Volume mixing ratio (VMR) and precipitable water content (PWC) obtained from the REMS-H observations by calculating the values from the observations at the early morning time. The temperature of the time of the calculation is shown by the ordinate axis on the right-hand side of the figure.
The maximum relative humidity readings were recorded in the early morning time frame, when the atmospheric temperatures were at their lowest level. The highest individual humidity reading took place on the Sol 17 with the value of slightly under RH 50%.
To illustrate the connection between the relative humidity and the water volume mixing ratio (VMR), we plotted simulated RH diurnal cycles corresponding to VMR values together with the actual REMS-H observations. One such plot is shown in Figure 11 depicting simulated RH values for the Sols 15–18 using volume mixing ratios of 20, 50, and 80 parts per million. Here we have kept the volume mixing ratio constant throughout the simulation. The result of the simulation indicates that the actual measured VMR seems to follow roughly the simulated relative humidities with absolute humidity kept constant. However, it is likely that the VMR is not actually constant throughout the sol, as is suggested below by our modeling efforts.
Figure 11.
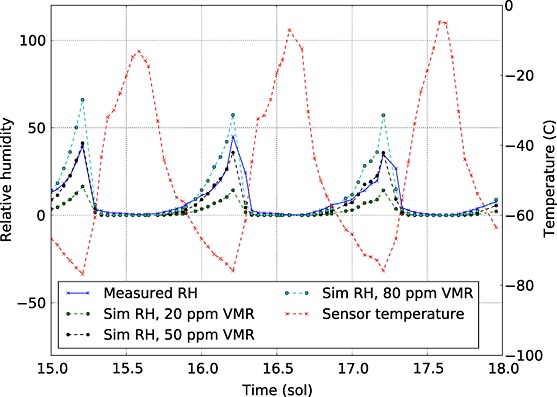
Relative humidity (RH) and atmospheric temperature observed by REMS-H together with simulated RH-values using volume mixing ratios of 60, 100, and 140 parts per million.
The actual VMR values during the first 100 MSL sols range between 75 and 30 parts per million, as indicated in Figure 12. There seems to be a gradual decrease in the mixing ratio starting around MSL Sols 30–50 corresponding to solar longitude Ls of 170–180. A similar kind of decrease in absolute humidity can be seen in the behavior of precipitable water content (PWC) in micrometers depicted in the same figure. Both the VMR and PWC values have been calculated on the REMS-H readings during early morning. The figure also shows the temperature of the actual reading out of which the VMR and PWC values have been calculated.
The PWC values in Figure 12 were calculated by assuming uniform mixing of the atmosphere suggesting that the total precipitable atmospheric water content at the Gale crater area is about 6 pr μm in the beginning of the MSL mission, whereas around the MSL Sols 80 to 100 the water content is 3 pr μm. It should be noted that the assumption uniform mixing of the atmospheric water may not be correct, and hence, the issue of total precipitable water content has to be analyzed further with various atmospheric mixing schemes. However, the volume mixing ratios represent local conditions and are therefore independent on the atmospheric mixing schemes. Overall, it can be concluded that relatively dry conditions being characteristic of areas close to the equator [e.g., Read and Lewis, 2004] are prevailing in the atmospheric surface layer of Gale crater.
The REMS-H observations can be constrained by comparing them with indirect observations made by, e.g., the Thermal Emission Spectrometer (TES) on board the Mars Global Surveyor spacecraft [Christensen et al., 2001] and with the Mini-TES observations on board the Spirit and Opportunity rovers [Peralta et al., 2002] as shown in Figure 13. A prominent decrease of atmospheric humidity in terms of PWC can be seen in the mini-TES readings of the Spirit rover. This decrease of about a factor of 2 takes place at around Ls190–210°. Similar kind of decrease at roughly similar solar longitude occurs also in the REMS-H data as shown in Figure 12. Indication of similar decrease in the atmospheric humidity level is also suggested by the TES data by Mars Global Surveyor. This kind of variation in the atmospheric humidity may be due to local environmental effects involving surface-to-atmosphere water exchange processes or due to some seasonal phenomenon associated with the water being evaporated from the northern polar cap in the course of advancing northern summer [Read and Lewis, 2004]. However, primary causes for the atmospheric humidity variation recorded by REMS-H are not clear yet, and even preliminary conclusions require additional analyses.
Figure 13.
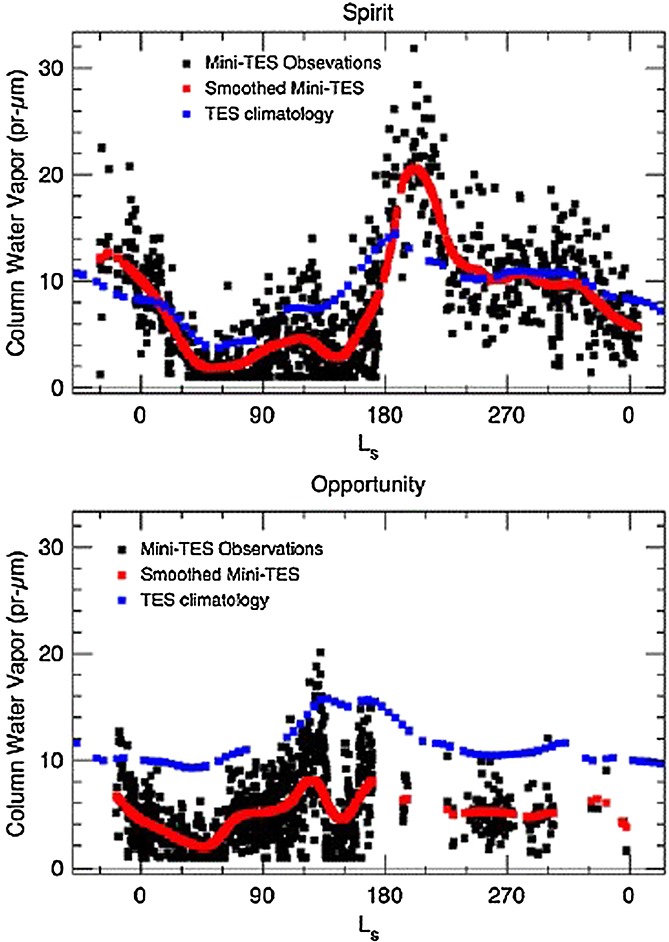
Atmospheric water content (in precipitable water as of micrometers) inferred from the in situ Mini-TES observations on board the Spirit (15°S) and Opportunity (2°S) rovers at the Martian surface. The black points are individual Mini-TES retrievals; the red line is a smoothed curve. The blue points are from the TES climatology for the rover sites [Smith et al., 2006].
The currently known water vapor cycle features on Mars are mainly based on column water vapor observations from orbiters (e.g., MAWD and TES) and from GCM simulations. They reveal a pattern where the north pole wintertime ice cap strongly sublimes every spring and summer, the released water vapor being transported southward by winds, reaching the equatorial latitudes during the northern summertime. This pulse can be seen in the TES climatology suggesting precipitable water content values of 10–15 pr μm [Smith, 2004]. The atmospheric water content is likely characterized by prominent local effects, as the mini-TES mean retrievals on the Opportunity site (1.9°S) are of the order of 4–8 pr μm for the solar longitude range Ls 150–200° being only about half of the TES values, while the Spirit (15°S) mini-TES retrievals remained close to the TES observations [Smith et al., 2006].
The local diurnal moisture cycle at the MSL site was simulated with the column model developed at the University of Helsinki and Finnish Meteorological Institute (FMI). The model, its moisture parameterizations, and simulations for Phoenix are described in Savijärvi and Määttänen [2010]. The model has been successfully used for characterization of local atmospheric behavior from in situ measurements by landers on Mars such as Viking, Pathfinder, and Phoenix [Savijärvi, 1999; Savijärvi and Kauhanen, 2008; Savijärvi and Määttänen, 2010]. The model includes predictive equations for the wind components, temperature, specific humidity, and ice mixing ratio [Savijärvi, 1999]. A long- and short-wave radiation scheme is used which can take into account the effect of carbon dioxide, water, and dust in the atmosphere. A turbulence scheme is included based on Monin-Obukhov and mixing-length approaches for the lower layers and higher layers, respectively. The thermal diffusion within the subsurface utilizes a five-layer Crank-Nicholson method and the energy balance at the surface to predict the surface temperature. Surface sublimation is modeled using a constant soil moisture fraction. The model is provided with a simple but proven bare-soil hydrology based on sublimation producing, e.g., ice clouds, fog, and frost on the ground, as observed by the Phoenix mission and predicted by the column model.
The pertinent properties of the atmosphere that we are most interested to explore by the column model are the precipitable water content (PWC) and the water vapor pressure. The simulations were performed for the location and time of the MSL rover soon after its landing in Gale crater with the latitude set to 4.6°S and the solar longitude to Ls=156°, which is roughly the seasonal time of MSL landing. The model was initialized with the water uniformly mixed in the atmosphere.
Figure 14 shows the simulated relative humidity at 1 m height on Ls of 160°, which corresponds approximately to the MSL Sol 10. We used four initial column water abundancies of 2, 5, 10, and 15 prμm that are roughly conserved from sol to sol in the simulations. The RH is small during daytime but increases in the morning hours, reaching saturation only in the most humid case. The 1 m water vapor pressure stays nearly constant (0.03 and 0.07 Pa) in the two drier simulations, while it is around 0.13 and 0.19 Pa during daytime in the moist cases, dropping to about 0.10 Pa in the early morning hours due to frost formation in these cases. We had similar kind of results by the simulations performed by various atmospheric models to predict the environmental conditions at Gale crater prior to the MSL landing (R. M. Haberle et al., Meteorological Predictions for the REMS Experiment on MSL, submitted to Mars Journal, 2012).
Figure 14.
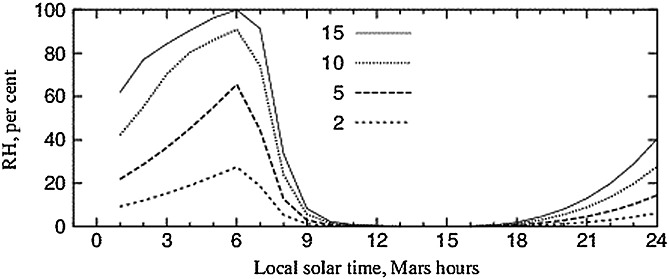
Simulated relative humidity values at 1 m altitude for the MSL landing site using an atmospheric column model [Savijärvi et al., 2004]. The simulation assumed water being initially uniformly mixed in the atmosphere with absolute precipitable water contents of 2, 5, 10, and 15 pr μm.
The data for the vapor pressure shown in Figure 15 was obtained from the same model runs as the data shown in Figure 14 indicating the volume mixing ratio of being about 100 ppm. The REMS-H observations gave the water volume mixing ratio values about 75 to 60 ppm for the MSL Sols 10–15. The model does not predict the formation of fog. The simulated relative and absolute humidities appear to agree with the MSL observations for column water abundancies of about 5 pr μm.
Figure 15.
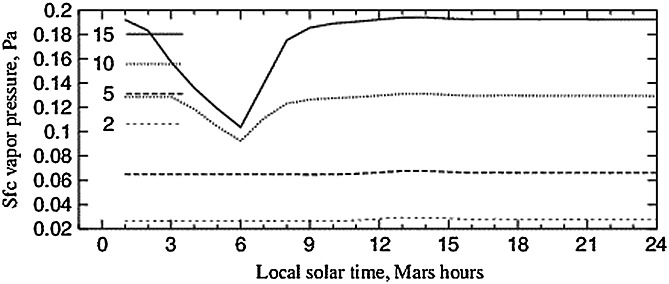
Simulated partial water pressure at the MSL landing site using the atmospheric column model. The simulation assumed water being initially uniformly mixed in the atmosphere with absolute precipitable water contents of 2, 5, 10, and 15 pr μm.
Overall, the REMS-H observations suggest that the humidity of the atmospheric surface layer at the Gale crater is drier than at the Viking Lander of Phoenix lander landing sites, as also stated by Read and Lewis [2004]. The volume mixing ratio of water at Gale crater is varying between 30 and 75 ppm that is of the same order of magnitude as inferred by earlier indirect observations [Smith, 2004; Smith et al., 2006] and is also supported by our modeling results.
7. Concluding Remarks and Discussion
The REMS-H device on board the Mars Science Laboratory has produced in situ relative humidity observations once per hour since the beginning of the MSL mission.
The initial results of the first 100 sols of the MSL operations show diurnally varying relative humidity with highest levels recorded during the sols just after landing. The maximum relative humidity readings were measured always in the early morning time frame, when the atmospheric temperatures were on their lowest level. The maximum relative humidity reading took place on the MSL sol 17 with the value of RH 50% at the temperature of about −77°C. During that sol, the conditions at the ground level may have been close to saturation during the early morning before sunrise, because only a few degrees of Kelvin in terms of temperature difference between the ground and the REMS-H level are needed to reach saturation at the ground. Due to the fact that the amount of absolute humidity in the atmosphere at the REMS-H altitude is low with the water mixing ratio being less than 100 ppm, the possible frost formation may be highly difficult to detect.
During the initial MSL sols there was a local maximum of the water mixing ratio of about 75 ppm followed by another local maximum of about the same value at the MSL Sols 30 to 40 corresponding to corresponding to solar longitude of Ls of 170–180. Thereafter, the atmospheric humidity exhibits a decreasing trend continuing up to the MSL Sols 90–100 resulting in humidity diminishing by a factor of 2. When assuming uniform water mixing in the atmosphere, these water mixing ratios correspond to total atmospheric water content ranging from 3 pr μm up to 5–6 pr μm.
The recorded levels of water mixing ratio of about 75 ppm at the first MSL sols are higher than the mixing ratios during the rest of the 100 MSL sols. This may be due to the fact that the landing process involving the skycrane thrusters perhaps has affected the surface regolith and may have lifted additional water pulse into the atmospheric surface layer. On the other hand, the observed relatively high water mixing ratio could also represent a natural variation of the atmospheric water content.
The REMS-H results show a gradual decreasing trend in the atmospheric water mixing ratio during the first 100 MSL sols resulting in a decrease by a factor of about 2. A similar kind of decrease was seen by the TES instrument of the Mars Global Surveyor and the Mini-TES instruments on board the Spirit and Opportunity rovers. As to the first 100 MSL sols, the REMS-H observations are of the same order of magnitude than the indirect observations made by the TES and Mini-TES instruments. Our simulations of the atmospheric conditions at the Gale crater for the time of the first MSL sols give out results slightly higher than the REMS-H observations.
Overall, the REMS-H observations are giving out an interesting picture of the atmospheric water conditions at the Gale crater. Distinct local variation is prevailing, and we may have detected an apparent seasonal trend that has been observed by earlier indirect observations. Investigations of the local effects require having data on areas with different local geographic and surface characteristics. Seasonal behavior of the atmospheric humidity is becoming apparent with the advancing Martian season. More light will be shed on these issues, when more MSL mission data will come available.
Acknowledgments
The authors would like to express their gratitude to the MSL and REMS instrument teams in making this wonderful Mars mission come true. Ari-Matti Harri and Hannu Savijarvi are thankful for the Finnish Academy grants 132825 and 131723.
References
- Barnes JR, Pollack JB, Haberle RM, Leovy CB, Zurek RW, Lee H, Schaeffer J. Mars atmospheric dynamics as simulated by the NASA Ames general circulation model, 2, transient baroclinic eddies. J. Geophys. Res. 1993;98:3125–3148. [Google Scholar]
- Biemann K, Oro J, Toulmin P, III, Orgel LE, Nier AO, Anderson DM, Flory D, Diaz AV, Rushneck DR, Simmonds PG. The search for organic substances and inorganic volatile compounds in the surface of Mars. J. Geophys. Res. 1977;82:4641–4658,. doi: 10.1029/JS082i028p04641. [Google Scholar]
- Böttger HM, Lewis SR, Read PL, Forget F. The effects of the Martian regolith on GCM water cycle simulations. Icarus. 2005;177:174–189. doi: 10.1016/j.icarus.2005.02.024. [Google Scholar]
- Boynton WV, et al. Distribution of hydrogen in the near surface of Mars: Evidence for subsurface ice deposits. Science. 2002;297:81–85. doi: 10.1126/science.1073722. doi: 10.1126/science.1073722. [DOI] [PubMed] [Google Scholar]
- Christensen PR, et al. Mars global surveyor thermal emission spectrometer experiment: Investigation description and surface science results. J. Geophys. Res. 2001;106:23,823–23,872. [Google Scholar]
- Farmer CB, Davies DW, Holland AL, Laporte DD, Doms PE. Mars—Water vapor observations from the Viking orbiters. J. Geophys. Res. 1977;82:4225–4248. doi: 10.1029/JS082i028p04225. [Google Scholar]
- Forget F, Hourdin F, Fournier R, Hourdin C, Talagrand O, Collins M, Lewis SR, Read PL, Huot J-P. Improved general circulation models of the Martian atmosphere from the surface to above 80 km. J. Geophys. Res. 1999;104:24,155–24,176. doi: 10.1029/1999JE001025. [Google Scholar]
- Gómez-Elvira J, et al. REMS: The environmental sensor suite for the Mars Science Laboratory rover. Space Sci. Rev. 2012;170:583–640. doi: 10.1007/s11214-012-9921-1. [Google Scholar]
- Haberle RM, Pollack J, Barnes JR, Zurek RW, Leovy CB, Murphy JR, Lee H, Schaeffer J. Mars atmospheric dynamics as simulated by the NASA Ames general circulation model. 1. The zonal-mean circulation. J. Geophys. Res. 1993;98:3093–3124. [Google Scholar]
- Haberle RM, McKay CP, Schaeffer J, Cabrol NA, Grin EA, Zent AP, Quinn R. On the possibility of liquid water on present-day Mars. J. Geophys. Res. 2001;106(E10):23,317–23,326. [Google Scholar]
- Jakosky BM. The role of seasonal reservoirs in the Mars water cycle II. Coupled models of the regolith, the polar caps, and atmospheric transport. Icarus. 1983;55:19–39. doi: 10.1016/0019-1035(83)90047-7. [Google Scholar]
- Jakosky BM. The seasonal behavior of water on Mars. In: Kieffer HH, Haberle RM, et al., editors. Mars. Tucson, Ariz: Univ. of Ariz. Press; 1992. pp. 969–1016. [Google Scholar]
- James PB, Kieffer HH. The seasonal cycle of carbon dioxide on Mars. In: Kieffer HH, Paige DA, et al., editors. Mars. Tucson, Ariz: Univ. of Ariz. Press; 1992. pp. 934–968. [Google Scholar]
- Kieffer HH, Chase SC, Martin TZ, Miner ED, Palluconi FD. Martian north pole summer temperatures: Dirty water ice. Science. 1976;194:1341–1344. doi: 10.1126/science.194.4271.1341. [DOI] [PubMed] [Google Scholar]
- Kieffer HH, Jakosky BM. The planet Mars: From antiquity to present. In: Kieffer HH, Snyder CW, et al., editors. Mars. Tucson, Ariz: Univ. of Ariz. Press; 1992. pp. 1–33. [Google Scholar]
- Korablev OI, Bertaux J-L, Dubois J-P. Occultation of stars in the UV: Study of the atmosphere of Mars. J. Geophys. Res. 2001;106:7597–7610. doi: 10.1029/2000JE001298. [Google Scholar]
- Kuzmin RO, Zabalueva EV, Evdokimova NA, Christensen PR. Mapping of the water ice content within the Martian surficial soil on the periphery of the retreating seasonal northern polar cap based on the TES and the OMEGA data. J. Geophys. Res. 2012;117 E00J19, doi: 10.1029/2012JE004071. [Google Scholar]
- Leovy CB, Mintz Y. Numerical simulation of the atmospheric circulation and climate of Mars. J. Geophys. Res. 1969;26:1167–1190. [Google Scholar]
- Martin LJ, James PB, Dollfus A, Iwasaki K. Telescopic observations: Visual, photographic, polarimetric. In: Kieffer HH, Beish JD, et al., editors. Mars. Tucson, Ariz: Univ. of Ariz. Press; 1992. pp. 34–70. [Google Scholar]
- Masursky H, et al. Mariner 9 Mars television experiment. Bull. Am. Astron. Soc. 1972;4:356. [Google Scholar]
- Milton DJ. Water and processes of degradation in the Martian landscape. J. Geophys. Res. 1973;78:4037–4047. doi: 10.1029/JB078i020p04037. [Google Scholar]
- Morris RV, et al. Mössbauer mineralogy of rock, soil, and dust at Gusev crater, Mars: Spirit's journey through weakly altered olivine basalt on the plains and pervasively altered basalt in the Columbia Hills. J. Geophys. Res. 2006;111 E02S13, doi: 10.1029/2005JE002584. [Google Scholar]
- Peralta RJ, Silverman SH, Bates DM, Christensen P, Mehall G, Tourville T, Keehn R. Miniature thermal emission spectrometer for the Mars Exploration Rover. In: Larar AM, Mlynczak MG, Cannon G, editors. Society of Photo-Optical Instrumentation Engineers (SPIE) Conference Series, Society of Photo-Optical Instrumentation Engineers (SPIE) Conference Series. Society of Photo-Optical Instrumentation Engineers (SPIE); 2002. pp. 39–50. vol. 4485. [Google Scholar]
- Pollack JB, Haberle RM, Schaeffer J, Lee H. Simulations of the general circulation of the Martian atmosphere. 1. Polar processes. J. Geophys. Res. 1990;95:1447–1473. [Google Scholar]
- Pollack JB, Haberle RM, Murphy JR, Schaeffer J, Lee H. Simulations of the general circulation of the Martian atmosphere. 2. Seasonal pressure variations. J. Geophys. Res. 1993;98:3149–3182. [Google Scholar]
- Presley MA, Christensen PR. Thermal conductivity measurements of particulate materials. 2. Results. J. Geophys. Res. 1997;102:6551–6566. doi: 10.1029/96JE03303. [Google Scholar]
- Read PL, Lewis SR. The Martian Climate Revisited—Atmosphere and Environment of a Desert Planet. Berlin: Springer-Verlag; 2004. p. 326. [Google Scholar]
- Rennó NO, et al. Possible physical and thermodynamical evidence for liquid water at the Phoenix landing site. J. Geophys. Res. 2009;114 E00E03, doi: 10.1029/2009JE003362. [Google Scholar]
- Richardson MI, Wilson RJ. Investigation of the nature and stability of the Martian seasonal water cycle with a general circulation model. J. Geophys. Res. 2002;107(E5):5031. doi: 10.1029/2001JE001536. [Google Scholar]
- Richardson MI, Toigo AD, Newman CE. PlanetWRF: A general purpose, local to global numerical model for planetary atmospheric and climate dynamics. J. Geophys. Res. 2007;112 E09001, doi: 10.1029/2006JE002825. [Google Scholar]
- Savijärvi H. A model study of the atmospheric boundary layer in the Mars Pathfinder lander conditions. Q. J. R. Meteorol. Soc. 1999;125:483–493. [Google Scholar]
- Savijärvi H, Kauhanen J. Surface and boundary-layer modelling for the Mars Exploration Rover sites. Q. J. R. Meteorol. Soc. 2008;134:635–641. [Google Scholar]
- Savijärvi H, Määttänen A. Boundary-layer simulations for the Mars Phoenix lander site. Q. J. R. Meteorol. Soc. 2010;136:1497–1505. [Google Scholar]
- Savijärvi H, Määttänen A, Kauhanen J, Harri A-M. Mars Pathfinder: New data and new model simulations. Q. J. R. Meteorol. Soc. 2004;130:669–683. doi: 10.1256/qj.03.59. [Google Scholar]
- Sizemore HG, Mellon MT, Searls ML, Lemmon MT, Zent AP, Heet TL, Arvidson RE, Blaney DL, Keller HU. In situ analysis of ice table depth variations in the vicinity of small rocks at the Phoenix landing site. J. Geophys. Res. 2010;115 E00E09, doi: 10.1029/2009JE003414. [Google Scholar]
- Smith DE, et al. The global topography of Mars and implications for surface evolution. Science. 1999;284:1495–1503. doi: 10.1126/science.284.5419.1495. [DOI] [PubMed] [Google Scholar]
- Smith MD. Interannual variability in TES atmospheric observations of Mars during 1999–2003. Icarus. 2004;167:148–165. [Google Scholar]
- Smith MD, Pearl JC, Conrath BJ, Christensen PR. One Martian year of atmospheric observations by the Thermal Emission Spectrometer. Geophys. Res. Lett. 2001;28:4263–4266. doi: 10.1029/2001GL013608. [Google Scholar]
- Smith MD, Wolff MJ, Spanovich N, Ghosh A, Banfield D, Christensen PR, Landis GA, Squyres SW. One Martian year of atmospheric observations using MER Mini-TES. J. Geophys. Res. 2006;111 E12S13, doi: 10.1029/2006JE002770. [Google Scholar]
- Spinrad H, Münch G, Kaplan LD. Letter to the Editor: The detection of water vapor on Mars. Astrophys. J. 1963;137:1319. doi: 10.1086/147613. [Google Scholar]
- Thomas P, Squyres S, Herkenhoff K, Howard A. Polar deposits of Mars. In: Kieffer HH, Murray B, et al., editors. Mars. Tucson, Ariz: Univ. of Ariz. Press; 1992. pp. 767–798. [Google Scholar]
- Trainer MG, Tolbert MA, McKay CP, Toon OB. Enhanced CO2 trapping in water ice via atmospheric deposition with relevance to Mars. Icarus. 2010;206:707–715. doi: 10.1016/j.icarus.2009.09.008. [Google Scholar]
- Vincendon M, Mustard J, Forget F, Kreslavsky M, Spiga A, Murchie S, Bibring J-P. Near-tropical subsurface ice on Mars. Geophys. Res. Lett. 2010;37 L01202, doi: 10.1029/2009GL041426. [Google Scholar]
- Wall SD. Analysis of condensates formed at the Viking 2 lander site—The first winter. Icarus. 1981;47:173–183. doi: 10.1016/0019-1035(81)90165-2. [Google Scholar]
- Whiteway JA, et al. Mars water-ice clouds and precipitation. Science. 2009;325(5936):68–70. doi: 10.1126/science.1172344. doi: 10.1126/science.1172344. [DOI] [PubMed] [Google Scholar]
- Wray JJ. Gale crater: The Mars Science Laboratory/Curiosity rover landing site. Int. J. Astrobiol. 2013;12:25–38. doi: 10.1017/S1473550412000328. [Google Scholar]
- Zurek RW. Comparative aspects of the climate of Mars: An introduction to the current atmosphere. In: Kieffer HH, et al., editors. Mars. Tucson, Ariz: Univ. of Ariz. Press; 1992. pp. 799–817. [Google Scholar]
- Zurek RW, Barnes JR, Haberle RM, Pollack JB, Tillman JE. Dynamics of the atmosphere of Mars. In: Kieffer HH, Leovy CB, et al., editors. Mars. Tucson, Ariz: Univ. of Ariz. Press; 1992. pp. 835–933. [Google Scholar]


