Abstract
[1] A coupled biophysical model is used to examine the impact of the great Arctic cyclone of early August 2012 on the marine planktonic ecosystem in the Pacific sector of the Arctic Ocean (PSA). Model results indicate that the cyclone influences the marine planktonic ecosystem by enhancing productivity on the shelves of the Chukchi, East Siberian, and Laptev seas during the storm. Although the cyclone's passage in the PSA lasted only a few days, the simulated biological effects on the shelves last 1 month or longer. At some locations on the shelves, primary productivity (PP) increases by up to 90% and phytoplankton biomass by up to 40% in the wake of the cyclone. The increase in zooplankton biomass is up to 18% on 31 August and remains 10% on 15 September, more than 1 month after the storm. In the central PSA, however, model simulations indicate a decrease in PP and plankton biomass. The biological gain on the shelves and loss in the central PSA are linked to two factors. (1) The cyclone enhances mixing in the upper ocean, which increases nutrient availability in the surface waters of the shelves; enhanced mixing in the central PSA does not increase productivity because nutrients there are mostly depleted through summer draw down by the time of the cyclone's passage. (2) The cyclone also induces divergence, resulting from the cyclone's low-pressure system that drives cyclonic sea ice and upper ocean circulation, which transports more plankton biomass onto the shelves from the central PSA. The simulated biological gain on the shelves is greater than the loss in the central PSA, and therefore, the production on average over the entire PSA is increased by the cyclone. Because the gain on the shelves is offset by the loss in the central PSA, the average increase over the entire PSA is moderate and lasts only about 10 days. The generally positive impact of cyclones on the marine ecosystem in the Arctic, particularly on the shelves, is likely to grow with increasing summer cyclone activity if the Arctic continues to warm and the ice cover continues to shrink.
Keywords: cyclone effects on biology, arctic ocean, ocean mixing
1. Introduction
[2] A key feature of the Arctic atmospheric circulation is a prominent summer maximum in cyclone activity, which is associated with the influx of lows generated over the Eurasian continent and cyclogenesis over the Arctic Ocean resulting from differential atmospheric heating between the Arctic Ocean and snow-free land [Serreze and Barrett, 2008]. Over the past several decades, there has been a general increase in the frequency and intensity of cyclones in the Arctic and a northward shift in storm tracks during summer and in other seasons [e.g., Serreze et al., 2000; Orlanski, 1998; McCabe et al., 2001; Zhang et al., 2004; Sepp and Jaagus, 2011]. From 1948 to 2002, the number and intensity of cyclones entering the Arctic from midlatitudes in summer has increased [Zhang et al., 2004], suggesting a northward shift in summer storm tracks. These changes in cyclone activity are associated with other ongoing physical changes [Hassol, 2004; IPCC, 2007], including increasing surface air temperature and upper ocean heat content [Rigor et al., 2000; Serreze et al., ,; Polyakov et al., 2007; Steele et al., 2008] and decreasing sea ice extent and thickness, leading to a significant reduction in Arctic sea ice volume [e.g., Meier et al., 2007; Comiso, 2012; Kwok and Rothrock, 2009; Kwok et al., 2009; Schweiger et al., 2011; Zhang et al., 2012]. The increase in summer cyclone activity is likely to change environmental conditions in the Arctic Ocean, and therefore, affect marine primary production [e.g., Hassol, 2004]. Thus, it is important to enhance our understanding of whether and to what extent summer Arctic cyclones affect the marine planktonic ecosystem.
[3] The strong 2012 summer cyclone provides an opportunity to examine the impact of cyclones on the ecosystem. Captured by NASA satellite images, the summer cyclone swept over much of the Pacific sector of the Arctic (PSA; Figure 1) in early August 2012 (http://earthobservatory.nasa.gov/IOTD/view.php?id=78808). Dubbed “The Great Arctic Cyclone of August 2012” by Simmonds and Rudeva [2012], the storm was unprecedented in extent, intensity, and depth. It formed on 2 August in Siberia, made its way into the PSA, and intensified substantially during 6–8 August before subsiding, as shown in the NCEP/NCAR reanalysis [Kalnay et al., 1996] of surface wind speed and sea level pressure (SLP; Figure 2). The minimum central pressure of the cyclone was well below 1000 hPa and surface winds exceeded 14 m s−1 in some locations (Figure 2) [Simmonds and Rudeva, 2012], which is within the 99th percentile for August winds in the PSA [Zhang et al., 2013]. In addition, the wind circulation in the low-pressure system was strongly cyclonic [Parkinson and Comiso, 2013].
Figure 1.
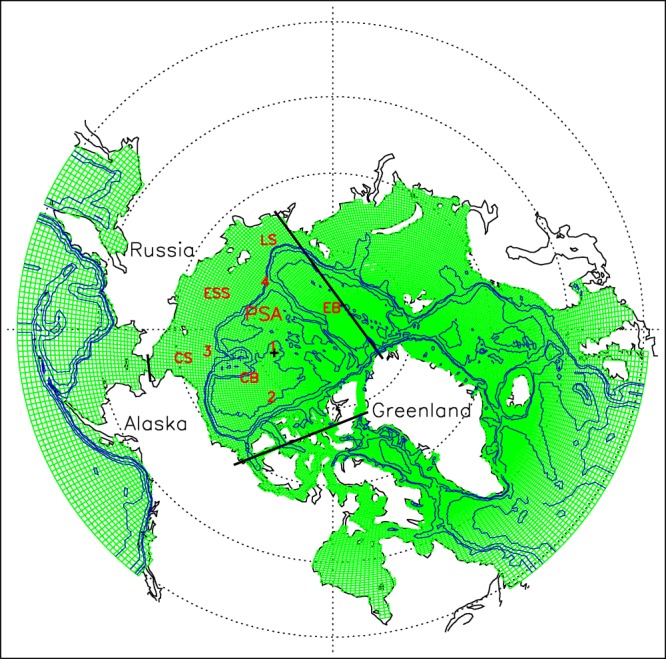
Grid configuration and bathymetry of the coupled three-dimensional pan-arctic biology/sea ice/ocean model; bathymetry contours of 400, 800, 2200, and 3600 m are plotted. The areas enclosed by thick black lines are defined here as the Pacific sector of the Arctic Ocean (PSA). The PSA is defined such that it includes most of the regions affected by the cyclone with sea level pressure (SLP) under 1000 hPa on 7 August 2012. A black cross is plotted at the location with the lowest SLP on that date, representing the center of the August cyclone. The Chukchi, East Siberian, and Laptev seas and Canada and Eurasian basins are marked by CS, ESS, LS, CB, and EB, respectively. Also marked are four locations for detailed analysis (section).
Figure 2.
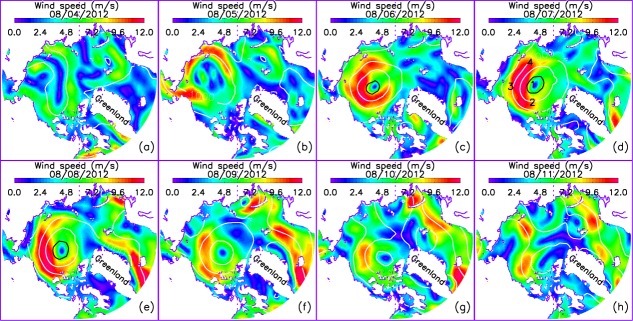
NCEP/NCAR reanalysis surface wind speed during 4–11 August 2012. The black and white lines are NCEP/NCAR reanalysis sea level pressure (SLP, in hPa) contours with contour interval of 10 hPa. The black contour is the 980 hPa SLP contour and the white contours are with SLP greater than 980 hPa. The numbers of four locations detailed for analysis (section) are shown in (d).
[4] By the time the storm reached the Arctic, the sea ice cover was much thinner than in previous years [Zhang et al., 2013]. The thin ice cover has less mechanical strength and is more susceptible to changes in wind forcing than a thicker ice cover. The intense storm winds sped ice movement, enhanced vertical turbulent fluxes of momentum, and increased vertical diffusivity, producing strong mixing in the ocean surface mixed layer [Zhang et al., 2013]. Given this, we ask: What was the impact of the storm on the marine planktonic ecosystem in the Arctic Ocean? To address this question, we conducted numerical experiments using the coupled Pan-arctic Biology/Ice/Ocean Modeling and Assimilation System (BIOMAS).
2. Model Description
2.1. Model Elements
[5] BIOMAS is a coupled biophysical model [Zhang et al., 2010] that has three model elements: a sea ice model, an ocean circulation model, and a pelagic biological model. The pelagic biological model is an 11-component marine pelagic ecosystem model that includes two phytoplankton components (diatoms and flagellates), three zooplankton components (microzooplankton, copepods, and predator zooplankton), dissolved organic nitrogen, detrital particulate organic nitrogen, particulate organic silica, nitrate, ammonium, and silicate (Figure 3) [Zhang et al., 2010; also see Kishi et al., 2007]. Values of key biological parameters used in the model are listed in Zhang et al. [2010]. The ocean circulation model is based on the Parallel Ocean Program (POP) developed at Los Alamos National Laboratory [Smith et al., 1992]. The POP ocean model is modified so that open boundary conditions can be specified [Zhang and Steele, 2007]. The sea ice model is a 12 category thickness and enthalpy distribution (TED) sea ice model [Zhang and Rothrock, 2003; Hibler, 1980]. It is adopted from the Pan-arctic Ice/Ocean Modeling and Assimilation System (PIOMAS) [Zhang and Rothrock, 2003].
Figure 3.
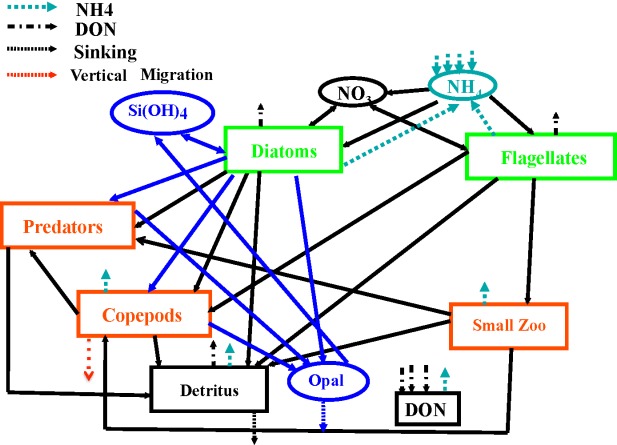
Schematic of the BIOMAS ecosystem model [Zhang et al., 2010]. Marked are two phytoplankton components (diatoms, flagellates), three zooplankton components (small zooplankton/microzooplankton, copepods, predator zooplankton), dissolved organic nitrogen (DON), detrital particulate organic nitrogen (detritus), particulate organic silica (opal), nitrate (NO3), ammonium (NH4), and silicate (Si(OH)4). Solid black arrows indicate nitrogen flows and blue arrows indicate silicon flows. The black discontinuous arrows are flows to the dissolved organic matter and the blue discontinuous arrows are the flows to ammonium.
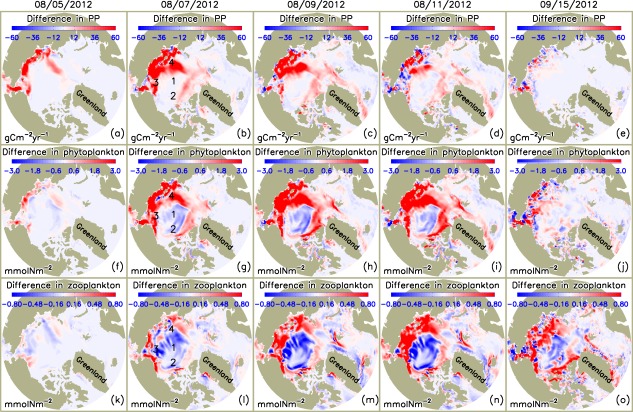
2.2. Model Configuration and Experiments
[6] The BIOMAS model domain covers the Northern Hemisphere north of 49°N (Figure 1). The BIOMAS finite-difference grid is based on a generalized orthogonal curvilinear coordinate system with the “north pole” of the model grid placed in Greenland. The model has a mean horizontal resolution of about 22 km for the Arctic, Barents, and GIN (Greenland-Iceland-Norwegian) seas, and Baffin Bay (Figure 1). To better resolve the mixed layer and the pycnocline, the ocean's vertical dimension has 30 levels of different thicknesses, with 13 levels in the upper 100 m and the top six of them being 5 m thick.
[7] The modification of the POP ocean model to allow open boundary conditions enables BIOMAS, a regional model, to be one-way nested to a global-coupled sea ice-ocean model [Zhang, 2005]. The global model's outputs of ocean velocity, temperature, salinity, and sea surface height are used as open boundary conditions for the southern boundaries of the BIOMAS domain along 49°N. In addition, the nitrate and silicate along the open boundaries and in their vicinity are restored to monthly climatology data from the World Ocean Atlas 2005 [Garcia et al., 2006] by the same method as Zhang et al. [2010].
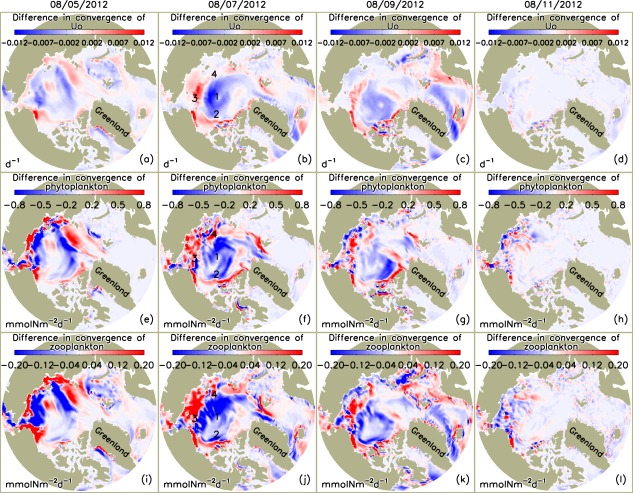
[8] BIOMAS is first integrated from 1970 to 2011, driven by daily NCEP/NCAR reanalysis surface atmospheric forcing. The atmospheric forcing consists of surface winds, air temperature, specific humidity, precipitation, evaporation, and downwelling longwave radiation and cloud fraction. Cloud fraction and surface air temperature are used to calculate surface downwelling shortwave radiation following Parkinson and Washington [1979]. Initial conditions for the BIOMAS integration consist of 1 January 1970 fields of sea ice and ocean state variables obtained from a PIOMAS integration that starts from 1948 [Zhang et al., 2008] and January mean climatology fields of nitrate and silicate from the World Ocean Atlas 2005 [Garcia et al., 2006]. Initial conditions also include a uniform distribution (0.02 mmol N m−3; 0.02 mmol Si m−3) of plankton and other biogeochemical components in the upper 200 m following Zhang et al. [2010].
[9] After the initial integration from 1970 to 2011, four model experiments were conducted to assess the impact of the intense August 2012 cyclone on the marine planktonic ecosystem. (1) A control run (CNTL) continues model integration of 2012 using the regular 2012 NCEP/NCAR reanalysis forcing that includes the August cyclone (Figure 2). (2) A model sensitivity integration (SENS) of 2012 uses the same NCEP/NCAR reanalysis forcing as the CNTL run except the cyclone is removed from the wind forcing, the main effect of the cyclone. This is done by reducing wind speed by 50% during 5–9 August [Zhang et al., 2013], which largely removes the cyclone effects in the wind forcing. (3) The third model experiment (CLIM) is similar to the SENS run except that daily average wind fields over 2000–2011 are used during 5–9 August. Because of the use of climatological mean (over the recent past) wind forcing, no cyclone effects exist in the CLIM run. (4) The fourth model experiment includes 12-member ensemble simulations (ENSE) of 5 August 2012 onward. Each of the 12 ensemble simulations uses the NCEP/NCAR reanalysis wind and thermal forcing from one of the past 12 years (2000–2011) and starts with the same initial conditions at the end of 4 August 2012 created by the CNTL simulation. Thus, the ENSE runs represent the weather and climate variability in the recent past without the presence of the 2012 cyclone. No data assimilation was conducted in this study to create physically consistent CNTL, SENS, CLIM, and ENSE runs with and without the cyclone influence.
[10] A comparison between SENS and CLIM shows that the simulated ecosystem results from these two runs are rather close, generally within 2%. This suggests that the methods used to remove the cyclone wind forcing from these two runs yield similar effects on the ecosystem. Therefore, only the results from the CNTL, SENS, and ENSE runs are presented.
3. Results
3.1. Model-Data Comparisons
[11] To estimate the impact of the cyclone on the marine planktonic ecosystem, BIOMAS must simulate the ecosystem in the PSA with some skill. Here we compare the CNTL-simulated monthly mean surface chlorophyll a (chl a) with the Moderate Resolution Imaging Spectroradiometer (MODIS)-Terra observed monthly composite surface chl a for ice-free areas during June 2012 to September 2012 (Figure 4). Note that the basic currency of the biological model component is nitrogen (mmol N m−3), which needs to be converted to carbon (C) and chl a for model-data comparisons. We follow Lavoie et al. [2009] to use a fixed C:N (mol:mol) ratio of 106:16 [Redfield et al., 1963] and a fixed N:chl a (wt:wt) ratio of 8.75:1 for the unit conversions. The comparison shows that the model captures the basic spatial pattern of MODIS observations in the months before and after the August cyclone in the open water areas of the PSA. Model results and observations show generally higher chl a concentration in the coastal areas and on the Chukchi, Beaufort, and East Siberian shelves (Figure 4). Although model results are generally within the range of the MODIS observations in the open water areas of the PSA, the model underestimates or overestimates surface chl a from time to time and from location to location. Specifically, the model overestimates surface chl a in the open water areas of the Chukchi, East Siberian, and Laptev seas in July and August, but underestimates surface chl a in the Laptev Sea in September. The discrepancies may be linked to model overestimation or underestimation of snow/ice and nutrient distributions and to uncertainties in model parameters such as phytoplankton photoinhibition and photochemical reaction coefficients and zooplankton grazing and mortality rates [Zhang et al., 2010].
Figure 4.
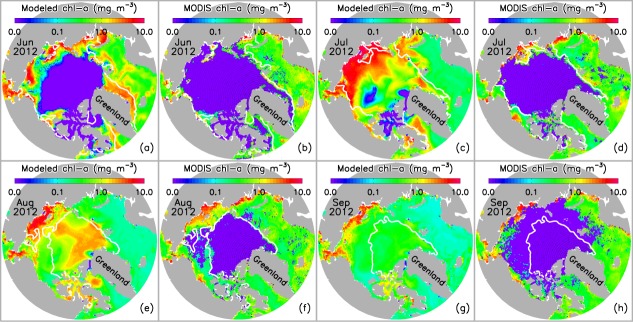
Model (CNTL)-simulated monthly mean and MODIS-Terra observed monthly composite surface concentration of chl a for June to September 2012. The white line represents satellite observed ice edge defined as 0.15 ice concentration. There are no MODIS chl a data under ice (dotted areas). MODIS chl a data are available from http://oceancolor.gsfc.nasa.gov/. Satellite ice concentration data are from http://nsidc.org/data/nsidc-0081.html.
[12] The model generates high surface chl a concentration in some ice-covered areas where MODIS chl a data are nonexistent because data retrievals are hindered by the ice cover (Figures 4a–4d). The simulated high under-ice chl a concentration occurs mainly on or near the shelves in the PSA (Figure 4c). This is no surprise; observations of a massive under-ice phytoplankton bloom in the northern Chukchi Sea were made during a 2011 field campaign associated with ICESCAPE (Impacts of Climate on the Eco-Systems and Chemistry of the Arctic Pacific Environment) [Arrigo et al., 2012]. In addition, the model shows relatively low under-ice chl a concentration in most of the Canada Basin, which agrees qualitatively with the chl a observations reported by Nishino et al. [2013].
3.2. Spatial Patterns of Cyclone Effects
[13] By 4 August 2012, just before the cyclone entered the PSA, the simulated nutrients in much of the surface waters in the Arctic Ocean were already depleted because of summer nutrient drawdown [e.g., Gosselin et al., 1997; Lee and Whitledge, 2005; Tremblay et al., 2008; Codispoti et al., ,]. Surface nitrate concentration at this time is nearly zero in most of the Arctic except in some areas on the shelves of the East Siberian and Laptev seas, in the Eurasian Basin, and near the Canadian Archipelago (Figure 5a). The relatively high surface nitrate concentration in part of the East Siberian and Laptev seas may explain why model results and observations show higher surface chl a there (Figures 4e–4f). Simulated surface nitrate concentration on the East Siberian shelf, however, would continue to decrease (not shown here) throughout the summer to approach the low levels observed by Anderson et al. [2011]. Consistent with the summer observations reported by Codispoti et al. [2013], nitrate also persists in some areas in the Eurasian Basin and near the Canadian Archipelago, where the simulated under-ice chl a concentration is up to 3 mg m−3 in August 2012 (Figure 4e).
Figure 5.

CNTL-simulated nitrate in the upper (a) 10 m and (b) 100 m of the Arctic Ocean, and (c) primary productivity (PP), (d) phytoplankton, and (e) zooplankton in the upper 100 m on 4 August 2012 just before the storm. Four locations for detailed analysis (section) are marked in each map.
[14] The simulated spatial distribution of nitrate in the upper 100 m of the ocean on 4 August 2012 shows generally high concentrations on the shelves of the Chukchi, East Siberian, and Laptev seas, moderate concentrations in the Eurasian Basin, and low concentrations in much of the Canada Basin (Figure 5b). The high concentration on the shelves is likely due to upwelling in the shelf break regions that brings nutrient-rich waters from deep offshore basins onto the shelves [e.g., Carmack and Wassmann, 2006; Carmack et al., 2006; Pickart et al., ,,; Codispoti et al., ,] and nutrient-rich Pacific waters entering through Bering Strait [e.g., Codispoti et al., 2005; Grebmeier and Harvey, 2005]. Low concentrations in the Canada Basin are due to Ekman convergence and downwelling resulting from the predominant anticyclonic ocean circulation of the Beaufort gyre as well as to biological depletion in the upper portion of the depth interval. Recent observations indicate increases in Ekman convergence and downwelling and freshwater input in the Canada Basin in association with increasing sea ice retreat and melt [McLaughlin and Carmack, 2010] that are linked to an intensified Beaufort gyre [e.g., Proshutinsky et al., 2009; Yang, 2009], which enhances ocean stratification and deepens the nutricline in the Canada Basin [e.g., McLaughlin and Carmack, 2010; Nishino et al., ,].
[15] Simulated spatial patterns of primary productivity (PP) and phytoplankton (sum of diatoms and flagellates) biomass on 4 August 2012 resemble closely the patterns of nitrate concentration in the upper 100 m, with relatively high concentrations on the shelves and low concentrations in the Canada Basin (Figures 5b–5d). This is consistent with observations that summer phytoplankton growth is limited largely by nitrogen availability [e.g., Gosselin et al., 1997; Lee and Whitledge, 2005; Tremblay et al., 2008; Codispoti et al., ,]. Like the phytoplankton biomass, the simulated zooplankton (summation of microzooplankton, copepods, and predatory zooplankton) biomass on 4 August 2012 is low in the Canada Basin and relatively high on the shelves, with the highest value on the Chukchi shelf (Figure 5e). Simulated zooplankton biomass is low in the Canada and Eurasian basins that are generally covered by thicker, more compact ice. Under-ice zooplankton growth is limited by food availability because under-ice phytoplankton blooms in the areas of thicker, more compact ice generally form later in the season and are of smaller magnitude than in the shelf regions with thin ice or open water [e.g., Zhang et al., 2010; Jin et al., 2012; Popova et al., 2012].
[16] On 5 August 2012, the storm moved into the Arctic Basin from Siberia. The CNTL simulation including the cyclone wind forcing compared with the SENS run without the cyclone indicates that the storm caused an increase in the simulated PP in the Chukchi, East Siberian, and Laptev shelves and in part of the Eurasian Basin (Figure 6a) where wind speed increased (Figure 2b). The cyclone intensified substantially during 6–8 August (Figures 2c–2e); the model simulates a strong increase in PP in much of the shelf areas, the Eurasian Basin, and even in some areas near the Canadian Archipelago (Figure 6b). The increase in PP in those areas remains strong on 9 August (Figure 6c) but starts to fade (Figure 6d) as the cyclone passes its peak and begins to weaken (Figures 2f–2h). The simulated increase in PP on the shelves and in part of the deep basins during the storm leads to an increase in phytoplankton biomass (Figures 6f–6i). A phytoplankton increase on the shelves and in part of the deep basins in turn leads to an increase in zooplankton that graze on phytoplankton (Figures 6k–6n). By 15 September, there is almost no increase in PP on the shelves (Figure 6e). There is still an increase in phytoplankton biomass on most of the shelves, but the increase is diminished by mid-September (Figure 6j). The increase in zooplankton biomass appears to be more persistent than that in phytoplankton biomass (Figure 6o).
Figure 6.
Simulated difference in PP, phytoplankton, and zooplankton in the upper 100 m of the ocean between the CNTL and SENS runs over the period 5 August 2012 to 15 September 2012.
[17] The simulated increase in PP on the shelves and in some areas in the deep basins in the PSA during the storm is due to an increase in the availability of nutrients in the upper 10 m in those areas (Figures 7a–7d). The simulated increase in the nitrate concentration generally occurs in the areas of strong winds (Figures 2b–2f) that strengthen sea ice speed [Zhang et al., 2013] and surface ocean circulation (Figures 8a–8c), enhancing vertical mixing in the upper ocean. The enhanced mixing is reflected in an increased vertical diffusivity in the upper 15 m of the ocean (Figures 8e–8g) at locations affected by the cyclone. Depending on the vertical turbulent fluxes of momentum, vertical diffusivity is calculated based on the KPP (K-profile parameterization) of oceanic boundary layer mixing [Large et al., 1994]. Strong winds and rapid ice movement tend to amplify the vertical momentum transfer, which leads to larger vertical diffusivity in the ocean surface mixed layer and hence stronger vertical mixing [Zhang et al., 2013].
Figure 7.
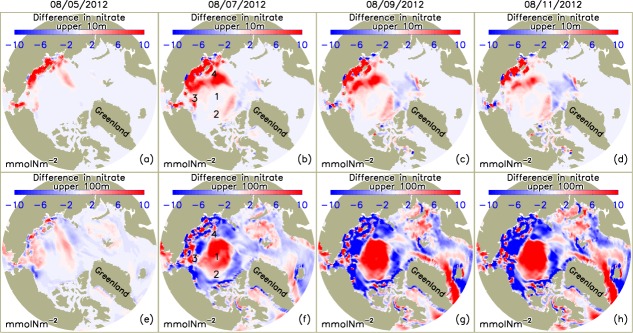
Simulated difference in nitrate in the upper (a–d) 10 m and (e–h) 100 m of the Arctic Ocean between CNTL and SENS runs over the period 5–11 August 2012.
Figure 8.
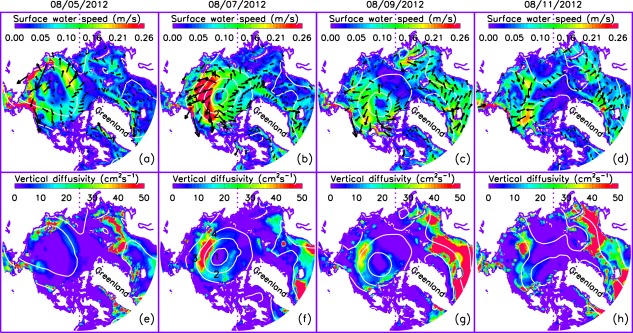
Simulated surface ocean velocity (vector) and (a–d) speed (colors) and (e–h) mean vertical diffusivity in the upper 15 m of the Arctic Ocean over the period 5–11 August 2012. The white lines are NCEP/NCAR reanalysis sea level pressure (SLP) contours with contour interval of 10 hPa. One of every 100 surface ocean velocity vectors is plotted.
[18] The increase in nitrate concentration in the upper 10 m is linked to the increase in vertical diffusivity. On 5 August 2012, just as the storm is moving into the PSA, larger vertical diffusivity is simulated in the surface mixed layer in coastal areas of the Chukchi, East Siberian, and Laptev shelves where strong winds are driving the surface ocean waters faster (Figures 2b, 8a, and 8e). As a result of stronger mixing, nitrate concentration increases in the coastal areas (Figure 7a). During 6–8 August, as the storm intensifies over most of the PSA (Figures 2c–2e), vertical diffusivity and nitrate concentration in the upper ocean increase (Figures 8f and 7b). The areas of increasing diffusivity and nitrate concentration follow the SLP contours in areas of strong winds and fast moving surface waters. There is little increase in nitrate concentration, however, in the upper 10 m of the Canada Basin (Figure 7b) even though large vertical diffusivity in the surface mixed layer is simulated. There, the nitrate in the upper 10 m is depleted by summer drawdown before the cyclone's passage (Figure 5a) and the average nitrate concentration in the upper 100 m is low (Figure 5b), so there is no resupply to the upper 10 m during the mixing.
[19] The simulated spatial patterns of the storm-induced change in nitrate concentration in the upper 100 m show a decrease over most of the shelves because of increases in PP there (Figures 6a–6d), which draws down nutrients, including those that are mixed upward from the lower portion of the water column. (The water column is often less than 100 m over the shelves.) As mentioned earlier, it is the higher nitrate concentrations in the surface waters (Figures 7a–7d) that fuel this increase in PP, while at the same time the total nitrate in the upper 100 m is drawn down and incorporated into increased phytoplankton biomass (Figures 6f–6i). The spatial patterns also show an increase in simulated nitrate concentration in the upper 100 m in the central PSA where the storm was centered (Figures 7f–7h). This is because the cyclone results in a strong cyclonic surface ocean circulation (Figures 8a–8c), which leads to strong divergence in the central PSA and corresponding convergence in the adjacent areas, including some of the shelf regions (Figures 9a–9c). The elevated divergence in the central PSA, often dominated by Ekman convergence and downwelling when there are no cyclones, likely causes upwelling in that region, leading to an increase in nitrate concentration over the upper 100 m (Figures 7f–7h), but not as shallow as the upper 10 m (Figures 7a–7d). This explains the low phytoplankton growth/PP during the storm in the central PSA (Figures 6a–6d).
Figure 9.
Simulated difference in the convergence of (a–d) ocean velocity Uo , (e–h) phytoplankton
 , and (i–l) zooplankton
 in the upper 100 m of the Arctic Ocean between the CNTL and SENS runs over the period 5–11 August 2012, where u is ocean velocity vector, P and Z are phytoplankton and zooplankton concentrations, and z is depth. The CTNL-simulated convergence fields of these variables are generally close to the difference fields in magnitude and spatial pattern and are therefore not shown.
[20] Except in the deep Canada Basin the model simulates significant under-ice phytoplankton and zooplankton biomass in some areas of the central PSA, particularly in the areas near the shelves (Figure 5). The storm-induced divergence moves the phytoplankton and zooplankton away from the central PSA, yielding a lower phytoplankton and zooplankton biomass than had the cyclone not occurred (Figures 9e–9g and 9i–9k), into adjacent areas including most of the shelf regions, yielding an increase in plankton biomass there (Figures 6e–6i). The storm-induced divergence also transports nitrate from the central PSA to the adjacent areas, but this transport is unnoticeable (not shown) because nitrate is largely depleted in most of the upper ocean of the central PSA in early August (Figure 5a).
3.3. Evolution of Cyclone Effects
[21] The enhancement of biological production on the shelves at the expense of the central PSA is further illustrated by the vertical profiles and evolution of the ecosystem variables at four locations. Location 1 is roughly at the center of the August 2012 cyclone's low-pressure system in the deep Canada Basin with weak winds, location 2 is in the deep Canada Basin with strong winds during the storm, location 3 is on the Chukchi shelf, and location 4 is near the shelf break of the East Siberian Sea (Figures 1 and 2d). Locations 2, 3, and 4 are in the areas of strong winds during the storm.
[22] At the eye of the storm with weak winds (location 1), the model simulates near-zero vertical diffusivity (background value) [Zhang and Steele, 2007] throughout the water column on 7 August 2012 (Figure 10a), indicating little ocean mixing. On 7 August during the cyclone or on 27 August after the cyclone's passage, the nitrate concentration in most of the upper water column simulated by CNTL with the cyclone wind forcing is not much different from that simulated by SENS without the cyclone forcing (Figure 10c). However, the CNTL-simulated PP and plankton biomass are lower than the SENS results; the differences, though, are small, generally within 10% (Figures 10e, 10g, 10i, 11a, 11c, and 11e).
Figure 10.
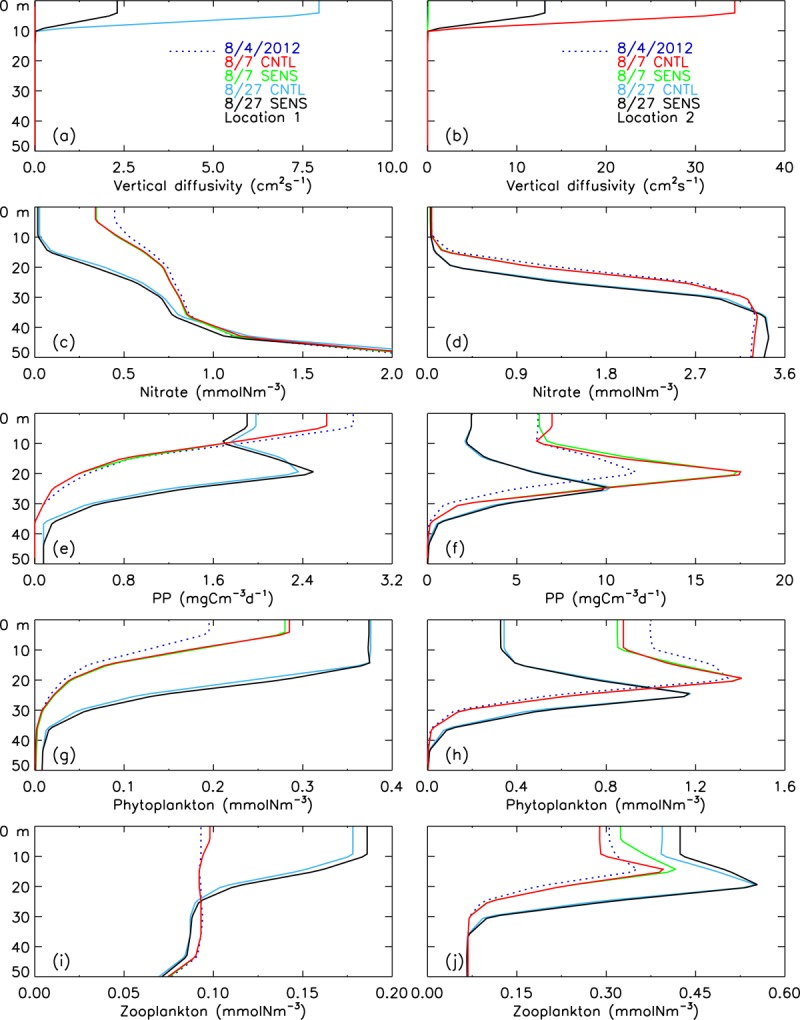
CNTL-simulated and SENS-simulated vertical profiles of (a and b) vertical diffusivity, (c and d) nitrate, (e and f) PP, (g and h) phytoplankton, and (i and j) zooplankton before (4 August 2012), during (7 August), and after (27 August) the cyclone in the upper 50 m of the water column at (left) location 1 and (right) location 2.
Figure 11.
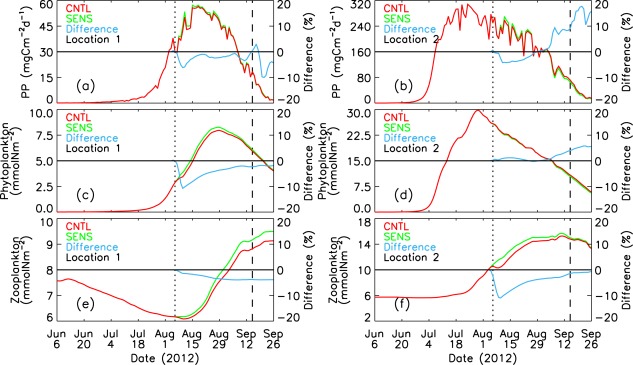
CNTL-simulated and SENS-simulated daily PP, phytoplankton, and zooplankton in the upper 100 m of the water column at locations 1 and 2. The difference is calculated by (CNTL – SENS)/SENS*100%. The vertical dotted and dashed lines represent 6 August 2012 and 15 September 2012, respectively.
[23] The differences between the CNTL and SENS runs are generally small also at location 2, which is in the deep Canada Basin as well, but in the zone of strong winds. The strong winds and rapid movement of ice [Zhang et al., 2013] and surface waters (Figures 8a–8c) result in strong ocean mixing, mainly in the upper 10 m with large vertical diffusivities (Figure 10b). Strong mixing in the surface ocean mixed layer, however, increases nitrate concentration and PP in the upper 10 m very little (Figures 10d and 10f) because the surface waters are depleted by summer drawdown (Figure 5a). Location 2 is also in the divergence zone (areas of blue color in Figure 9b), so the simulated PP and zooplankton during the storm (CNTL) are lower than if the cyclone had not occurred (SENS; Figures 11b and 11f). The CNTL-simulated phytoplankton is, however, not lower than the SENS run during the storm (Figure 11d), which is likely due to a decrease in zooplankton biomass (Figure 11f) and reduced grazing pressure on phytoplankton.
[24] Locations 3 and 4 are located on or near the shelves in the zone of strong winds. Strong ocean mixing (Figures 8f, 12a, and 12b) increases nitrate concentration in the surface waters (Figures 7b–7d and 12c–12d). The divergence induced by the cyclone in the central PSA transports more biomass onto the shelves (Figure 9) and locations 3 and 4; the CNTL-simulated PP and phytoplankton biomass in the surface waters as well as in the upper 100 m are much higher than the SENS simulations (Figures 12e–12h). The simulated PP and phytoplankton biomass peak prior to the cyclone's passage into the PSA, but the differences in PP and phytoplankton biomass in the upper 100 m between the CNTL and SENS runs at locations 3 and 4 are as high as 90% during the storm (Figures 13a–13d). However, the differences become smaller over time as PP and phytoplankton biomass decrease into early autumn.
Figure 12.
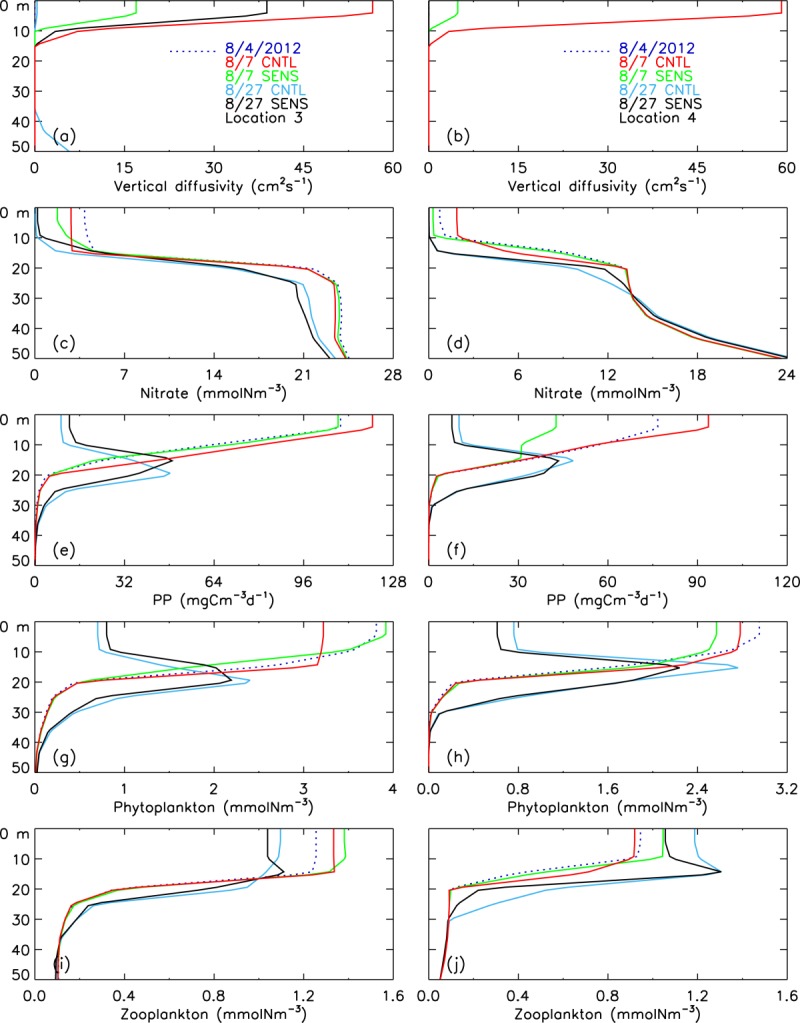
CNTL-simulated and SENS-simulated vertical profiles of (a and b) vertical diffusivity, (c and d) nitrate, (e and f) PP, (g and h) phytoplankton, and (i and j) zooplankton before (4 August 2012), during (7 August), and after (27 August) the cyclone in the upper 50 m of the water column at (left) location 3 and (right) location 4.
Figure 13.
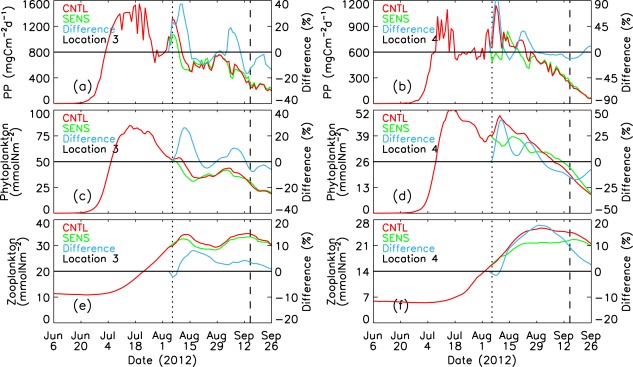
CNTL-simulated and SENS-simulated daily PP, phytoplankton, and zooplankton in the upper 100 m of the water column at locations 3 and 4. The difference is calculated by (CNTL – SENS)/SENS*100%. The vertical dotted and dashed lines represent 6 August 2012 and 15 September 2012, respectively.
[25] The increase in the zooplankton biomass follows the increase in phytoplankton food availability at locations 3 and 4 (Figures 13e–13f). The simulated zooplankton increase occurs immediately after the storm when the simulated phytoplankton biomass increases strongly. The zooplankton increase in turn reduces phytoplankton through grazing. This may explain, in part, the fluctuations of the differences in PP and phytoplankton between the CNTL and SENS runs after the storm (Figures 13a–13d). The general increase in food availability and enhanced divergence results in positive differences (CNTL – SENS) in zooplankton at locations 3 and 4 (Figures 13e–13f and 12i–12j). The zooplankton difference at location 4 reaches a maximum of 18% on 31 August and remains at 10% on 15 September (Figure 13f). Increased zooplankton grazing on phytoplankton in the CNTL run decreases phytoplankton during much of September at location 4, up to 17% compared to the SENS run (Figure 13d).
[26] To assess how unusual the storm-induced changes on the shelves are, we compare the CNTL-simulated changes in chl a during the storm (in 5–10 August 2012) with the ENSE simulation results for locations 3 and 4 (Figure 14). Because ENSE consists of 12-member ensemble simulations of 5 August 2012 onward using the reanalysis atmospheric forcing from the past 12 years (2000–2011), the changes in chl a during 5–10 August 2012 may be considered to represent the “normal” variability in the recent years without the cyclone effects. Figure 14 shows that chl a biomass would normally decrease at locations 3 and 4 during 5–10 August (also see Figures 13c and 13d). The average decrease over all the 12 ensemble members (2000–2011) is 17% at location 3 and 5% at location 4. However, with the cyclone effects, the CNTL-simulated decrease at location 3 is only 1%. Moreover, CNTL simulates an increase of 28% at location 4 (Figure 14). This suggests that the cyclone-induced changes in chl a biomass are quite different from normal variability in recent years.
Figure 14.
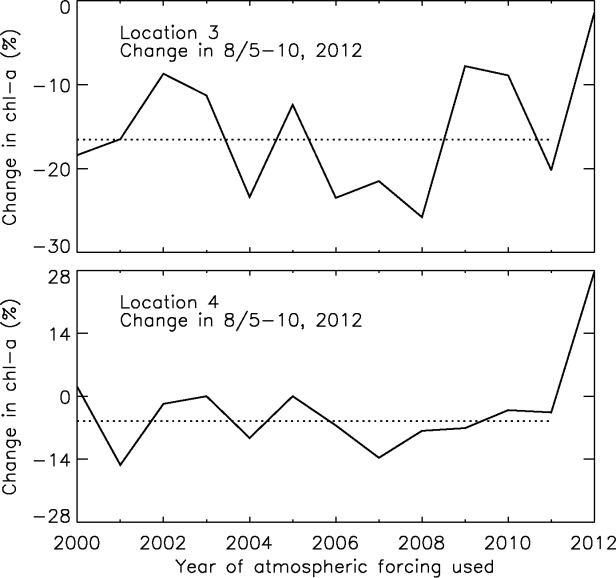
Change in chl a in the upper 100 m of the water column at locations 3 and 4 in 5–10 August2012 simulated by the 12 ENSE members forced by the reanalysis atmospheric forcing from the past 12 years (2000–2011) and by the CNTL run (2012). The dash line represents the average change of the 12 (2000–2011) ensemble simulations.
[27] Averaged over the entire PSA (Figure 15) CNTL simulations show, during passage of the storm, enhanced ocean mixing in mainly the upper 10 m of the PSA (Figure 15a). Nitrate concentration is higher in the upper 10 m but generally lower at depth (Figure 15b). The increased nitrate concentration in the surface waters generally leads to higher PP, phytoplankton, and zooplankton (Figures 15c–15e). On average over the entire PSA, however, the increase in PP and plankton in the upper 100 m is only prominent during and immediately after the storm (Figures 16a–16c), even though the model simulates a generally strong and lasting (1 month or slightly longer) biological gain in some areas on the shelves. The gain on the shelves may be partially cancelled by the biomass loss in the central PSA. As a result, the storm increases biological production only for a short period of time on average over the entire PSA (Figures 16a–16c) while drawing down nutrients simultaneously (Figure 16d).
Figure 15.
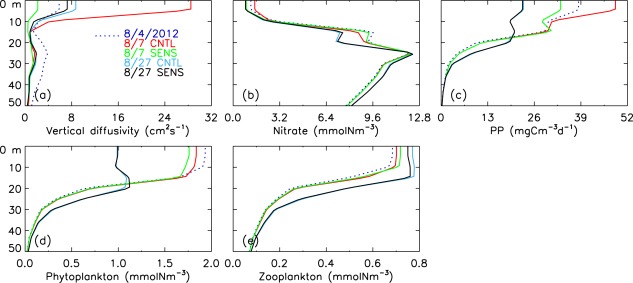
CNTL-simulated and SENS-simulated vertical profiles of (a) vertical diffusivity, (b) nitrate, (c) PP, (d) phytoplankton, and (e) zooplankton before (4 August 2012), during (7 August), and after (27 August) the cyclone in the upper 50 m averaged over the PSA.
Figure 16.
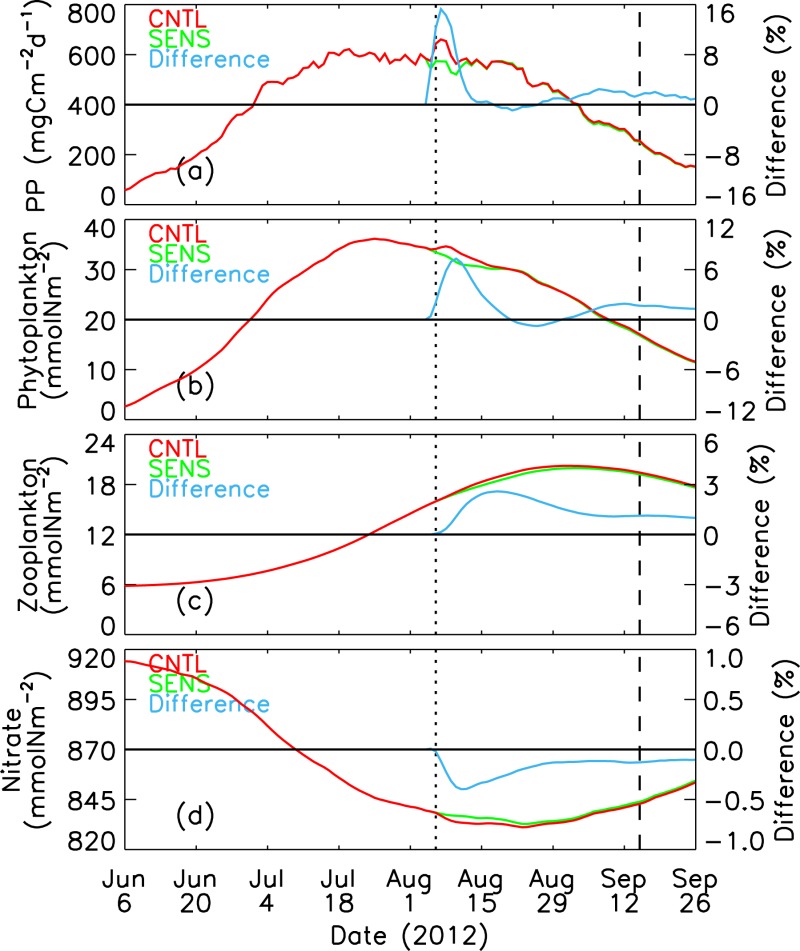
CNTL-simulated and SENS-simulated daily nitrate, PP, phytoplankton, diatoms, zooplankton, and total nitrogen in the upper 100 m of the Pacific sector of the Arctic (PSA, see Figure 1). The difference is calculated by (CNTL – SENS)/SENS*100%. The vertical dotted and dashed lines represent 6 August 2012 and 15 September 2012, respectively.
[28] Averages over the entire PSA also demonstrate the seasonal cycles in abundance and production: nutrients (here nitrate) peak in early June, both primary production and phytoplankton peak in July and decline through August into September and later (and draw down nitrate), while zooplankton continue to increase in biomass through August, appropriately lagging the phytoplankton biomass (Figure 16). The immediate response to the storm mimics this cycles, with a zooplankton increase lagging the phytoplankton increase in timing and magnitude. The biological response to the storm in the absence of advection is illustrated by the percent difference of the system components (Figure 16). Primary productivity increases almost immediately, while the response in phytoplankton biomass peaks several days later, and it takes 8–10 days before the zooplankton response reaches its peak. In addition, the peak magnitude of the response is greatest for PP (16%), less for phytoplankton biomass (6%), and least for zooplankton (3%). This increase in the delay and a decrease in the magnitude of the response with increasing trophic level mimic the seasonal production cycle.
4. Concluding Remarks
[29] The great Arctic cyclone of early August 2012 swept over the PSA at a time when primary productivity (PP) and phytoplankton biomass are in decline after a peak in July, particularly on the shelves. Nonetheless, the BIOMAS model results show that the cyclone impacts the ecosystem by enhancing productivity strongly on the shelves during the storm. Although the passage of the cyclone in the PSA lasted only a few days, the simulated biological effects on the shelves last 1 month or longer into the late summer and early autumn when biological processes become severely limited by sunlight scarcity. In the central PSA, however, PP and plankton biomass decrease during and in the wake of the cyclone.
[30] The simultaneous biological gain on the shelves and loss in the central PSA is linked to two key factors. One is mixing: the cyclone's strong winds lead to large diffusivities in the ocean surface layer over the shelf regions and the deep basins that experience the forcing. The enhanced ocean mixing increases nutrient availability and productivity in the surface waters on the shelves. The enhanced mixing fails to increase nutrient availability in the surface waters in the central PSA because nutrients to the depth of mixing are mostly depleted by the time of the cyclone passage; the simulated nitrate concentration in the upper 100 m in the central PSA, including the Canada Basin, is also much lower than on most of the shelves, owing to prevailing Ekman convergence and downwelling linked to the predominant anticyclonic ocean circulation (Beaufort gyre). As a result, productivity in most of the central PSA is not enhanced by the strong ocean mixing driven by the intense cyclone.
[31] The second factor is divergence: the cyclone transports more biomass (plankton) into the shelf regions from the central PSA. The low-pressure system and strong cyclonic circulation of sea ice and ocean surface waters in the PSA, which is often dominated by anticyclonic circulation, leads to divergence and upwelling in the central PSA. Model simulations show significant under-ice phytoplankton and zooplankton biomass in part of the central PSA, particularly in the areas near the shelves. The divergence tends to drive phytoplankton and zooplankton out of these areas into the adjacent areas including the shelf regions. This loss of plankton biomass in the central PSA is the main reason for the decrease in productivity there. The divergence increases plankton biomass on the shelves, contributing to the increase in productivity there, in addition to the contribution due to strong ocean mixing.
[32] The changes in PP and phytoplankton biomass on the shelves fluctuate during and after the storm, which reflects the complex nature of marine food-web dynamics. Strong mixing in the ocean surface waters and divergence in the central PSA increase PP and phytoplankton biomass on the shelves, but the increased phytoplankton food availability and the same ocean divergence in the central PSA increase zooplankton biomass on the shelves, which in turn reduces phytoplankton growth through increased grazing. This food-web dynamic causes the fluctuation in the changes in PP and phytoplankton biomass during and after the cyclone. Ultimately, it is zooplankton and organisms in the upper trophic levels on the shelves that benefit the most from the cyclone passage.
[33] The simulated biological gain on the shelves is greater than the loss in the central PSA; net productivity over the entire PSA is increased by the cyclone. However, because the gain on the shelves is offset by the loss in the central PSA, the average increase over the entire PSA is moderate and lasts only about 10 days. Nevertheless, the net productivity increase in the PSA confirms the statement from the Nansen Center report that “The Arctic fertility is spurred up by the cyclones,” [NIERSC, 2012], which is based on satellite observations (of ocean color) showing increased surface chl a in the Barents Sea after a cyclone passage around 15 May 2003. Polar cyclones generally increase marine biological productivity, just like cyclones in other parts of the world ocean [e.g., Lin et al., 2003]. The generally positive impact of polar cyclones on the Arctic marine planktonic ecosystem, particularly on the shelves, is likely to grow with increasing summer cyclone activity if the Arctic continues to warm and the ice cover continues to shrink.
[34] Note that the model's 22 km average resolution would not adequately resolve mesoscale eddies, which are important for shelf-basin exchange in the PSA [e.g., Spall et al., 2008; Watanabe, 2011]. The intense cyclone may cause baroclinic instability of the ocean flows in the Chukchi and Beaufort shelf break regions, promoting the formation of eddies there. It is likely that the absence of realistic eddies in the simulations may lead to an underestimation of the cyclone impact on the ecosystem.
Acknowledgments
[35] This work is supported by the NSF Office of Polar Programs and the NASA Cryosphere Program. We thank two anonymous reviewers for their constructive comments.
References
- Anderson LG, Bjork G, Pipko I, Shakhova N, Semiletov I. Wahlstrom I. East Siberian Sea, and Arctic region of very high biogeochemical activity. Biogeoscience. 2011;8:1745–1754. [Google Scholar]
- Arrigo KR. Massive phytoplankton blooms under Arctic sea ice. Science. 2012;336:1408. doi: 10.1126/science.1215065. et al. (, doi: 10.1126/science.1215065. [DOI] [PubMed] [Google Scholar]
- Carmack E. Wassmann P. Food webs and physical-biological coupling on pan-Arctic shelves: Unifying concepts and comprehensive perspectives. Prog. Oceanogr. 2006;71:446–477. [Google Scholar]
- Carmack EC, Barber D, Christensen J, Macdonald R, Rudel B. Sakshaug E. Climate variability and physical forcing of the food webs and the carbon budget on panarctic shelves. Prog. Oceanogr. 2006;71(2–4):145–181. [Google Scholar]
- Codispoti LA, Flagg C, Kelly V. Swift JH. Hydrographic conditions during the 2002 SBI process experiments. Deep Sea Res., Part II. 2005;52:3199–3226. [Google Scholar]
- Codispoti LA, Flagg C. Swift JH. Hydrographic conditions during the 2004 SBI process experiments. Deep Sea Res., Part II. 2009;56:1144–1169. [Google Scholar]
- Codispoti LA, Kelly V, Thessen A, Matrai P, Suttles S, Hill VJ, Steele M. Light B. Synthesis of primary production in the Arctic Ocean: III. Nitrate and phosphate based estimates of net community production. Prog. Oceanogr. 2013;110:126–150. [Google Scholar]
- Comiso JC. Large decadal decline of the Arctic multilayer ice cover. J. Clim. 2012;25:1176–1193. [Google Scholar]
- Garcia HE, Locarnini RA, Boyer TP. Antonov JI. World Ocean Atlas 2005: Nutrients (phosphate, nitrate, silicate) In: Levitus S, editor; NOAA Atlas NESDIS 64. Vol. 4. Washington, D.C: U.S. Gov. Print. Off; 2006. p. 396. edited by, vol., and, pp. [Google Scholar]
- Gosselin M, Levasseur M, Wheeler PE, Horner RA. Booth BC. New measurements of phytoplankton and ice algal production in the Arctic Ocean. Deep Sea Res., Part II. 1997;44:1623–1644. [Google Scholar]
- Grebmeier JM. Harvey HR. The Western Arctic Shelf–Basin Interactions (SBI) project: An overview. Deep Sea Res., Part II. 2005;52:3109–3115. [Google Scholar]
- Hassol SJ. Impacts of a Warming Arctic: Arctic Climate Impact Assessment. New York: Cambridge Univ. Press; 2004. p. 139. [Google Scholar]
- Hibler WD., III Modeling a variable thickness sea ice cover. Mon. Weather Rev. 1980;108:1943–1973. [Google Scholar]
- IPCC. Climate change 2007: The physical science basis. In: Solomon S, editor. Contribution of Working Group I to the Fourth Assessment Report of the Intergovernmental Panel on Climate Change. Cambridge, U. K: Cambridge Univ. Press; 2007. p. 996. edited by et al., pp. [Google Scholar]
- Jin M, Deal C, Lee SH, Elliott S, Hunke E, Maltrud M. Jeffery N. Investigation of Arctic sea ice and ocean primary production for the period 1992 to 2007 using a 3-D global ice-ocean ecosystem model. Deep Sea Res., Part II. 2012;81–84:28–35. and, doi: 10.1016/j.dsr2.2011.06.003. [Google Scholar]
- Kalnay E. The NCEP/NCAR 40-year reanalysis project. Bull. Am. Meteorol. Soc. 1996;77:437–471. et al. ( [Google Scholar]
- Kishi MJ. NEMURO—A lower trophic level model for the North Pacific marine ecosystem. Ecol. Model. 2007;202:12–25. et al. ( [Google Scholar]
- Kwok R. Rothrock DA. Decline in Arctic sea ice thickness from submarine and ICESat records: 1958–2008. Geophys. Res. Lett. 2009;36:L15501. and, doi: 10.1029/2009GL039035. [Google Scholar]
- Kwok R. Thinning and volume loss of the Arctic Ocean sea ice cover: 2003–2008. J. Geophys. Res. 2009;114:C07005. et al. (, doi: 10.1029/2009JC005312. [Google Scholar]
- Large WG, McWilliams JC. Doney SC. Oceanic vertical mixing: A review and a model with a nonlocal boundary layer parameterization. Rev. Geophys. 1994;32:363–403. [Google Scholar]
- Lavoie D, Macdonald RW. Denman KL. Primary productivity and export fluxes on the Canadian shelf of the Beaufort Sea: A modeling study. J. Mar. Syst. 2009;75:17–32. [Google Scholar]
- Lee SH. Whitledge TE. Primary and new production in the deep Canada Basin during summer 2002. Polar Biol. 2005;28:190–197. [Google Scholar]
- Lin I, Liu WT, Wu C-C, Wong GTF, Hu C, Chen Z, Liang W-D, Yang Y. Liu K-K. New evidence for enhanced ocean primary production triggered by tropical cyclone. Geophys. Res. Lett. 2003;30(13):1718. and, doi: 10.1029/2003GL017141. [Google Scholar]
- McCabe GJ, Clarc MP. Serreze MC. Trends in Northern Hemisphere surface cyclone frequency and intensity. J. Clim. 2001;14:2763–2768. [Google Scholar]
- McLaughlin FA. Carmack EC. Deepening of the nutricline and chlorophyll maximum in the Canada Basin interior, 2003–2009. Geophys. Res. Lett. 2010;37:L24602. and, doi: 10.1029/2010GL045459. [Google Scholar]
- Meier WN, Stroeve J. Fetterer F. Whither arctic sea ice? A clear signal of decline regionally, seasonally and extending beyond the satellite record. Ann. Glaciol. 2007;46:428–434. [Google Scholar]
- NIERSC (Nansen International Environmental and Remote Sensing Center) Biennial Report 2011–2012. Russia: St. Petersburg; 2012. [Google Scholar]
- Nishino S, Kikuchi T, Yamamoto-Kawai M, Kawaguchi Y, Hirawake T. Itoh M. Enhancement/reduction of biological pump depends on ocean circulation in the sea-ice reduction regions of the Arctic Ocean. J. Oceanogr. 2011;67:305–314. and, doi: 10.1007/s10872-011-0030-7. [Google Scholar]
- Nishino S, Itoh M, Williams WJ. Semiletov I. Shoaling of the nutricline with an increase in near-freezing temperature water in the Makarov Basin. J. Geophys. Res. 2013;118:635–649. and, doi: 10.1029/2012JC008234. [Google Scholar]
- Orlanski I. On the poleward deflection of storm tracks. J. Atmos. Sci. 1998;55:2577–2602. [Google Scholar]
- Parkinson CL. Comiso JC. On the 2012 record low Arctic sea ice cover: Combined impact of preconditioning and August storm. Geophys. Res. Lett. 2013;40:1356–1361. and, doi: 10.1002/grl.50349. [Google Scholar]
- Parkinson CL. Washington WM. A large-scale numerical model of sea ice. J. Geophys. Res. 1979;84:311–337. [Google Scholar]
- Pickart RS, Moore GWK, Torres DJ, Fratantoni PS, Goldsmith RA. Yang J. Upwelling on the continental slope of the Alaskan Beaufort Sea: Storms, ice, and oceanographic response. J. Geophys. Res. 2009;114:C00A13. and, doi: 10.1029/2208JC005. [Google Scholar]
- Pickart RS, Spall MA, Moore GWK, Weingartner TJ, Woodgate RA, Aagaard K. Shimada K. Upwelling in the Alaskan Beaufort Sea: Atmospheric forcing and local versus non-local response. Prog. Oceanogr. 2011;88:78–100. [Google Scholar]
- Pickart RS, Schulze LM, Moore GWK, Charette MA, Arrigo KR, van Dijken G. Danielson SL. Long-term trends of upwelling and impacts on primary productivity in the Alaskan Beaufort Sea. Deep Sea Res., Part I. 2013;79:106–121. [Google Scholar]
- Polyakov I. Observational program tracks Arctic Ocean transition to a warmer state. Eos Trans. AGU. 2007;88:398–399. et al. ( [Google Scholar]
- Popova EE, Yool A, Coward AC, Dupont F, Deal C, Elliott S, Hunke E, Jin M, Steele M. Zhang J. What controls primary production in the Arctic Ocean? Results from an ecosystem model intercomparison. J. Geophys. Res. 2012;117:C00D12. and, doi: 10.1029/2011JC007112. [Google Scholar]
- Proshutinsky A, Krishfield R, Timmermans M-L, Toole J, Carmack E, McLaughlin F, Williams WJ, Zimmermann S, Itoh M. Shimada K. Beaufort Gyre freshwater reservoir: State and variability from observations. J. Geophys. Res. 2009;114:C00A10. and, doi: 10.1029/2008JC005104. [Google Scholar]
- Redfield AC, Ketchum BH. Richards FA. The influence of organisms on the composition of sea-water. In: Hill MN, editor; The Sea. New York: Wiley-Interscience; 1963. pp. 26–77. edited by, and. [Google Scholar]
- Rigor IG, Colony R. Martin S. Variations in surface air temperature observations in the Arctic, 1979–1997. J. Clim. 2000;13:896–895. [Google Scholar]
- Schweiger A, Lindsay RW, Zhang J, Steele M, Stern H. Kwok R. Uncertainty in modeled Arctic sea ice volume. J. Geophys. Res. 2011;116:C00D06. and, doi: 10.1029/2011JC007084. [Google Scholar]
- Sepp M. Jaagus J. Changes in the activity and tracks of Arctic cyclones. Clim. Change. 2011;105(3–4):577–595. [Google Scholar]
- Serreze MC. Barrett AP. The Summer Cyclone maximum over the central Arctic Ocean. J. Clim. 2008;21:1048–1065. and, doi: 10.1175/2007JCLI1810.1. [Google Scholar]
- Serreze MC, Walsh JE, Chapin SF, III, Osterkamp T, Dyurgerov M, Romanovsky V, Oechel WC, Morison J, Zhang T. Barry RG. Observational evidence of recent change in the northern, high-latitude environment. Clim. Change. 2000;46:159–207. [Google Scholar]
- Serreze MC, Holland MM. Stroeve J. Perspectives on the Arctic's shrinking sea-ice cover. Science. 2007;315:1533–1536. doi: 10.1126/science.1139426. [DOI] [PubMed] [Google Scholar]
- Simmonds I. Rudeva I. The great Arctic cyclone of August 2012. Geophys. Res. Lett. 2012;39:L23709. and, doi: 10.1029/2012GL054259. [Google Scholar]
- Smith RD, Dukowicz JK. Malone RC. Parallel ocean general circulation modeling. Physica D. 1992;60:38–61. [Google Scholar]
- Spall MA, Pickart RS, Fratantoni PS. Plueddemann AJ. Western Arctic shelfbreak eddies: Formation and transport. J. Phys. Oceanogr. 2008;38:1644–1668. [Google Scholar]
- Steele M, Ermold W. Zhang J. Arctic Ocean surface warming trends over the past 100 years. Geophys. Res. Lett. 2008;35:L02614. and, doi: 10.1029/2007GL031651. [Google Scholar]
- Tremblay J-E. Vertical stability and the annual dynamics of nutrients and chlorophyll fluorescence in the coastal, southeast Beaufort Sea. J. Geophys. Res. 2008;113:C07S90. et al. (, doi: 10.1029/2007JC004547. [Google Scholar]
- Watanabe E. Beaufort shelf break eddies and shelf-basin exchange of Pacific summer water in the western Arctic Ocean detected by satellite and modeling analyses. J. Geophys. Res. 2011;116:C08034. doi: 10.1029/2011JC006259. [Google Scholar]
- Yang J. Seasonal and interannual variability of downwelling in the Beaufort Sea. J. Geophys. Res. 2009;114:C00A14. doi: 10.1029/2008JC005084. [Google Scholar]
- Zhang J. Warming of the arctic ice-ocean system is faster than the global average since the 1960s. Geophys. Res. Lett. 2005;32:L19602. doi: 10.1029/2005GL024216. [Google Scholar]
- Zhang J. Rothrock DA. Modeling global sea ice with a thickness and enthalpy distribution model in generalized curvilinear coordinates. Mon. Weather Rev. 2003;131(5):681–697. [Google Scholar]
- Zhang J. Steele M. The effect of vertical mixing on the Atlantic water layer circulation in the Arctic Ocean. J. Geophys. Res. 2007;112:C04S04. and, doi: 10.1029/2006JC003732. [Google Scholar]
- Zhang J, Lindsay RW, Steele M. Schweiger A. What drove the dramatic retreat of Arctic sea ice during summer 2007? Geophys. Res. Lett. 2008;35:L11505. and, doi: 10.1029/2008GL034005. [Google Scholar]
- Zhang J, Spitz YH, Steele M, Ashjian C, Campbell R, Berline L. Matrai P. Modeling the impact of declining sea ice on the Arctic marine planktonic ecosystem. J. Geophys. Res. 2010;115:C10015. and, doi: 10.1029/2009JC005387. [Google Scholar]
- Zhang J, Lindsay R, Schweiger A. Rigor I. Recent changes in the dynamic properties of declining Arctic sea ice: A model study. Geophys. Res. Lett. 2012;39:L20503. and, doi: 10.1029/2012GL053545. [Google Scholar]
- Zhang J, Lindsay R, Schweiger A. Steele M. The impact of an intense summer cyclone on 2012 Arctic sea ice retreat. Geophys. Res. Lett. 2013;40:720–726. and, doi: 10.1002/grl.50190. [Google Scholar]
- Zhang X, Walsh JE, Zhang J, Bhatt US. Ikeda M. Climatology and interannual variability of Arctic cyclone activity: 1948–2002. J. Clim. 2004;17:2300–2317. [Google Scholar]


