Abstract
Purpose
To identify objective, quantitative optic nerve head (ONH) structural features and model the contributions of glaucoma.
Methods
Baseline stereoscopic optic disc images of 1635 glaucoma-free participants at risk for developing primary open-angle glaucoma (POAG) were collected as part of the Ocular Hypertension Treatment Study. A stereo correspondence algorithm designed for fundus images was applied to extract the three-dimensional (3D) information about the ONH. Principal component analysis was used to identify ONH 3D structural features and the contributions of demographic features, clinical variables, and disease were modeled using linear regression and linear component analysis. The computationally identified features were evaluated based on associations with glaucoma and ability to predict which participants would develop POAG.
Results
The computationally identified features were significantly associated with future POAG, POAG-related demographics (age, ethnicity), and clinical measurements (horizontal and vertical cup-to-disc ratio, central corneal thickness, and refraction). Models predicting future POAG development using the OHTS baseline data and STEP features achieved an AUC of 0.722 in cross-validation testing. This was a significant improvement over using only demographics (age, sex, and ethnicity), which had an AUC of 0.599.
Conclusions
Methods for identifying objective, quantitative measurements of 3D ONH structure were developed using a large dataset. The identified features were significantly associated with POAG and POAG-related variables. Further, these features increased predictive model accuracy in predicting future POAG. The results indicate that the computationally identified features might be useful in POAG early screening programs or as endophenotypes to investigate POAG genetics.
Keywords: primary open-angle glaucoma, optic nerve head, stereo fundus, image analysis, structural modeling
In this study, quantitative features of optic nerve head structure were identified from stereo color photos in a large cohort. We show that these features are as powerful as cup-to-disc ratio and pattern standard deviation for predicting future conversion to glaucoma.
Glaucoma is one of the most common causes of blindness throughout the world.1,2 It is a progressive disease characterized by degeneration of retinal ganglion cells and the optic nerve. This disease, if left untreated, leads to progressive, irreversible vision loss that may ultimately result in blindness.3 Early detection of glaucoma is crucial to preserving vision and providing better patient outcomes. Although glaucoma occurs in a number of different primary and secondary forms, here we consider only the most common form of the disease, primary open-angle glaucoma (POAG). This form affects an estimated 3% of people aged 40 to 80 worldwide.2
In clinical settings, examination of the optic nerve head (ONH) is central to diagnosis of glaucoma and tracking disease progression. Characteristic changes in the three-dimensional (3D) structure of the ONH are associated with POAG. Figure 1 illustrates the location of typical ONH structure and common changes associated with glaucoma. Localized loss of nerve tissue that results in a notch in the ONH rim or generalized loss resulting in an overall loss of rim are common signs of glaucomatous damage. The health of the optic nerve and the stability of POAG are typically gauged by assessing this type of loss using the cup-to-disc ratio (CDR), the ratio of the diameter of the cup to the diameter of the entire ONH, with large values associated with glaucomatous neuropathy.4 Other important clinical measurements of glaucoma include IOP, central and peripheral loss of vision (visual fields), and central corneal thickness (CCT).
Figure 1.
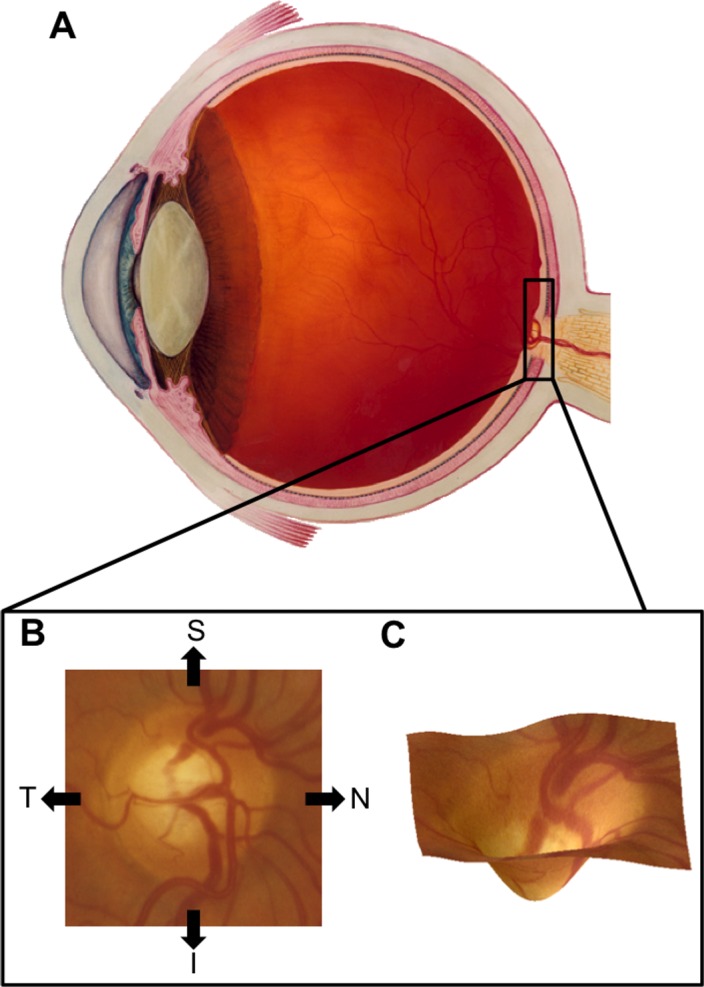
(A) Cross-section of the human eye with the location of the ONH highlighted (inset). Illustration courtesy of National Eye Institute (in the public domain at http://nei.nih.gov/photo/). (B) The ONH as it appears in fundus images with the nasal (N), temporal (T), superior (S), and inferior (I) directions labeled. (C) A 3D rendering of the ONH showing typical structure.
However, there is variability in these measurements in both healthy and glaucomatous individuals.5 Consequently, although these clinical measurements are used to diagnose and manage patients with glaucoma, their sensitivity and specificity to predict which asymptomatic individuals might develop glaucoma in the future is limited.6,7 Moreover, the clinical measurements and structural evaluation of the ONH as judged by eye care professionals can be subjective and confounded by large variability in both healthy and glaucoma patient populations.8–10 These challenges to successful screening for glaucoma underscore the need to identify objective, quantitative assessments of features that predict risk for developing glaucoma.
Previous work has described and evaluated a number of different approaches for quantitatively measuring ONH structure. The simplest of these methods uses human or semiautomated systems to measure traditional aspects of ONH structure, such as disc diameter, cup diameter, CDR, and disc, cup, or rim area. Direct measurements of surface 3D information are gathered using Heidelberg retinal tomography (HRT) and both surface as well as internal structural data are captured using optical coherence tomography (OCT) imaging. These measurements have been used extensively in predicting, diagnosing, and monitoring POAG,11–14 as well as endophenotypic measurements for studying POAG genetics.15–17 These techniques are limited, however, in their ability to completely capture ONH structure. They reduce a complex, high-dimensional characteristic (ONH structure) to a single or to a few measurements that describe only a small number of possible variations in ONH structure.
Recently, more sophisticated methods based on statistical shape modeling techniques have been applied to a number of biological questions related to eye structures.18–20 These approaches tend to use techniques in which a model of the relevant biological structure is learned from a set of training observations. Often, this consists of using statistical techniques to identify common modes of variation in structure or associations with relevant biological measurements, such as disease. The identified features can then be used to describe complex changes in biological structures using only a small number of dimensions.20 We have previously developed and validated methods for extracting 3D information about the ONH from stereo images.21 We have shown that features derived from these measurements of ONH structure capture demographic and genetic information.22–24
We hypothesize that we can apply these computational techniques to discover unknown relationships among ONH structure, clinical phenotypes, and disease. Specifically, we have used an existing, large-scale dataset including structural imaging, and demographic and clinical measures from participants in the Ocular Hypertension Treatment Study (OHTS) to develop and evaluate methods for modeling ONH structure. Further, we have evaluated features extracted from these models based on their relationships with known POAG risk factors and disease.
Materials and Methods
Participant Cohort and Data Collection
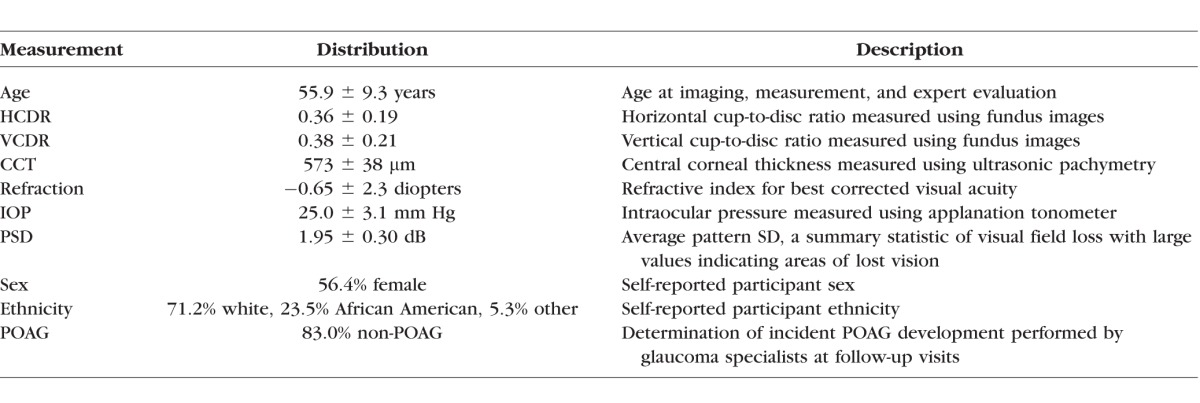
Baseline data gathered as part of the OHTS were used to perform all analyses. The cohort for this study (n = 1635) consisted of participants with elevated IOP. As a condition of enrollment, each participant had a complete eye examination and was judged to not have glaucoma at the time of enrollment based on stereoscopic optic disc images and visual field evaluation.25 At enrollment, stereo images, demographic data, and phenotypic measurements were collected from each participant. The demographic and phenotypic measurements included age, ethnicity, sex, IOP, CCT, horizontal cup-to-disc ratio (HCDR), vertical cup-to-disc ratio (VCDR), refraction, and average pattern standard deviation (PSD) measured using Humphrey 30-2 visual field testing.26 HCDR and VCDR were assessed using stereo photos by trained technicians at a reading center. Each measurement was an average of at least two readers. See the published description of the OHTS protocol for a detailed description of how each measurement was collected.27 The OHTS had a longitudinal design, and 10 to 12 years of follow-up data are available for the participant cohort including if and when each participant developed POAG. Table 1 summarizes the baseline dataset.25
Table 1.
The Set of Measurements Gathered From OHTS Participants at Baseline and Follow-up Visits in the Case of POAG
At enrollment, stereo photographs of the optic nerve and surrounding retina were acquired for all OHTS participants. These initial, film-based stereo pair photographs were captured with several different fundus cameras at different sites using a standard protocol and then digitized at high resolution by the OHTS Optic Disc Reading Center at Bascom Palmer.25 The starting data for the imaging portion of the current work consisted of high-resolution TIFF images scanned from film slides. Automated methods were applied to computationally identify the location of the optic disc center.28 Optic disc locations for all 1635 stereo pairs were manually verified, and updated when needed. To account for differences in apparent ONH size caused by differing imaging set ups without affecting relevant ONH structural parameters, images were grouped by camera and scaled to have equal mean optic disc diameters.
Stereo Correspondence
Three-dimensional information was inferred from stereo pairs using a custom stereo correspondence algorithm. Unlike many other stereo correspondence algorithms, this custom approach has been tuned to handle problems characteristic of stereo fundus images. This includes regions of low contrast, low signal-to-noise ratio, and fundus imaging–specific artifacts, and occlusions. This algorithm has previously been compared with other stereo correspondence algorithms and with 3D measurements taken via OCT.21 Although our algorithm outperformed similar stereo correspondence algorithms and was correlated with OCT measurements, there were notable errors in depth inference and distortions in ONH surface structure. Regardless of the errors or distortions in inferred depth, the resulting structural measurements are satisfactory for the current work based on previous applications showing that they capture important biological information, such as heritable and demographic-associated ONH structural features.23,29
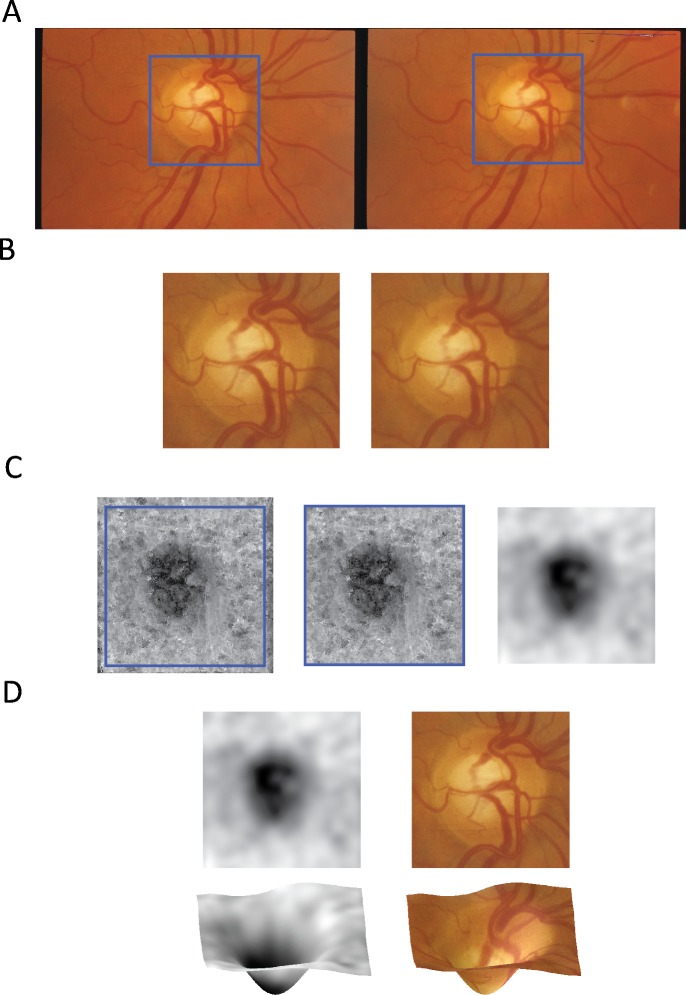
The correspondence algorithm produced dense, quantitative maps of depth across the ONH region including both the cup and rim regions. In particular, each stereo fundus pair produced a depth map image in which the value of each depth map pixel indicates the relative depth of the corresponding location in the fundus images. The inference of 3D information from stereo pairs requires a map of pixel correspondences to be constructed. For each pixel in the first image of the pair, this map indicates the pixel in the second image that covers the same location in the scene. Depth at each pixel can then be inferred based on the distance between corresponding pixels. Issues that prevent the correspondence from being determined, therefore, introduce noise or artifacts into the inferred depth measurements. Noise reduction and artifact removal steps were applied to reduce the effects of noise or artifacts. Because there may not be overlap of the stereo pairs at the edges of each image, correspondence cannot always be reliably established. To account for this, a small border (25 pixels) was cropped from each depth map. Additionally, Gaussian smoothing and down sampling was applied to the maps to reduce noise caused by small correspondence errors. The final output consisted of a single 50 × 50 depth map indicating 3D ONH structure for each input stereo fundus pair. Figure 2 illustrates the preprocessing steps applied to the depth maps and how they encode 3D information.
Figure 2.
(A) The input stereo fundus images with the ONH region highlighted in blue. (B) The cropped ONH region. (C) The raw depth map resulting from the stereo correspondence algorithm, the edge-cropped depth map, and the final, smoothed depth map. (D) The final depth map shown along with the corresponding 3D structure and overlaid with the fundus ONH region.
Feature Identification
Optic nerve head structural endophenotypes (STEPs) were identified so that observed variability in ONH structure as well as contributions from clinical measurements and disease were explained. To this end, two distinct methods were used to identify STEPs. The first considered only depth information as inferred from the stereo image pairs. The goal of this procedure was to identify common modes of variation observed in the depth maps inferred from stereo fundus images. The second also incorporated demographic and phenotypic information from the set of variables available in the OHTS dataset. This procedure was meant to explicitly model the relationship between ONH structure and POAG-related demographic and clinical features. The first set of features is referred to as depth-based STEPs, and the second is referred to as phenotype-based STEPs. Because the ONH measurements are derived from stereo fundus images, these STEPs can only describe the surface and not the internal structure of the ONH.
In both cases, the set of participants for which both imaging and genotype data are available (n = 1635) was considered. For each participant, only a single, baseline stereo pair taken of the right eye was considered. The depth map inferred from each stereo pair was vectorized by mapping each pixel location to a corresponding vector component. Using this representation, each depth map consisted of a 2500 (50 × 50) component vector. Finally, because depth values inferred from different participants and different imaging set ups did not all have the same range of values, a normalization procedure was applied. The data were normalized by computing the mean and variance of depth values at each location. Depth values were then standardized so that they had a zero mean and unit variance across all participants.
The depth-based features were identified using principal component analysis (PCA). Principal component analysis is a technique commonly used to reduce the dimensionality of high-dimensional data sets. In this case, PCA greatly reduces the number of dimensions needed to represent the depth maps by taking advantage of the nonindependence of depth values at different pixel locations. This results in a small set of STEPs that explain most of the variance observed in the data. The generated features also possess a natural ordering based on how much of the variance that each explains: the first explains the greatest amount of variance and each subsequent feature explains a smaller amount. Using this technique, the cumulative amount of variance in the original data explained by adding each successive feature can be quantified. For this work, enough features to explain at least 95% of the variance in the depth map data were retained and used for further analyses.
The phenotype-based STEPs were identified using linear regression and linear discriminant analysis (LDA)-based approaches. In both cases, models were constructed to predict the phenotypic variables from ONH structural features. These differing approaches were applied to account for the different types of phenotypic variables. In the case of binary or categorical measurements (sex and ethnicity), LDA was used to model the relationship between the variable and ONH structure. Linear discriminant analysis is an approach that can be applied to high-dimensional data to estimate relationships between the dimensions and a categorical variable that assigns a class to each data point. Specifically, LDA finds the linear combination of dimensions that provides the greatest separation between data points of different classes.30 In the case of quantitative measurements (age, IOP, CCT, HCDR, VCDR, refraction, visual field performance), multiple linear regression models were used to model the relationship. This type of linear model is well understood and common statistics can be used to evaluate their suitability for modeling a given relationship. In both cases, the PCA-reduced depth data were used as predictive features for each variable of interest. This resulted in a phenotype-based STEP for each variable that can be considered as estimates of the effect of each variable on ONH structure.
Feature Evaluation
The STEPs (both depth- and phenotype-based) were evaluated based on associations with OHTS measurements. To test for significant associations, one-way ANOVA (categorical measurements) and Student's t-tests (quantitative measurements) were used. Bonferroni correction with an adjusted P value cutoff of 0.05 was used to account for multiple hypothesis-testing issues.
In addition to association testing, the identified STEPs were evaluated based on their utility in building predictive models for future development of POAG. For this evaluation, a baseline set of features consisting of only demographic information (age, sex, and ethnicity) was used. This baseline feature set was augmented first by adding in the remainder of the OHTS features (see Table 1 for the list of features) and then additionally augmented by adding the STEP features.
These sets of features were evaluated based on their ability to predict which OHTS participants would go on to develop POAG. The features were used as part of predictive models known as k-nearest neighbor classifiers. Area under the receiver operating characteristic curves (AUC) was computed for each feature set. The performance of the features was compared internally to each other as well as to previously published results predicting POAG in the OHTS dataset. These AUC values were computed on the entire OHTS dataset so that direct comparisons to previously published AUC values could be made.31,32 Because evaluation of a model tends to overestimate performance, a 10-fold cross-validation approach also was used to estimate predictive performance on unseen data.
Results
Optic Nerve Head Structural Inference
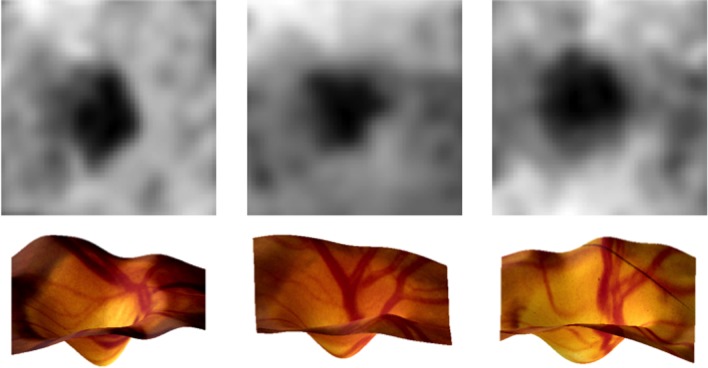
The 3D ONH structure for each of 1635 OHTS participants was computed from the baseline stereo pairs taken of the right eye. Figure 3 shows example depth maps and the corresponding 3D structure for several stereo pairs.
Figure 3.
Example depth maps and the corresponding 3D ONH structures.
Identification of STEPs
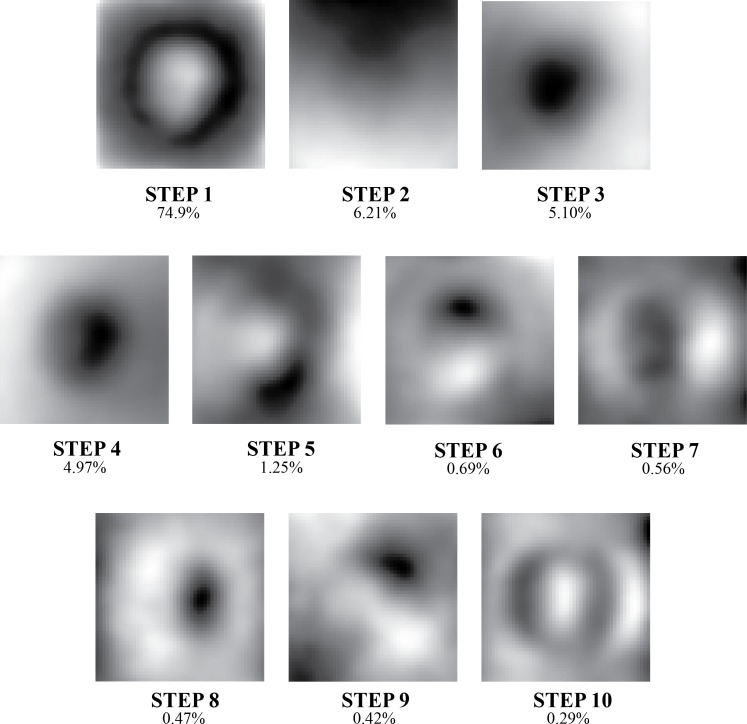
PCA-based analysis of the resulting depth maps was performed to identify ONH STEPs. The 10 most powerful STEPs explained 95% of the variance observed within the ONH depth map data. Graphical representations of the structures encoded by these STEPs are provided in Figure 4.
Figure 4.
Grayscale representation of the 10 PCA-based STEPs used to model ONH structure and the percentage of variance in depth data that each explained. Collectively, these features explained 95% of the variance observed.
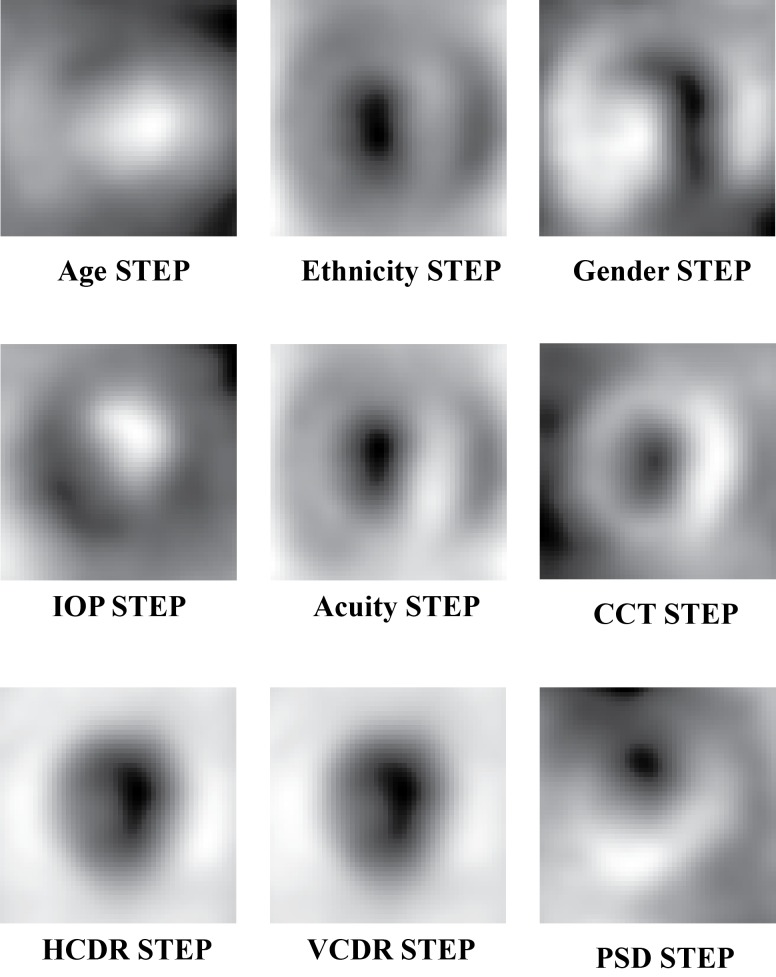
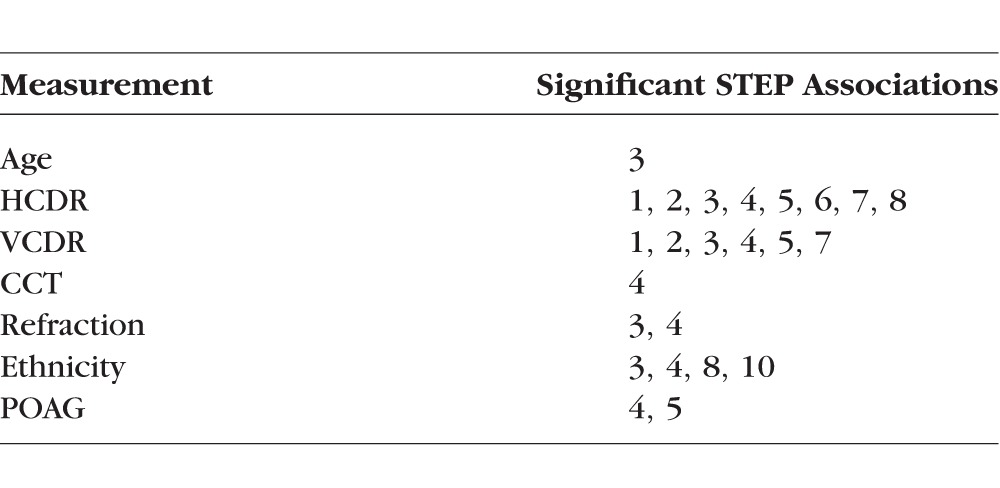
Phenotype-based STEPs were computed using LDA and linear regression models to estimate the relationship between the demographic and clinical measurements and ONH structure. Figure 5 presents each of the phenotype-based STEPs. Phenotype-based STEPs were evaluated based on their statistical association to the demographic and clinical measurements. After multiple hypothesis correction, significant associations were discovered between ONH structure and several of the phenotypes. These include significant associations between ONH structure and age, ethnicity, CCT, refraction, and both HCDR and VCDR. The associations with IOP and PSD were not significant. In the case of the HCDR and VCDR, the resulting phenotype-based STEPs explained roughly 60% of the observed variance in HCDR and VCDR (r2 = 0.62 and 0.59, respectively). Table 2 details the results of this association testing. Each association here was significant after Bonferroni correction.
Figure 5.
The phenotype-based STEPs used to model the contribution of demographic and clinical variables to ONH structure.
Table 2.
The List of Significant Associations Between OHTS Measurements and STEP Features
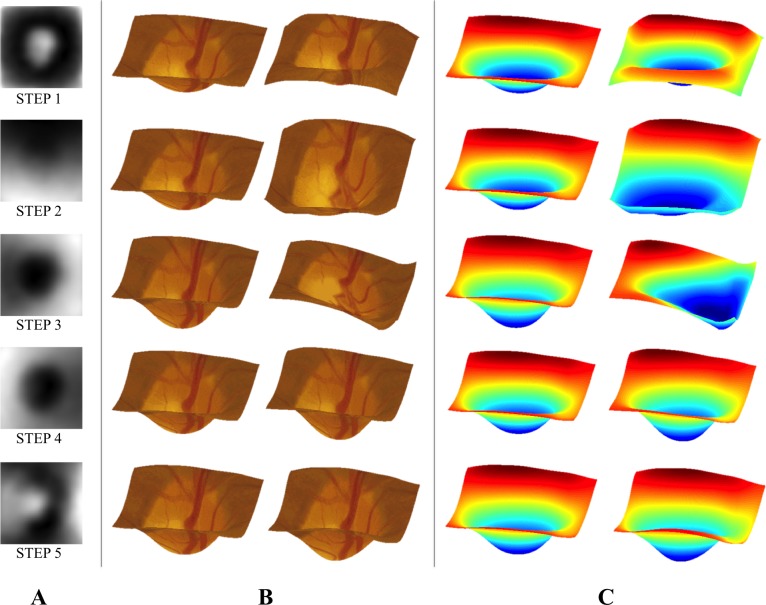
Illustrations showing the changes to ONH structure associated with a subset of the depth- and phenotype-based STEPs are shown in Figure 6.
Figure 6.
(A) Grayscale representations of the first five PCA-based STEPs. Here, dark and bright areas indicate regions of the ONH that this feature affects. (B) Visualizations intended illustrate the changes associated with each STEP. A median depth map (left) is shown along with a simulated depth map constructed using an extreme value (the maximum observed value) of the STEP. (C) The same images shown as heat maps to help illustrate depth.
The set of OHTS measurements and STEP features were evaluated based on their ability to predict which OHTS participants would develop POAG. Using only the baseline (demographic) features resulted in an AUC of 0.720. Adding the remainder of the OHTS measurements led to an AUC of 0.793. Finally, incorporating STEP features boosted AUC to 0.806. The cross-validation approach to estimate performance of STEP features on unseen data resulted in an AUC of 0.722 compared with 0.701 using the OHTS measurements and 0.599 using only demographic features.
Discussion
Computational methods for identifying 3D structural features of the ONH were applied to a large cohort of participants at risk for developing POAG. These methods simultaneously incorporate both imaging and demographic/phenotypic variables to model ONH structure. The identified STEPs serve as objective, quantitative predictive features for POAG and as endophenotypes that can be used to investigate contributors to ONH structure and disease.
Extensive work has been published regarding both diagnosis and early prediction of POAG. This includes methods that that rely on a variety of clinical and imaging-based measurements. In particular, POAG predictive models incorporating age, IOP, CCT, VCDR, and PSD have been built and evaluated using data from the entire OHTS cohort. These models achieved AUCs ranging from 0.74 to 0.77 in predicting future conversion to POAG, depending on the parameters used to construct the models.31,32 This can be compared with the AUC of 0.806 achieved when incorporating STEPs to predict conversion to POAG in the OHTS dataset. External validation of these models on independent datasets led to AUCs ranging from 0.69 to 0.83, with a median performance across all surveyed cohorts of 0.71.33 These can be compared with the AUC of 0.722 achieved in cross-validation testing of models incorporating STEP features. Although STEP-based prediction fell short of the highest-reported AUCs when applying existing models to independent datasets, STEPs did increase AUC when included in models predicting POAG in the OHTS cohort. Incorporation of STEPs into prediction of these independent datasets is needed to determine if STEPs can likewise aid in early POAG prediction in those cohorts.
Recently, more attention has been focused on using ONH structural features measured using several imaging modalities to describe and diagnose POAG. More traditional measurements of ONH structure, such as CDR, rim width, optic disc and rim area, and localized rim notching measured using stereo fundus or HRT images have been augmented by internal structural measurements from OCT, especially retinal nerve fiber layer thickness. The resulting diagnostic models have shown higher performance in distinguishing between normal and glaucomatous individuals than previous attempts that fail to incorporate any ONH structure.12–14 Work by Sanfilippo et al.34 took a more sophisticated approach to modeling shape and, using methods similar to our STEP methodology, identified optic cup shape features by examining manual tracings of the optic disc and cup from fundus images. Their resulting features achieved high accuracy in discriminating normal and glaucomatous subjects. Although not focused on glaucoma, similar techniques have been applied to retinal pigmented epithelium shape measured using OCT and identified significant associations with disease.18,19 The work described here attempts to apply shape-modeling techniques to the large OHTS dataset to identify features helpful in early POAG prediction. This work is limited, though, in that only surface ONH structure could be observed using the available stereo photos and none of the internal structure captured by OCT is available. Ideally, similar methods would be applied to OCT data to computationally identify informative features of internal structure, especially glaucoma-related structures such as the retinal nerve fiber layer. We have considered only stereo-based measurements of ONH surface structure because large-scale, longitudinal datasets (such as OHTS) that include OCT imaging are not currently available.
Using the graphical representations and illustrations of changes associated with the STEPs (Fig. 6) can allow for some qualitative assessment of these features. For instance STEP 1 seems to capture some aspect of cup depth and size of the neuro-retinal rim. STEP 2, on the other hand, demonstrates slope in the vertical (superior-inferior) direction. A possible explanation is that much of the apparent slope associated with these STEPs is caused by slight variations in the orientation of the camera with respect to the optic disc. This STEP helps illustrate a limitation of the proposed methodology: the identified STEPs depend on the quality of the input stereo fundus images. Poor imaging conditions or camera orientation could lead to poor-quality stereo images. The OHTS images used here were screened for overall image and stereo quality, so further experiments are needed to determine the robustness of this methodology to image quality.
Several of the other STEPs encode structural features that are plausibly relevant to POAG progression. STEP 3 appears to encode a feature modulating the depth of the cup, whereas STEPs 5, 6, and 8 appear to encode features denoting notching of the neuro-retinal rim at specific positions (inferonasal, superior, and nasal, respectively). Other STEPs that were identified by our approach are not easily related to such characteristic ONH features recognized by clinicians. A neuro-retinal rim feature that seems to be missing is thinning in the inferotemporal region. Previous work has shown thinning in this region to be an early hallmark of glaucomatous damage.35–37 The lack of inferotemporal thinning features may be due to the population considered here. Because inferotemporal thinning is considered a hallmark of glaucomatous damage, individuals exhibiting this thinning may have been excluded from the OHTS cohort, which consisted of only non-POAG participants. The missing inferotemporal thinning is only one example; there could be additional informative features that were not identified because of the characteristics of the OHTS cohort used here. This cohort consists of individuals with ocular hypertension and considered at risk for POAG. Further study is needed to apply these methods to cohorts drawn from other populations (e.g., healthy, glaucomatous) to discover differences and similarities in identified STEPs. Further ONH structural modeling, including longitudinal evaluation of the STEPs, relevant phenotypes, and comparisons to expert evaluations of ONH shape, may reveal additional informative relationships.
We have previously published on the use of computational methods for modeling ONH structure, finding that computational methods can be used to identify features with significant heritable components and associations with POAG risk factors.23,24,29 The current results serve to support and extend the preliminary findings. Here, we seek to estimate basic building blocks of ONH structure using STEP structural modeling techniques. Evaluation of the resulting STEPs revealed that a small number (10) explained most (>95%) of the observed variance in depth measurements and significant associations with clinical measurements as well as with POAG. Significant associations of ONH structure with CCT and (as expected) both HCDR and VCDR should be noted, in particular. Given that these have been successfully used as quantitative endophenotypes to investigate genetic contributions to POAG, our results indicate that STEPs also can be used as a tool to investigate POAG and its genetic risk factors.38,39 Many of the STEPs showed multiple associations with several different clinical measurements. The presence of so many multiple associations could indicate that some standard clinical measurements may actually be a superposition of basic ONH structural building blocks. Accurate estimates of these structural building blocks will yield new ways to measure ONH structure in both normal and disease cases. Further ONH structural modeling based on large datasets needs to be performed to improve and validate the estimates.
The results presented here showed that incorporation of STEPs led to significant increases in predictive power for future development of POAG over the use of demographic and commonly used clinical measurements (IOP, CCT, and refraction). Additionally, using STEPs increases predictive power to the level achieved when clinical measurements that require expensive, specialized equipment (PSD) or training (HCDR, VCDR) are used. The speed, low cost, and ease of application make the computational STEP measurements an attractive option for large-scale screening programs because they can be easily and quickly applied to captured images to extract POAG-related features.
Confounding the study and development of treatments for POAG is that it is a genetically complex disease. Some cases of glaucoma are caused primarily by defects in a single gene, whereas others cases are caused by the combined actions of many genetic and environmental risk factors.40 Family-based studies have identified at least three genes that are capable of causing glaucoma with high pressure (myocilin41) and glaucoma that occurs at lower pressure (optineurin and TBK1).42,43 Population-based genome-wide association studies have detected some of the genetic risk factors that contribute to more complex forms of POAG.44–48 Despite these discoveries, most of the observed hereditability of POAG remains unexplained.38,45 Untangling the complexity requires examining genotypic and phenotypic data using new methodologies. In recent years, the use of quantitative endophenotypes to study genetically complex disease, including POAG, has become popular.45,49 Many population-based studies have searched for and discovered risk factors for quantitative endophenotypes of glaucoma (IOP, CCT, and CDR).16,50–54 Further study of additional quantitative endophenotypes (i.e., ONH STEPs) has the potential to identify more genetic contributors to ONH structure and risk factors for POAG.
In conclusion, the STEP methodology was shown to be a powerful tool for investigating POAG and related clinical variables. These methods can extract informative, disease-related ONH structural features from a commonly used and noninvasive imaging modality (stereo fundus). The objective nature and clinically relevant associations of STEPs indicate that they can serve to expand and augment the biomarkers currently used to study POAG.
Acknowledgments
The authors thank the OHTS Consortium for their assistance in acquiring and understanding the image and clinical data.
Supported in part by National Institutes of Health Grants R01 EY018825, R01 EY018853, R01 EY019112, R01 EY23187, R01 EY023512, and R21 EY024621; Department of Veterans Affairs Grant VA 5I01CX000119; and Research to Prevent Blindness. The authors alone are responsible for the content and writing of the paper.
Disclosure: M. Christopher, None; M.D. Abràmoff, None; L. Tang, None; M.O. Gordon, None; M.A. Kass, None; D.L. Budenz, None; J.H. Fingert, None; T.E. Scheetz, None
References
- 1. Quigley HA,, Broman AT. The number of people with glaucoma worldwide in 2010 and 2020. Br J Ophthalmol. 2006; 90: 262–267. [DOI] [PMC free article] [PubMed] [Google Scholar]
- 2. Tham YC,, Li X,, Wong TY,, Quigley HA,, Aung T,, Cheng CY. Global prevalence of glaucoma and projections of glaucoma burden through 2040: a systematic review and meta-analysis. Ophthalmology. 2014; 121: 2081–2090. [DOI] [PubMed] [Google Scholar]
- 3. Leske MC. The epidemiology of open-angle glaucoma: a review. Am J Epidemiol. 1983; 118: 166–191. [DOI] [PubMed] [Google Scholar]
- 4. Schwartz JT,, Reuling FH,, Feinleib M. Size of the physiologic cup of the optic nerve head. Hereditary and environmental factors. Arch Ophthalmol. 1975; 93: 776–778. [DOI] [PubMed] [Google Scholar]
- 5. Zangwill LM,, Weinreb RN,, Berry CC,, et al. Racial differences in optic disc topography: baseline results from the confocal scanning laser ophthalmoscopy ancillary study to the ocular hypertension treatment study. Arch Ophthalmol. 2004; 122: 22–28. [DOI] [PubMed] [Google Scholar]
- 6. Polaczek-Krupa B,, Grabska-Liberek I. Evaluation of the significance of some diagnostic parameters in making an early diagnose of primary open-angle glaucoma. Med Sci Monit. 2012; 18: CR456–CR460. [DOI] [PMC free article] [PubMed] [Google Scholar]
- 7. Jonas JB,, Bergua A,, Schmitz-Valckenberg P,, Papastathopoulos KI,, Budde WM. Ranking of optic disc variables for detection of glaucomatous optic nerve damage. Invest Ophthalmol Vis Sci. 2000; 41: 1764–1773. [PubMed] [Google Scholar]
- 8. Lichter PR. Variability of expert observers in evaluating the optic disc. Trans Am Ophthalmol Soc. 1976; 74: 532–572. [PMC free article] [PubMed] [Google Scholar]
- 9. Gaasterland DE,, Blackwell B,, Dally LG,, et al. The Advanced Glaucoma Intervention Study (AGIS): 10. Variability among academic glaucoma subspecialists in assessing optic disc notching. Trans Am Ophthalmol Soc. 2001; 99: 177–184; discussion 184–185. [PMC free article] [PubMed] [Google Scholar]
- 10. Sommer A,, Tielsch JM,, Katz J,, et al. Relationship between intraocular pressure and primary open angle glaucoma among white and black Americans. The Baltimore Eye Survey. Arch Ophthalmol. 1991; 109: 1090–1095. [DOI] [PubMed] [Google Scholar]
- 11. Springelkamp H,, Lee K,, Wolfs RC,, et al. Population-based evaluation of retinal nerve fiber layer, retinal ganglion cell layer, and inner plexiform layer as a diagnostic tool for glaucoma. Invest Ophthalmol Vis Sci. 2014; 55: 8428–8438. [DOI] [PMC free article] [PubMed] [Google Scholar]
- 12. Medeiros FA,, Zangwill LM,, Bowd C,, Vessani RM,, Susanna R,, Jr,, Weinreb RN. Evaluation of retinal nerve fiber layer optic nerve head, and macular thickness measurements for glaucoma detection using optical coherence tomography. Am J Ophthalmol. 2005; 139: 44–55. [DOI] [PubMed] [Google Scholar]
- 13. Lisboa R,, Leite MT,, Zangwill LM,, Tafreshi A,, Weinreb RN,, Medeiros FA. Diagnosing preperimetric glaucoma with spectral domain optical coherence tomography. Ophthalmology. 2012; 119: 2261–2269. [DOI] [PMC free article] [PubMed] [Google Scholar]
- 14. Mwanza JC,, Durbin MK,, Budenz DL,, et al. Glaucoma diagnostic accuracy of ganglion cell-inner plexiform layer thickness: comparison with nerve fiber layer and optic nerve head. Ophthalmology. 2012; 119: 1151–1158. [DOI] [PubMed] [Google Scholar]
- 15. Springelkamp H,, Mishra A,, Hysi PG,, et al. Meta-analysis of genome-wide association studies identifies novel loci associated with optic disc morphology. Genet Epidemiol. 2015; 39: 207–216. [DOI] [PMC free article] [PubMed] [Google Scholar]
- 16. Ramdas WD,, van Koolwijk LM,, Ikram MK,, et al. A genome-wide association study of optic disc parameters. PLoS Genet. 2010; 6: e1000978. [DOI] [PMC free article] [PubMed] [Google Scholar]
- 17. Gibson J,, Griffiths H,, De Salvo G,, et al. Genome-wide association study of primary open angle glaucoma risk and quantitative traits. Mol Vis. 2012; 18: 1083–1092. [PMC free article] [PubMed] [Google Scholar]
- 18. Sibony P,, Strachovsky M,, Honkanen R,, Kupersmith MJ. Optical coherence tomography shape analysis of the peripapillary retinal pigment epithelium layer in presumed optic nerve sheath meningiomas. J Neuroophthalmol. 2014; 34: 130–136. [DOI] [PubMed] [Google Scholar]
- 19. Sibony P,, Kupersmith MJ,, Rohlf FJ. Shape analysis of the peripapillary RPE layer in papilledema and ischemic optic neuropathy. Invest Ophthalmol Vis Sci. 2011; 52: 7987–7995. [DOI] [PMC free article] [PubMed] [Google Scholar]
- 20. Sanfilippo PG,, Cardini A,, Hewitt AW,, Crowston JG,, Mackey DA. Optic disc morphology—rethinking shape. Prog Retin Eye Res. 2009; 28: 227–248. [DOI] [PubMed] [Google Scholar]
- 21. Tang L,, Garvin MK,, Lee K,, Alward WL,, Kwon YH,, Abràmoff MD. Robust multiscale stereo matching from fundus images with radiometric differences. IEEE Trans Pattern Anal Mach Intell. 2011; 33: 2245–2258. [DOI] [PMC free article] [PubMed] [Google Scholar]
- 22. Tang L,, Scheetz TE,, Mackey DA,, et al. Automated quantification of inherited phenotypes from color images: a twin study of the variability of the optic nerve head shape. Invest Ophthalmol Vis Sci. 2010; 51: 5870–5877. [DOI] [PMC free article] [PubMed] [Google Scholar]
- 23. Christopher M,, Tang L,, Fingert JH,, Scheetz TE,, Abràmoff MD. Changes in quantitative 3D shape features of the optic nerve head associated with age. SPIE Med Imaging. 2013; 8670:86700O.
- 24. Christopher M,, Tang L,, Fingert JH,, Scheetz TE,, Abràmoff MD. Automated discovery of structural features of the optic nerve head on the basis of image and genetic data. SPIE Med Imaging. 2014; 9035:90350S.
- 25. Gordon MO,, Kass MA. The Ocular Hypertension Treatment Study: design and baseline description of the participants. Arch Ophthalmol. 1999; 117: 573–583. [DOI] [PubMed] [Google Scholar]
- 26. Kass MA,, Heuer DK,, Higginbotham EJ,, et al. The Ocular Hypertension Treatment Study: a randomized trial determines that topical ocular hypotensive medication delays or prevents the onset of primary open-angle glaucoma. Arch Ophthalmol. 2002; 120: 701–713. [DOI] [PubMed] [Google Scholar]
- 27. Feuer WJ,, Parrish RK,, Schiffman JC,, et al. The Ocular Hypertension Treatment Study: reproducibility of cup/disk ratio measurements over time at an optic disc reading center. Am J Ophthalmol. 2002; 133: 19–28. [DOI] [PubMed] [Google Scholar]
- 28. Niemeijer M,, Abràmoff MD,, van Ginneken B. Fast detection of the optic disc and fovea in color fundus photographs. Med Image Anal. 2009; 13: 859–870. [DOI] [PMC free article] [PubMed] [Google Scholar]
- 29. Tang L,, Scheetz TE,, Mackey DA,, et al. Automated quantification of inherited phenotypes from color images: a twin study of the variability of the optic nerve head shape. Invest Ophthalmol Vis Sci. 2010; 51: 5870–5877. [DOI] [PMC free article] [PubMed] [Google Scholar]
- 30. Martinez AM,, Kak AC. PCA versus LDA. IEEE Trans Pattern Anal Mach Intell. 2001; 23: 228–233. [Google Scholar]
- 31. Ocular Hypertension Treatment Study Group European Glaucoma Prevention Study Group, Gordon MO, et al. Validated prediction model for the development of primary open-angle glaucoma in individuals with ocular hypertension. Ophthalmology. 2007; 114: 10–19. [DOI] [PMC free article] [PubMed] [Google Scholar]
- 32. Ocular Hypertension Treatment Study Group, the European Glaucoma Prevention Study Group. The accuracy and clinical application of predictive models for primary open-angle glaucoma in ocular hypertensive individuals. Ophthalmology. 2008; 115: 2030–2036. [DOI] [PMC free article] [PubMed] [Google Scholar]
- 33. Takwoingi Y,, Botello AP,, Burr JM,, et al. External validation of the OHTS-EGPS model for predicting the 5-year risk of open-angle glaucoma in ocular hypertensives. Br J Ophthalmol. 2014; 98: 309–314. [DOI] [PubMed] [Google Scholar]
- 34. Sanfilippo PG,, Cardini A,, Sigal IA,, et al. A geometric morphometric assessment of the optic cup in glaucoma. Exp Eye Res. 2010; 91: 405–414. [DOI] [PubMed] [Google Scholar]
- 35. Garway-Heath DF,, Hitchings RA. Quantitative evaluation of the optic nerve head in early glaucoma. Br J Ophthalmol. 1998; 82: 352–361. [DOI] [PMC free article] [PubMed] [Google Scholar]
- 36. Jonas JB,, Fernandez MC,, Sturmer J. Pattern of glaucomatous neuroretinal rim loss. Ophthalmology. 1993; 100: 63–68. [DOI] [PubMed] [Google Scholar]
- 37. Strouthidis NG,, Gardiner SK,, Sinapis C,, Burgoyne CF,, Garway-Heath DF. The spatial pattern of neuroretinal rim loss in ocular hypertension. Invest Ophthalmol Vis Sci. 2009; 50: 3737–3742. [DOI] [PubMed] [Google Scholar]
- 38. Charlesworth J,, Kramer PL,, Dyer T,, et al. The path to open-angle glaucoma gene discovery: endophenotypic status of intraocular pressure, cup-to-disc ratio, and central corneal thickness. Invest Ophthalmol Vis Sci. 2010; 51: 3509–3514. [DOI] [PMC free article] [PubMed] [Google Scholar]
- 39. Dimasi DP,, Burdon KP,, Hewitt AW,, et al. Genetic investigation into the endophenotypic status of central corneal thickness and optic disc parameters in relation to open-angle glaucoma. Am J Ophthalmol. 2012; 154: 833–842.e2. [DOI] [PubMed] [Google Scholar]
- 40. Fingert JH. Primary open-angle glaucoma genes. Eye (Lond). 2011; 25: 587–595. [DOI] [PMC free article] [PubMed] [Google Scholar]
- 41. Stone EM,, Fingert JH,, Alward WL,, et al. Identification of a gene that causes primary open angle glaucoma. Science. 1997; 275: 668–670. [DOI] [PubMed] [Google Scholar]
- 42. Rezaie T,, Child A,, Hitchings R,, et al. Adult-onset primary open-angle glaucoma caused by mutations in optineurin. Science. 2002; 295: 1077–1079. [DOI] [PubMed] [Google Scholar]
- 43. Fingert JH,, Robin AL,, Stone JL,, et al. Copy number variations on chromosome 12q14 in patients with normal tension glaucoma. Hum Mol Genet. 2011; 20: 2482–2494. [DOI] [PMC free article] [PubMed] [Google Scholar]
- 44. Takamoto M,, Araie M. Genetics of primary open angle glaucoma. Jpn J Ophthalmol. 2014; 58: 1–15. [DOI] [PubMed] [Google Scholar]
- 45. Gemenetzi M,, Yang Y,, Lotery AJ. Current concepts on primary open-angle glaucoma genetics: a contribution to disease pathophysiology and future treatment. Eye (Lond). 2012; 26: 355–369. [DOI] [PMC free article] [PubMed] [Google Scholar]
- 46. Wiggs JL,, Kang JH,, Yaspan BL,, et al. Common variants near CAV1 and CAV2 are associated with primary open-angle glaucoma in Caucasians from the USA. Hum Mol Genet. 2011; 20: 4707–4713. [DOI] [PMC free article] [PubMed] [Google Scholar]
- 47. Burdon KP,, Macgregor S,, Hewitt AW,, et al. Genome-wide association study identifies susceptibility loci for open angle glaucoma at TMCO1 and CDKN2B-AS1. Nature Genet. 2011; 43: 574–578. [DOI] [PubMed] [Google Scholar]
- 48. Ramdas WD,, van Koolwijk LM,, Lemij HG,, et al. Common genetic variants associated with open-angle glaucoma. Hum Mol Genet. 2011; 20: 2464–2471. [DOI] [PubMed] [Google Scholar]
- 49. Leboyer M,, Bellivier F,, Nosten-Bertrand M,, Jouvent R,, Pauls D,, Mallet J. Psychiatric genetics: search for phenotypes. Trends Neurosci. 1998; 21: 102–105. [DOI] [PubMed] [Google Scholar]
- 50. Springelkamp H,, Hohn R,, Mishra A,, et al. Meta-analysis of genome-wide association studies identifies novel loci that influence cupping and the glaucomatous process. Nat Commun. 2014; 5: 4883. [DOI] [PMC free article] [PubMed] [Google Scholar]
- 51. Cornes BK,, Khor CC,, Nongpiur ME,, et al. Identification of four novel variants that influence central corneal thickness in multi-ethnic Asian populations. Hum Mol Genet. 2012; 21: 437–445. [DOI] [PubMed] [Google Scholar]
- 52. Macgregor S,, Hewitt AW,, Hysi PG,, et al. Genome-wide association identifies ATOH7 as a major gene determining human optic disc size. Hum Mol Genet. 2010; 19: 2716–2724. [DOI] [PMC free article] [PubMed] [Google Scholar]
- 53. van Koolwijk LM,, Ramdas WD,, Ikram MK,, et al. Common genetic determinants of intraocular pressure and primary open-angle glaucoma. PLoS Genet. 2012; 8: e1002611. [DOI] [PMC free article] [PubMed] [Google Scholar]
- 54. Khor CC,, Ramdas WD,, Vithana EN,, et al. Genome-wide association studies in Asians confirm the involvement of ATOH7 and TGFBR3, and further identify CARD10 as a novel locus influencing optic disc area. Hum Mol Genet. 2011; 20: 1864–1872. [DOI] [PubMed] [Google Scholar]


