

Abstract
Annexin A2 is a calcium-dependent phospholipid-binding protein, involved in invasion, angiogenesis and migration in cancer cells. The aims of the present study were to evaluate the expression levels of annexin A2 and E-cadherin in gastric adenocarcinoma (GAC), and to investigate the association between the expression of annexin A2 and that of E-cadherin and Ki67, in addition to various clinicopathological factors. This study included 126 patients that were histopathologically diagnosed with GAC. Tissue samples were acquired by surgical resection, and annexin A2 mRNA expression levels were determined using reverse transcription-quantitative polymerase chain reaction. Annexin A2, E-cadherin and Ki67 protein expression levels were detected using western blot analysis and/or immunohistochemical staining. The expression of annexin A2 mRNA and protein was significantly upregulated in the GAC tissues. Annexin A2 expression was detected in 52/126 cases (41.3%) of gastric cancer (GC), and correlations were identified between annexin A2 expression and Tumor, Node, Metastasis (TNM) stage (P=0.002), lymph node metastasis (P=0.016) and distal metastasis (P=0.005). The positive expression rates of E-cadherin and Ki67 in the tumor tissue of patients with GAC were 27.8% (35/126) and 56.2% (71/126), respectively. A negative correlation was observed between the expression of annexin A2 and E-cadherin (P<0.001). No significant association was detected between the expression levels of annexin A2 and Ki67 (P=0.801). In conclusion, upregulated annexin A2 expression was associated with lymph node metastasis, distal metastasis, advanced TNM stage and E-cadherin expression in patients with GAC. The association between the expression of annexin A2 and that of E-cadherin may indicate an underlying mechanism by which annexin A2 contributes to the metastasis in GC, and thus annexin A2 may represent a potential target for the treatment of GAC.
Keywords: annexin A2, gastric adenocarcinoma, metastasis, E-cadherin
Introduction
Gastric cancer (GC) is the second most common cause of cancer-associated mortality worldwide (1), particularly in developing countries. The diagnosis and treatment of GC has improved; however, the 5-year overall survival rate of patients with GC remains poor (2). Recurrence remains the primary obstacle to the treatment and prognosis of this condition. Tumorigenesis is usually accompanied by the abnormal expression of genes. Therefore, it is crucial to identify effective diagnostic biomarkers and therapeutic targets for GC.
Annexin A2 is a 34–36 kDa protein that belongs to a family of calcium-dependent, phospholipid-binding proteins. Annexin A2 is involved in various biological functions that depend on its intracellular localization, including cell proliferation, apoptosis, cell migration, invasion, angiogenesis and cell-cell adhesion (3–5). In addition, annexin A2 functions as a potential candidate receptor for the tissue-type plasminogen activator and tenascin C on the tumor cell surface (6).
Numerous studies have confirmed that annexin A2 exhibits varying expression patterns in different tumor types. For example, studies have demonstrated that annexin A2 is upregulated in GC (7), pancreatic cancer (8), colorectal cancer (9) and brain cancer (3), and downregulated in oral squamous cell carcinoma (10), intestinal-type sinonasal adenocarcinoma (11) and prostate cancer (12). To date, the exact function served by annexin A2 in the development, metastasis and progression of GC remains unclear.
E-cadherin and Ki67 are key diagnostic and prognostic markers of GC (13,14). The aim of the present study was to evaluate the expression of annexin A2, E-cadherin and Ki67 in gastric adenocarcinoma (GAC), to investigate a possible correlation between annexin A2, E-cadherin and Ki67 expression, and to further elucidate the clinical significance of annexin A2 in the metastasis of GC.
Materials and methods
Clinical GC samples
GC tissues and paired adjacent normal tissues were collected from patients with primary GAC who underwent curative surgical resection between 2008 and 2010 at the Second Affiliated Hospital of Zhejiang University School of Medicine (Zhejiang, China). The diagnosis of each case was confirmed independently by two pathologists. Tumors were staged using the Union Internationale Contre le Cancer (UICC) staging system (15). Clinicopathological features including age, gender, differentiation degree, lymph node metastasis, distal metastasis, venous invasion and Tumor, Node, Metastasis (TNM) stage are detailed in Table I.
Table I.
Association of annexin A2 expression and clinicopathological features in patients with gastric adenocarcinoma.
| Annexin A2 expression | |||||
|---|---|---|---|---|---|
| Characteristic | Cases (n=126) | Positive (n=52) | Negative (n=74) | χ2 | P-value |
| Age (years) | 1.262 | 0.174 | |||
| >60 | 75 | 34 | 41 | ||
| ≤60 | 51 | 18 | 33 | ||
| Gender | 0.473 | 0.31 | |||
| Male | 70 | 27 | 43 | ||
| Female | 56 | 25 | 31 | ||
| Differentiation | 0.384 | 0.331 | |||
| High + moderate | 71 | 31 | 40 | ||
| Poor | 55 | 21 | 34 | ||
| TNM stage | 9.496 | 0.002a | |||
| I + II | 69 | 20 | 49 | ||
| III + IV | 57 | 32 | 25 | ||
| Venous invasion | 1.443 | 0.154 | |||
| Absent | 54 | 19 | 35 | ||
| Present | 72 | 33 | 39 | ||
| Lymph-node metastasis | 5.387 | 0.016a | |||
| Negative | 64 | 20 | 44 | ||
| Positive | 62 | 32 | 30 | ||
| Distal metastasis | 7.860 | 0.005a | |||
| Negative | 82 | 17 | 65 | ||
| Positive | 44 | 35 | 9 | ||
P<0.05. TNM, Tumor, Node, Metastasis.
This study received approval from the ethics committee of Zhejiang University (Zhejiang, China). All patients with GAC provided written informed consent for the use of clinical specimens in medical research prior to participating.
RNA extraction and reverse transcription-quantitative polymerase chain reaction (RT-qPCR) analysis
The total RNA from tissues was extracted using TRIzol reagent (Invitrogen Life Technologies, Carlsbad, CA, USA) in accordance with the manufacturer's instructions. The quantity and the quality of RNA were evaluated using a NanoDrop 1000 spectrophotometer (Thermo Fisher Scientific, Waltham, MA, USA). RNA was reverse-transcribed into cDNA using a Reverse Transcriptase M-MLV kit (Promega Corporation, Madison, WI, USA). The expression of annexin A2 was evaluated using an ABI PRISM 7700 Sequence Detection System (Applied Biosystems Life Technologies, Beijing, China). PCR amplifications were performed in a total volume of 50 µl, consisting of 2 µl template cDNA and 48 µl PCR master mix containing dNTP mixture, forward and reverse primers, Taq DNA polymerase and reaction buffer (SYBR Green I Master Mix; Invitrogen Life Technologies). The annexin A2 sense primer sequence was 5′-GAT TAG AAT CAT GGT CTC TCG-3′ and the antisense primer sequence was 5′-TTA GTG GAG AGC GAA GTC TC-3′ (16). For the GAPDH gene, the sense primer was 5′-TGA ACG GGA AGC TCA CTG G-3′ and the antisense primer was 5′-TCC ACC ACC CTG TTG CTG TA-3′ (17).
PCR cycling conditions were as follows: 5 min at 95°C initial denaturation, followed by 25 cycles of denaturation at 95°C for 30 sec, combined annealing at 55°C for 30 sec and primer extension at 72°C for 30 sec. Each sample was run in triplicate and the gene expression levels were normalized against the level of GAPDH. Gene expression levels were described as the ratio between two absolute measurements (gene of interest/endogenous reference gene) (18).
Western blot analysis
Fresh cancer tissue samples were frozen in RIPA lysis buffer (Sigma-Aldrich, St. Louis, MO, USA) according to the manufacturer's instructions. Denatured protein was separated on sodium dodecyl sulfate (SDS)-polyacrylamide gel (10% acrylamide) and transferred to polyvinylidene fluoride membranes (Bio-Rad Laboratories, Inc., Hercules, CA, USA). After blocking with 5% fat-free milk in Tris-buffered saline (pH 7.5) for 60 min, the membrane was incubated with a monoclonal primary anti-human annexin A2 antibody (sc-28385; 1:500; Santa Cruz Biotechnology, Inc., Dallas, TX, USA) overnight at 4°C. After incubation with primary anti-human annexin A2 antibody, respective horseradish peroxidase-conjugated secondary antibodies were added. Bands were subsequently visualized using a chemiluminescence detection system (EMD Millipore, Billerica, MA, USA) and density was determined using an image analyzer. Human β-actin (KangChen Bio-tech Inc., Shanghai, China) was used as an internal reference at a dilution of 1:500.
Immunohistochemistry (IHC) assay
The paraffin-embedded tissues fixed in 10% (v/v) neutral buffered formalin were cut into 5-µm sections. Tissue sections were deparaffinized in xylene and rehydrated in a graded series of ethanol. Endogenous peroxidase activity was blocked with 0.3% hydrogen peroxide in methanol for 60 min. Following heat-induced epitope retrieval at 37°C for 30 min, the tissue sections were incubated with a monoclonal anti-human annexin A2 antibody (1:500, Santa Cruz Biotechnology, Inc.), mouse monoclonal antibodies against Ki67 (1:50; Dako Denmark A/S, Glostrup, Denmark) and E-cadherin (1:100; Cell Signaling Technology Inc., Danvers, MA, USA). After washing with phosphate-buffered saline, sections were incubated with secondary antibodies for 20–30 min at room temperature. Then, the sections were washed thoroughly in distilled water, counterstained with hematoxylin and mounted on glass slides. 3,3′-Diaminobenzidine (Dako Denmark A/S) was used as the chromogen. Negative controls used mouse IgG instead of primary antibody. The degree of immunostaining was scored independently by two pathologists blinded to the patients' information with the resolution of disagreements by consensus.
Immunohistochemical evaluation
For the scoring of annexin A2 and Ki67 protein expression levels, the extent and intensity of positive staining were considered. The extent of positivity was scored according to the percentage of cells showing positive staining, as follows: 0, <5% positive; 1, 5–25% positive; 2, 26–50% positive; and 3, >50% positive. Staining intensity was scored as follows: 0 (−, no staining); 1 (+, weak staining); 2 (++, moderate staining); and 3 (+++, strong staining). The final staining scores of annexin A2 and Ki67 were analyzed by multiplying the extent of positivity score and the staining intensity score, yielding a total score ranging between 0 and 9 (19). Optimal cut-off values were identified as follows: For annexin A2, a staining index score of ≥2 defined a tumor as annexin A2 positive, and a staining index score of <2 defined a tumor as annexin A2 negative. For Ki67, a tumor with a score ≥4 was designated Ki67 positive, and a tumor with a score of <4 was designated Ki67 negative.
For scoring E-cadherin protein expression, the intensity of positive staining was considered. The intensity of E-cadherin staining was subdivided into four categories: 0 (-), no positive cells; 1 (+), <25%; 2 (++), 25–50%; and 3 (+++), >50% positive cells. Only tumors scored as >1 were classified as positive for the expression of the protein, otherwise they were considered to be negative for E-cadherin expression (20).
Statistical analysis
Data are presented as the mean ± standard error of the mean. The statistical analysis was performed using SPSS software, version 16.0 (SPSS, Inc., Chicago, IL, USA. The paired t-test was used to determine the correlation between the quantity of annexin A2 mRNA expression in cancer and matched non-cancerous tissues. The χ2 test, Fisher's exact tests and Spearman's correlation analysis were used to determine correlations between annexin A2, E-cadherin and Ki67 expression levels and various clinicopathological factors. P<0.05 was considered to indicate a statistically significant difference.
Results
Annexin A2 mRNA and protein expression levels in GAC tissue
The mRNA and protein expression levels of annexin A2 in cancer tissues and paired non-cancerous tissues obtained from 96 patients with GAC were quantified using RT-qPCR. The annexin A2 protein expression levels in cancer tissues and paired non-cancerous tissues obtained from 16 patients with GAC were determined using western blot analysis. The expression of annexin A2 mRNA in the GAC tissues was significantly higher compared with that in the paired non-cancerous tissues (1.27±0.094 vs. 0.77±0.062; P<0.001; Fig. 1A), and annexin A2 protein expression levels were higher in the tumor tissues than in the non-cancerous tissues (Fig. 1B).
Figure 1.
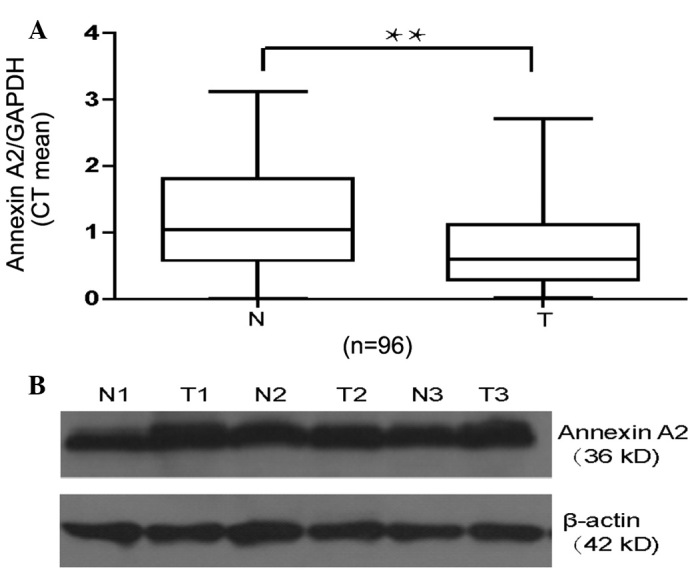
Alterations in annexin A2 mRNA and protein expression profiles between gastric cancer tissues and paired non-cancerous tissues. (A) Expression of annexin A2 mRNA in fresh gastric adenocarcinoma tissues (T) and matched normal tissues (N) from 96 patients was detected using reverse transcription-quantitative polymerase chain reaction. Annexin A2 expression levels were normalized against those of GAPDH and expressed in terms of the threshold cycle (CT) ratio. Error bars represent the mean ± standard error of the mean (**P<0.001). (B) Expression of Annexin A2 in gastric cancer tissues (N) and matched non-cancerous tissues (T) from 16 patients was detected by western blot analysis. β-actin protein levels served as an internal control.
Correlation between annexin A2 expression and clinicopathological factors in patients with GAC
In order to elucidate the clinical significance of annexin A2 in the development of GAC, the association between annexin A2 protein expression and various clinicopathological factors was evaluated. Annexin A2 expression was assayed using IHC in tissue samples from 126 patients with GAC. Annexin A2 immunoreactivity was detected in 41.3% (52/126) patients with GAC. Furthermore, annexin A2 was observed to be predominantly localized in the cell membrane of primary cancer cells, while cytoplasm staining was also detected in certain samples (Fig. 2). The expression of annexin A2 protein was found to be significantly associated with TNM stage (P=0.002), lymph node metastasis (P=0.016) and distal metastasis (P=0.005), but did not correlate with age, gender, venous invasion and differentiation (P>0.05; Table I).
Figure 2.
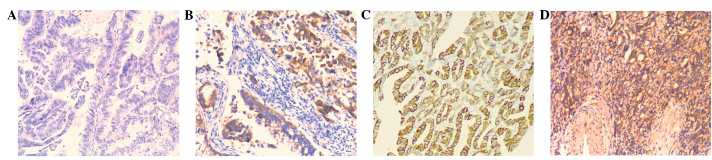
Immunohistochemical analysis of annexin A2 expression in gastric adenocarcinomas (magnification, x100). (A and B) Negative expression of annexin A2 in tumor tissues. (C and D) Positive expression of annexin A2 in tumor tissues.
Association between the expression levels of annexin A2, E-cadherin and Ki67
In order to investigate the mechanism underlying the function of annexin A2 in the development and progression of GAC, the association between the positive rates of annexin A2, E-cadherin and Ki67 expression was investigated in GAC tissue samples from 126 patients. In the IHC analysis, the staining intensity and the extent of immunoreactive cells were observed to vary among the studied cases. The positive expression rates of E-cadherin and Ki67 in the tumor tissue samples of patients with GAC were 27.8% (35/126) and 56.2% (71/126), respectively. Ki67 expression was located in the nuclei of the GC cells (Fig. 3) whereas E-cadherin immunohistochemical staining was located at the cell membrane (Fig. 4). A negative correlation was observed between the expression of annexin A2 and that of E-cadherin (r=-0.268, P=0.002; Table II). No association was detected between the expression of annexin II and that of Ki67 (r=0.023, P=0.801; Table III). These results indicate that annexin A2 may be involved in the metastasis of GAC, as a negative correlation was observed between the expression of annexin A2 and that of E-cadherin (r=0.268 and P=0.002; Table II)
Figure 3.
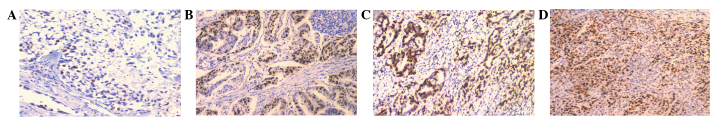
Immunohistochemical analysis of Ki67 expression in gastric adenocarcinomas (magnification, x100). (A and B) Negative expression of Ki67 in tumor tissues. (C and D) Positive expression of Ki67 in tumor tissues.
Figure 4.
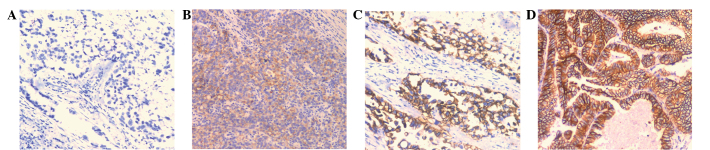
Immunohistochemical analysis of E-cadherin expression in gastric adenocarcinomas (magnification, x100). (A) Negative staining of E-cadherin in tumor tissues. (B) Mild positive reactions in cellular membrane of carcinomatous tissues, score 1+. (C) Moderate membrane staining, score 2+. (D) Strong membrane staining, score 3+.
Table II.
Correlation between the expression of annexin A2 and E-cadherin.
| E-cadherin expression | ||||
|---|---|---|---|---|
| Annexin A2 | Positive (n=35) | Negative (n=91) | R-value | P-value |
| Positive (n=52) | 7 | 45 | −0.268 | 0.002 |
| Negative (n=74) | 28 | 46 | ||
Table III.
Correlation between the expression of annexin A2 and Ki67.
| Ki67 expression | ||||
|---|---|---|---|---|
| Annexin A2 | Positive (n=71) | Negative (n=55) | R-value | P-value |
| Positive (n=52) | 30 | 22 | 0.023 | 0.801 |
| Negative (n=74) | 41 | 33 | ||
Discussion
Annexin A2 is a multifunctional protein, implicated in several membrane-associated processes including fibrinolysis, exocytosis and endocytosis, cell-cell adhesion and membrane-cytoskeletal interaction (21). In the present study, GAC tissues exhibited >1.5-fold increased expression of annexin A2 mRNA and elevated annexin A2 protein expression compared with that in paired non-cancerous tissues. The upregulation of annexin A2 was significantly associated with TNM stage, lymph node metastasis and distant metastasis in patients with GAC, suggesting that annexin A2 serves a crucial function in the metastasis and progression of GAC. Notably, no association was detected between the expression of annexin A2 and the differentiation, venous invasion and Ki67 expression in GAC tissue, indicating an independent mechanism underlying the role of annexin A2 in the development of GAC. These results are consistent with a previous study by Zhang et al (19), which demonstrated that GC tissues present increased expression of annexin A2. In addition, the previous study observed that the expression of annexin A2 correlated with age, tumor location, tumor size, differentiation, histological type, depth of invasion, vessel invasion, lymph node metastasis, distant metastasis and TNM stage, poor outcome and with the expression of S100A6. Annexin A2 heterotetramer functions as a high-affinity receptor/binding protein for multiple extracellular ligands that have been implicated in cancer development, invasion and metastases. These ligands include cathepsin B, plasminogen, the tissue-type plasminogen activator, tenascin-C and collagen. Cathepsin B is upregulated in a variety of tumors, particularly at the invasive edges, and is able to degrade extracellular matrix (ECM) proteins and activate the precursor form of the urokinase plasminogen activator, thereby initiating an extracellular proteolytic cascade (22,23). Annexin A2-mediated protease activation in cancer progression may contribute to tumor detachment, invasiveness and metastasis.
The role of annexin A2 may depend on the cellular and genetic context. In the present study, the expression of annexin A2 was observed to be associated with lymph node metastasis, distal metastasis and E-cadherin expression in GAC tissues. Metastasis accounts for the majority of GC-associated mortality. A number of studies have associated epithelial-to-mesenchymal transition (EMT) with cancer progression and metastasis in patients with GC. E-cadherin is a calcium-dependent cell adhesion molecule that is the primary constituent of the epithelial cell junction system and a key factor involved in EMT (14,20,24). As a result of the downregulation of E-cadherin expression, the cell adhesion among tumor cells in the primary tumor is weakened, and thus tumor cell invasion and metastasis occurs more readily. In addition to supporting cell-cell adhesion, E-cadherin is able to affect a wide range of cellular functions, including activation of cell signal pathways, regulation of the cytoskeleton and control of cell polarity. Previous studies have demonstrated that E-cadherin expression is associated with metastasis and poor prognosis in patients with GC (14). Therefore, we hypothesize that the association between annexin A2 expression and E-cadherin may be among the mechanisms by which annexin A2 contributes to the metastasis of GC.
Expression levels of annexin A2 have been investigated in a variety of human malignancies (25). In human breast cancer tissue, annexin A2 appears to be associated with the invasiveness of malignant cells and neoangiogenic activity (26). Proteomic profiling of colorectal cancer revealed higher expression of annexin A2 in tumors that had progressed to lymph node metastases compared with localized tumors (27). The upregulation of annexin A2 expression in pancreatic, colorectal and brain tumors was directly correlated with advanced clinical stage (8). Zheng et al (4) observed that cell surface-localized annexin A2 is increased in pancreatic ductal adenocarcinoma (PDA), whereas normal pancreatic ductal epithelial cells exhibit weak IHC staining. Furthermore, the authors found that Annexin A2 is predominantly localized at the cell membrane in PDA cell lines with high invasive capacity, whereas annexin A2 is present predominantly in the cytoplasm of cell lines with low invasive capacity. The study demonstrated that the Tyr23 phosphorylation of annexin A2 promotes the EMT of PDA cells and is a possible mechanism by which annexin A2 localizes to the PDA cell membrane and promotes the invasiveness and metastasis of PDA (4).
There may be other mechanisms involved in the role of annexin A2 in the development of GC. Annexin A2 may also function as an alarm in the immune system (28). Annexin A2 activates macrophages, stimulating MAPK and NF-κB signaling pathways and inducing the production of key cytokines involved in the establishment of inflammation, such as TNF-α, IL-1β and IL-6. These cytokines are highly expressed in association with the development of gastric dysplasia and the metastasis of GC.
The co-localization of annexin A2 with its binding proteins, including t-PA, S100A10, tenascin C and cathepsin B, facilitates the proteolytic cascade leading to the activation of pro-enzymes and the selective degradation of ECM components which regulate cancer cell properties and enhance metastasis. A previous study indicated that S100A10 serves a crucial function in tumor growth, angiogenesis, invasion and metastasis (29). Another study observed that when stimulated with plasmin, the serine phosphorylation of annexin A2 increases significantly, triggering the dissociation of the (A2/p11)2 tetramer. Simultaneously, tyrosine phosphorylation of annexin A2, which is required for its translocation to the cell surface, is markedly reduced. The resulting free p11 undergoes ubiquitin-mediated proteasomal degradation (30). Cancer cells utilize plasmin and other proteases, such as cathepsin B and matrix metalloproteases, to proteolyze the ECM and basement membrane in order to metastasize to the circulation. Tumor-associated cells, such as macrophages, also require proteolytic activity in order to migrate from the circulation into the tumor stroma. Therefore, proteolytic activity is used by cancer cells and cancer-associated cells during oncogenesis and metastasis (29).
In conclusion, upregulated annexin A2 expression was observed to be associated with lymph node metastasis, distal metastasis and advanced TNM stage in GAC tissue samples. The interaction between annexin A2 and E-cadherin may be among the mechanisms by which annexin A2 contributes to the metastasis of GC.
Acknowledgements
This study was supported by grants from Science and Technology Project of the Health Department of Zhejiang Province (no. 2008A092) and Zhejiang Provincial Natural Science Foundation of China (nos. LQ12H16009 and Y2110299).
References
- 1.Jemal A, Bray F, Center MM, Ferlay J, Ward E, Forman D. Global cancer statistics. CA Cancer J Clin. 2011;61:69. doi: 10.3322/caac.20107. [DOI] [PubMed] [Google Scholar]
- 2.Zhang YZ, Zhang LH, Gao Y, Li CH, Jia SQ, Liu N, Cheng F, Niu DY, Cho WC, Ji JF, Zeng CQ. Discovery and validation of prognostic markers in gastric cancer by genome-wide expression profiling. World J Gastroenterol. 2010;17:1710–1717. doi: 10.3748/wjg.v17.i13.1710. [DOI] [PMC free article] [PubMed] [Google Scholar]
- 3.Zhai H, Acharya S, Gravanis I, Mehmood S, Seidman RJ, Shroyer KR, Hajjar KA, Tsirka SE. Annexin A2 promotes glioma cell invasion and tumor progression. J Neurosci. 2011;31:14346–14360. doi: 10.1523/JNEUROSCI.3299-11.2011. [DOI] [PMC free article] [PubMed] [Google Scholar]
- 4.Zheng L, Foley K, Huang L, Leubner A, Mo G, Olino K, Edil BH, Mizuma M, Sharma R, Le DT, et al. Tyrosine 23 phosphorylation-dependent cell-surface localization of annexin A2 is required for invasion and metastases of pancreatic cancer. PLoS One. 2011;6:e19390. doi: 10.1371/journal.pone.0019390. [DOI] [PMC free article] [PubMed] [Google Scholar]
- 5.Zhang X, Liu S, Guo C, Zong J, Sun MZ. The association of annexin A2 and cancers. Clin Transl Oncol. 2012;14:634–640. doi: 10.1007/s12094-012-0855-6. [DOI] [PubMed] [Google Scholar]
- 6.Jacomo RH, Santana-Lemos BA, Lima AS, Assis PA, Lange AP, Figueiredo-Pontes LL, Oliveira LO, Bassi SC, Benício MT, Baggio MS, et al. Methionine-induced hyperhomocysteinemia reverts fibrinolytic pathway activation in a murine model of acute promyelocytic leukemia. Blood. 2012;120:207–213. doi: 10.1182/blood-2011-04-347187. [DOI] [PubMed] [Google Scholar]
- 7.Leal MF, Calcagno DQ, Chung J, de Freitas VM, Demachki S, Assumpção PP, Chammas R, Burbano RR, Smith MC. Deregulated expression of annexin-A2 and galectin-3 is associated with metastasis in gastric cancer patients. Clin Exp Med. 2014 Jul 18; doi: 10.1007/s10238-014-0299-0. (Epub ahead of print) [DOI] [PubMed] [Google Scholar]
- 8.Deng S, Wang J, Hou L, Hou L, Li J, Chen G, Jing B, Zhang X, Yang Z. Annexin A1, A2, A4 and A5 play important roles in breast cancer, pancreatic cancer and laryngeal carcinoma, alone and/or synergistically. Oncol Lett. 2013;5:107. doi: 10.3892/ol.2012.959. [DOI] [PMC free article] [PubMed] [Google Scholar]
- 9.Yang T, Peng H, Wang J, Yang J, Nice EC, Xie K, Huang C. Prognostic and diagnostic significance of annexin A2 in colorectal cancer. Colorectal Dis. 2013;15:e373–e381. doi: 10.1111/codi.12207. [DOI] [PubMed] [Google Scholar]
- 10.Rodrigo JP, Lequerica-Fernandez P, Rosado P, Rosado P, Allonca E, García-Pedrero JM, de Vicente JC. Clinical significance of annexin A2 downregulation in oral squamous cell carcinoma. Head Neck. 2011;33:1708–1714. doi: 10.1002/hed.21661. [DOI] [PubMed] [Google Scholar]
- 11.Rodrigo JP, Garcia-Pedrero JM, Llorente JL, Fresno MF, Allonca E, Suarez C, Hermsen M. Down-regulation of annexin A1 and A2 protein expression in intestinal-type sinonasal adenocarcinomas. Hum Pathol. 2011;42:88–94. doi: 10.1016/j.humpath.2010.05.017. [DOI] [PubMed] [Google Scholar]
- 12.Yee DS, Narula N, Ramzy I, Boker J, Ahlering TE, Skarecky DW, Ornstein DK. Reduced annexin II protein expression in high-grade prostatic intraepithelial neoplasia and prostate cancer. Arch Pathol Lab Med. 2007;131:902–908. doi: 10.5858/2007-131-902-RAIPEI. [DOI] [PubMed] [Google Scholar]
- 13.Wu A, Jia Y, Dong B, Tang L, Liu Y, Du H, Yuan P, Dong P, Ji J. Apoptosis and KI67 index correlate with preoperative chemotherapy efficacy and better predict the survival of gastric cancer patients with combined therapy. Cancer Chemother Pharmacol. 2014;73:885–893. doi: 10.1007/s00280-014-2410-3. [DOI] [PubMed] [Google Scholar]
- 14.Zhong XY, Zhang LH, Jia SQ, Shi T, Niu ZJ, Du H, Zhang GG, Hu Y, Lu AP, Li JY, et al. Positive association of up-regulated Cripto-1 and down-regulated E-cadherin with tumour progression and poor prognosis in gastric cancer. Histopathology. 2008;52:560–568. doi: 10.1111/j.1365-2559.2008.02971.x. [DOI] [PubMed] [Google Scholar]
- 15.Ahn HS, Kim SH, Kodera Y, Yang HK. Gastric cancer staging with radiologic imaging modalities and UICC staging system. Dig Surg. 2013;30:142–149. doi: 10.1159/000350881. [DOI] [PubMed] [Google Scholar]
- 16.Seidah NG, Poirier S, Denis M, et al. Annexin A2 is a natural extrahepatic inhibitor of the PCSK9-induced LDL receptor degradation. PLoS One. 2012;7:e41865. doi: 10.1371/journal.pone.0041865. [DOI] [PMC free article] [PubMed] [Google Scholar]
- 17.Qiu MZ, Li ZH, Zhou ZW, Parker R, Miao B, Mapelli C, Prat A, Wassef H, Davignon J, Hajjar KA, et al. Detection of carcinoembryonic antigen messenger RNA in blood using quantitative real-time reverse transcriptase-polymerase chain reaction to predict recurrence of gastric adenocarcinoma. J Transl Med. 2010;8:107. doi: 10.1186/1479-5876-8-107. [DOI] [PMC free article] [PubMed] [Google Scholar]
- 18.Hoffmann AC, Goekkurt E, Danenberg PV, Lehmann S, Ehninger G, Aust DE, Stoehlmacher-Williams J. EGFR, FLT1 and heparanase as markers identifying patients at risk of short survival in cholangiocarcinoma. PLoS One. 2013;8:e64186. doi: 10.1371/journal.pone.0064186. [DOI] [PMC free article] [PubMed] [Google Scholar]
- 19.Zhang Q, Ye Z, Yang Q, et al. Upregulated expression of annexin II is a prognostic marker for patients with gastric cancer. World J Surg Oncol. 2012;10:103. doi: 10.1186/1477-7819-10-103. [DOI] [PMC free article] [PubMed] [Google Scholar]
- 20.Yu XW, Xu Q, Xu Y, He X, Wang H, Zhao Z. Expression of the E-cadherin/beta-catenin/tcf-4 pathway in gastric diseases with relation to Helicobacter pylori infection: Clinical and pathological implications. Asian Pac J Cancer Prev. 2014;15:215–220. doi: 10.7314/APJCP.2014.15.1.215. [DOI] [PubMed] [Google Scholar]
- 21.Rescher U, Gerke V. Annexins - unique membrane binding proteins with diverse functions. J Cell Sci. 2004;117:2631–2639. doi: 10.1242/jcs.01245. [DOI] [PubMed] [Google Scholar]
- 22.Mai J, Waisman DM, Sloane BF. Cell surface complex of cathepsin B/annexin II tetramer in malignant progression. Biochim Biophys Acta. 2000;1477:215–230. doi: 10.1016/S0167-4838(99)00274-5. [DOI] [PubMed] [Google Scholar]
- 23.Sharma MC, Sharma M. The role of annexin II in angiogenesis and tumor progression: A potential therapeutic target. Curr Pharm Des. 2007;13:3568–3575. doi: 10.2174/138161207782794167. [DOI] [PubMed] [Google Scholar]
- 24.Gao M, Li W, Wang H, Wang G. The distinct expression patterns of claudin-10, -14, -17 and E-cadherin between adjacent non-neoplastic tissues and gastric cancer tissues. Diagn Pathol. 2013;8:205. doi: 10.1186/1746-1596-8-205. [DOI] [PMC free article] [PubMed] [Google Scholar]
- 25.Luo CH, Liu QQ, Zhang PF, Li MY, Chen ZC, Liu YF. Prognostic significance of annexin II expression in non-small cell lung cancer. Clin Transl Oncol. 2013;15:938–946. doi: 10.1007/s12094-013-1028-y. [DOI] [PubMed] [Google Scholar]
- 26.Deng S, Jing B, Xing T, Hou L, Yang Z. Overexpression of annexin A2 is associated with abnormal ubiquitination in breast cancer. Genomics Proteomics Bioinformatics. 2012;10:153–157. doi: 10.1016/j.gpb.2011.12.001. [DOI] [PMC free article] [PubMed] [Google Scholar]
- 27.Duncan R, Carpenter B, Main LC, Telfer C, Murray GI. Characterisation and protein expression profiling of annexins in colorectal cancer. Br J Cancer. 2008;98:426. doi: 10.1038/sj.bjc.6604128. [DOI] [PMC free article] [PubMed] [Google Scholar]
- 28.Swisher JF, Khatri U, Feldman GM. Annexin A2 is a soluble mediator of macrophage activation. J Leukoc Biol. 2007;82:1174–1184. doi: 10.1189/jlb.0307154. [DOI] [PubMed] [Google Scholar]
- 29.Madureira PA, O'Connell PA, Surette AP, Miller VA, Waisman DM. The biochemistry and regulation of S100A10: A multifunctional plasminogen receptor involved in oncogenesis. J Biomed Biotechnol. 2012;2012:353687. doi: 10.1155/2012/353687. [DOI] [PMC free article] [PubMed] [Google Scholar]
- 30.He KL, Sui G, Xiong H, Broekman MJ, Huang B, Marcus AJ, Hajjar KA. Feedback regulation of endothelial cell surface plasmin generation by PKC-dependent phosphorylation of annexin A2. J Biol Chem. 2011;286:15428–15439. doi: 10.1074/jbc.M110.185058. [DOI] [PMC free article] [PubMed] [Google Scholar]