Abstract
To screen differentially expressed genes (DEGs) of Osteosarcoma (OS) by using the microarray expression profiles of tissues of normal person and patients with OS for early diagnosis and effective treatment of OS. We downloaded the gene expression profile of GES16088 from Gene Expression Omnibus database, including twenty samples from fourteen patients diagnosed with osteosarcoma and six normal samples as control groups. We identified the DEGs by Affy package in R language. Bioinformatic methods were used for further analysis of the screened DEGs. Firstly, cluster analysis was performed on the selected DEGs for comparison of the expression degree. After protein-protein interaction (PPI) network of differentially expressed genes was constructed by STRING, we analyzed gene functions with DAVID and WebGestalt. Compared with the control, we screened three distinctly up-regulated genes. These DEGs had close relationship with transmission signaling pathway, organ and system development. The up-regulated gene COL was the most representative genes among the DEGs. The screened DEGs have a great significance on studying mechanism of osteosarcoma. It might distinguish normal and pathological tissues of OS and thus become target genes for monitoring, diagnosis and treatment of the OS. It has the potential to use in clinic.
Keywords: Osteosarcoma, differentially expressed genes, protein-protein interaction, gene ontology enrichment
Introduction
Osteosarcoma (OS) is the most common malignant bone tumor. It occurs most frequently in adolescents among individuals aged >60 years [1]. Eighty percent of this tumor will metastasize to the lungs or liver, and as a result, patients generally need chemotherapy for survival possibility. In the last two decades there have been no concrete developments in their systemic treatment. Most osteosarcoma epidemiology studies have been embedded in large analysis of all bone tumors or focused on cases occurring in adolescence [2]. Despite the considerable improvement in OS in the last few years, given the fact that almost eighty percent of the patients with OS can hold their morbid limbs and survival rate of OS rise from twenty percent to eighty percent, more than half patients still die from the metastases and relapse of the disease [3]. Recently, with the development of molecular biology of tumor, therapeutic strategies on genes have been reported in extensive studies, which has revealed good potential in clinical appliance [4-6]. To identify OS-related specific genes for early diagnosis of OS, we attempt to find out significantly differently expressed genes in OS by analyzing serum samples from patients with OS and normal tissue samples form control groups, in the hope to select out potential biomarkers for early diagnosis of OS.
Early study showed that interleukin-1 beta (IL-1B) is crucially involved in osteosarcoma carcinogenes and revealed the association between IL-1B gene polymorphisms and osteosarcoma risk [7]. In Song GH’s investigation [8], SCUBE3 is reported to up-regulated in primary osteosarcoma tissues to promote the proliferation of osteosarcoma cells, illuminating that high SCUBE3 expression in osteosarcoma tissues could be associated with a poor prognosis of the patients, further suggesting that SCUBE3 can serve as a potential therapeutic target for osteosarcoma.
Despite all the considerate study, detailed descriptions of osteosarcoma incidence and biomarkers of patients of all ages and ethnicities are not available. In this study, we are in the hope for finding genes specially expressed in OS by analyzing expression profiling from normal persons and specimen with OS. The screened DEGs may have the potential to become candidate target genes of the OS, and may provide evidence for early diagnosis and treatment of OS.
DNA microarray has been used to investigate the pathogenesis in the breast cancer and pancreatic cancer [9,10]. In this study, we downloaded the gene expression profile of OS tissues and patient-matched normal tissues. The differentially expressed genes (DEGs) in OS tissue were selected by using the expression profiling of normal tissue and OS tissue. In addition, we then used bioinformatic methods to analyze the screened DEGs. We anticipate that our work could improve the understanding of the underlying molecular mechanisms of OS and could provide novel insights for the early diagnosis and medication control of OS.
Materials and methods
Data profiling of OS
We extracted the gene expression profile of GES16088 [11] from GEO (Gene Expression Omnibus) database, including twenty samples from fourteen patients diagnosed with osteosarcoma and six normal samples as control groups. The data platform was at GPL96 [HG-U133A] Affymetrix Human Genome U133A Array.
Data preprocessing and differential expression analysis
Affy package in R language was used to transform original data into the form of expression data [12]. Missing data was imputed [13] and finally all expression profile was normalized by the method of median normalization [14].
Three statistic testing methods of Multtest package in R language [15], namely, T testing, Wilcox testing and Fisher testing were strictly used to identify DEGs in expression values from patients and normal sample tissues. Since multi-test might induce too much false positive results, we used the method of BH [16], which can adjust the raw P-values into false discovery rate (FDR) to circumvent the problem. The FDR<0.05 and |logFC|>1 were used as the cut-off criteria.
STRING (Search Tool for the Retrieval of Interacting Genes/Proteins) [17,18] online was used to construct PPI network among DEGs. Genes with high degree of coefficient were selected to construct protein-protein interaction network by Cytoscape [19]. Igraph package in R language was used to calculate the connectivity degree of nodes.
Protein-protein interaction (PPI) network construction
The protein-protein interactions (PPIs) research could reveal the functions of proteins at the molecular level and thus can help discover the rules of cellular activities including growth, development, metabolism, differentiation and apoptosis [20]. The identification of protein interactions in a genome-wide scale is an important step for the interpretation of the cellular control mechanisms [21]. In this analysis, we selected DEGs with high degree of confidence and found out interacting object of the product of DEGs and constructed the PPI networks by prePPI [22].
Pathway enrichment analysis
Based on the deficiency of individual gene analysis, the gene set enrichment analysis evaluate differential expression patterns of gene groups instead of those of individual genes to distinguish whether the biological functions and characteristics changed [23]. In our analysis, the P value indicated the probability that a gene was endowed a Gene Ontology (GO) function randomly and it was usually used as the criterion for assigning a certain function to a module. GO function annotation, including Cytoscape [24], Mcode [25] and Bingo [26], was performed on these modules. The smaller the P value was, the more likely to prove that function of the module was not occurred randomly but for the purpose to accomplish a certain biological function, and it has unparalleled biological significance [27]. DAVID bioinformatics resources aimed at extracting biological meaning from large gene or protein lists systematically by the help of an integrated biological knowledge base and analytic tools [28]. The functional enrichment analysis for the screened DEGs was performed by DAVID, the FDR<0.05 was chosen as the cut-off criterion.
The pathway enrichment analysis of genes in the PPI networks where the up-and down regulated DEGs with maximal expression levels located was performed by using WebGestalt [29,30]. The FDR<0.05 was selected as the cut-off criterion.
Protein-protein interaction network analysis
The protein-protein interactions (PPIs) [18] research could reveal the functions of proteins at the molecular level and help discover the rules of cellular activities including growth, development, metabolism, differentiation and apoptosis [19]. The identification of protein interactions in a genome-wide scale is an important step for the interpretation of the cellular control mechanisms [15]. In this study, corresponding protein-protein interaction network of DEGs was constructed using the Cytoscape [20], based on the data collected from STRING online datasets. Besides, sub-networks were also established using MCODE (Molecular Complex Detection) [21] along with the extent of gene nodes. Then function analysis was performed on sub-networks later.
Results
Data preprocessing
The standardized expression profiling data after preprocessing were shown in Figure 1, which can clearly show the difference before and after the standardization. The volatility of data after standardization is much stable than data before the process. For dataset GSE16088, a total of 1329 DEGs were identified at FDR<0.05 and |logFC|>1, including 648 down-regulated genes and 681 up-regulated genes. And the down- and up-regulated DEGs with maximum expression degree were UMOD gene and FABP7 (fatty acid binding protein 7) gene, respectively.
Figure 1.
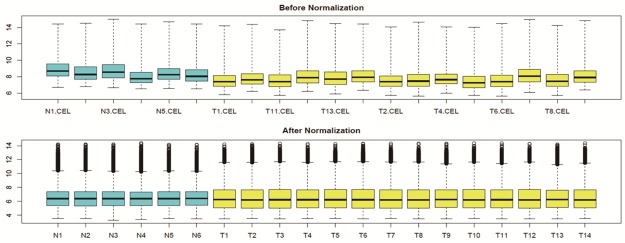
The box-plot of standardized expression data of normal tissue and OS tissue. The blue ones stand for normal samples while the yellow ones represents patients with OS. The medians of the samples were almost on the second dotted line, which indicated that the degree of standardization was very well.
Differentially expression analysis
Only three DEGs were identified at P<0.05 and |logFC|>1 with the three statistic testing methods, along with multiple rectifying testing method Figure 2. Data is shown in Table 1. These genes will be used for further analysis.
Figure 2.
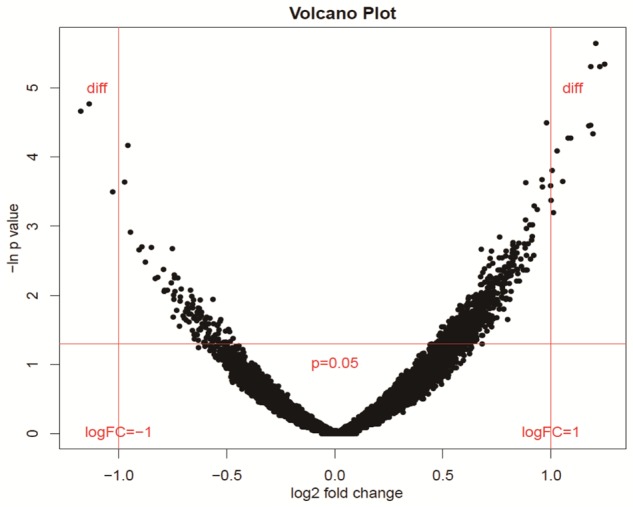
To verify the rationality of P value and corresponding fold change of expression data through different ways. The smaller P value is, the bigger the logFC will be, and then the figure will be shaped as zero, that’s where the name volcano comes from.
Table 1.
Differential expressed genes
| ID_REF | Gene Symbol | T test_adj | Wilcox_adj | Fisher_adj | logFC |
|---|---|---|---|---|---|
| 201667_at | GJA1 | 1.11E-11 | 0.00054674 | 0.02724097 | 1.18443996 |
| 202404_s_at | COL1A2 | 6.05E-13 | 0.00137961 | 0.02724097 | 1.20747741 |
| 221729_at | COL5A2 | 1.23E-12 | 0.00137961 | 0.02724097 | 1.248982 |
Interaction network construction of DEGs
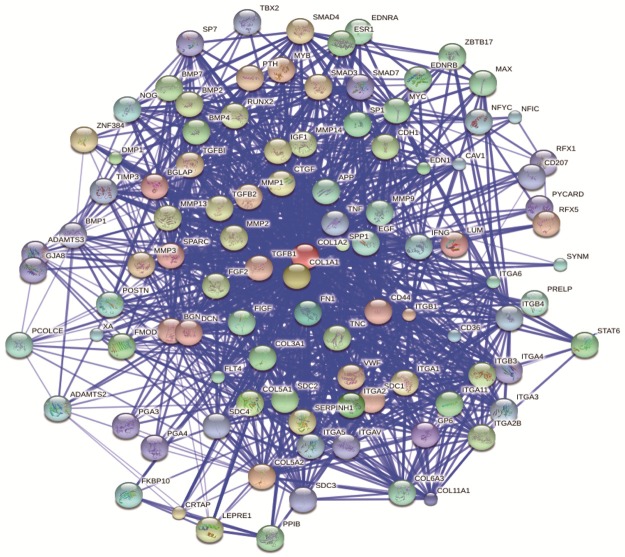
The PPI networks were constructed with the three selected genes at the core based on the data from STRING database, a tool which can combined protein information from several different database and can anticipate interaction objects of specific known protein by analyzing protein sequence and spatial structure.
As shown in Figure 3, we found 207 and 44 interactive objects for UMOD gene and FABP7 gene according to the three-dimensional structure information of proteins included in prePPI software.
Figure 3.
PPI network. Protein information in different database was combined together by String. It can anticipate the interacting objects of target genes by the sequence, spatial structure of the protein.
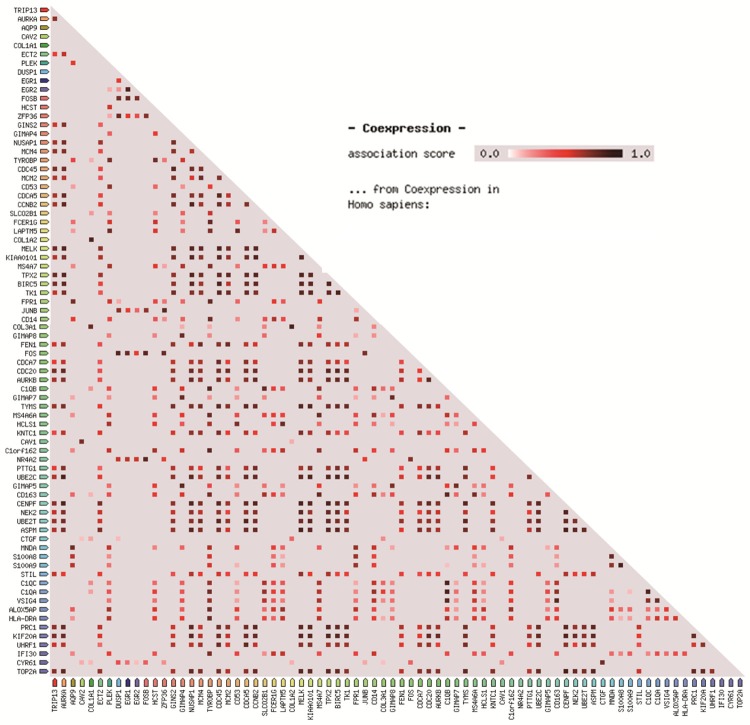
We mapped the DEGs to the STRING database and screened significant interactions with score larger than 0.8. By integrating these relationships, interaction network was constructed. The co-expressed relationship among the DEGs is revealed in Figures 4 and 5.
Figure 4.
The co-expressing relationship map among the DEGs from the STRING database. The co-expressing degree is lower and lower with the dark red color becoming shallow gradually.
Figure 5.
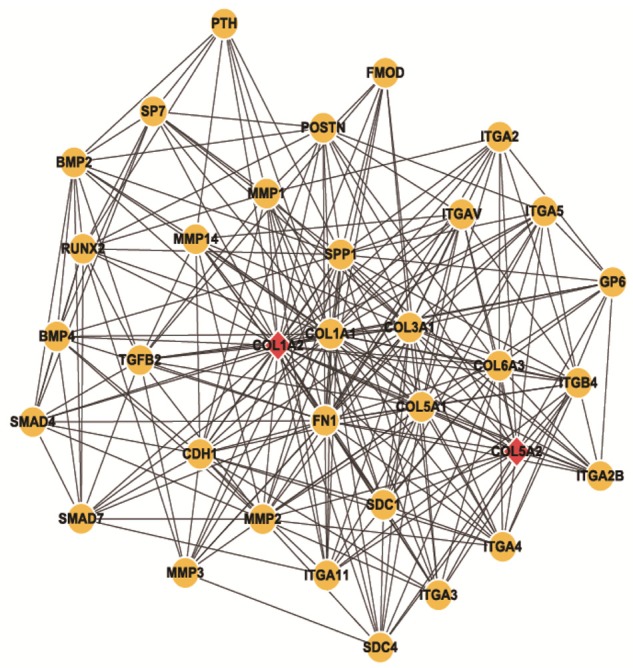
Co-expression module by Cytoscape and plug-in components. Yellow circles represent interacting genes while red rhombus represents the selected DEGs.
Gene ontology enrichment analysis
We used DAVID to analyze all the DEGs in the interaction network and found 16 significant function nodes. The information of DEGs in each function nodes is shown in Table 2 and we can see that the most of them was related to cell cycle.
Table 2.
Functional Enrichment analysis of DEGs in co-expression module
| Term | Count | FDR |
|---|---|---|
| GO:0007067~mitosis | 14 | 4.87E-08 |
| GO:0000280~nuclear division | 14 | 4.87E-08 |
| GO:0000279~M phase | 16 | 4.96E-08 |
| GO:0000087~M phase of mitotic cell cycle | 14 | 6.11E-08 |
| GO:0048285~organelle fission | 14 | 8.06E-08 |
| GO:0022403~cell cycle phase | 16 | 1.23E-06 |
| GO:0000278~mitotic cell cycle | 15 | 2.83E-06 |
| GO:0007049~cell cycle | 20 | 3.37E-06 |
| GO:0051301~cell division | 13 | 2.13E-05 |
| GO:0022402~cell cycle process | 16 | 8.18E-05 |
| GO:0006260~DNA replication | 10 | 4.57E-04 |
| GO:0006259~DNA metabolic process | 14 | 0.00107 |
| GO:0010033~response to organic substance | 16 | 0.00189 |
| GO:0007059~chromosome segregation | 7 | 0.00381 |
| GO:0010564~regulation of cell cycle process | 7 | 0.02769 |
| GO:0009719~response to endogenous stimulus | 11 | 0.03408 |
Module analysis
Module analysis was performed on the obtained network using Cytoscape software. Mcode was used to explore the mutual module of two genes and Bingo was used to do the annotation. The data was shown in Table 3.
Table 3.
GO enrichment function analysis
| GO-ID | Function | Corr P-value |
|---|---|---|
| 7229 | Integrin-mediated signaling | 1.18E-12 |
| 48513 | Organ development | 1.18E-12 |
| 48731 | System development | 3.69E-10 |
| 22610 | Biological adhesion | 3.69E-10 |
| 7155 | Cell adhesion | 3.69E-10 |
| 48856 | Anatomical structure development | 3.24E-09 |
| 9888 | Tissue development | 5.69E-08 |
| 32501 | Multicellular organismal process | 7.84E-08 |
| 7275 | Multicellular organismal development | 7.84E-08 |
| 7166 | Cell surface receptor linked signal transduction | 0.000000135 |
| 7167 | Enzyme linked receptor protein signaling pathway | 0.000000168 |
| 7178 | Transmembrane receptor protein serine/threonine kinase signaling pathway | 0.000000194 |
Discussion
Tumors can be regarded as the abnormal expression of the genetic materials of cell, so as the disease of osteosarcoma. Osteosarcomas are the most common primary malignant tumors of bone, showing complex chromosomal rearrangements with multiple gains and losses [31]. Residual tumor tissue as a result of unplanned excision of soft tissue sarcoma is a risk factor for local recurrence [32]. The extremely variable biological behaviour of malignant tumors is a diagnostic and prognostic challenge for clinicians and histopathologists alike [33].
In Jeon’s study [32], twenty-five cases were selected to accept the tumor-removed surgery, which turns out that local recurrence rate increased and the whole survival rate without tumor was 65%. Local recurrence has lowered the patients’ survival rate with an average of five or ten years [34]. Bramer [35] observed the level of alkalinephosphatase (AP) of eighty-nine adults cases before and after the chemotherapy, anticipated its relation with chemical reaction and survival. A pre-chemotherapy revealed AP was above twice Normal and correlated with worse survival, with the conclusion that a raised post-chemotherapy AP predicting poor chemotherapy response.
The target therapy for OS is becoming a popular subject in the clinical medical research, and the treatment for advanced OS has become an urgent issue giving its high occurrence rate on teenagers. Given the fact that there is not much research towards molecular inheritance of OS, in this study, we investigated the normal tissues and tissues of patients with OS to find out osteosarcoma-related genes in order to find out biomarkers of the disease. We analyzed differentially expressed genes (DEGs) in patients with osteosarcoma, in order to explore the relationship between the factor of heredity and the occurrence frequency of OS. It can be subservient in providing possible evidence in genetics for the precautions, clinical diagnose and treatment of OS. According to the results, COL (collagen) was obviously up-regulated among DEGs. We anticipated that it can be regarded as one of the feature genes in diagnose of OS.
The formation and rebuilt of bone are mainly associated with the diversion, proliferation of osteoprogenitor and cartilage progenitor cells and formation of extracellular matrix, a process precisely activated or surpressed by a series of genes. It has been proved that specific transcriptional factor of osteoblast plays an important role in regulating these genes, among which RUNX2 are the most important one [36,37]. RUNX2 has been identified as a high risk factor and direct-related gene in osteosarcoma. However, there is rare research on other gene sequence associated with osteosarcoma. According to the results of cluster analysis in our study, corresponding genes of X17, X2, X4, X3, X18, X19, X12, X1, X5, X20, X7, X21, X6 may affect osteosarcoma in the same way as RUNX2 does, which may also belong to the genes of high risk factor and direct-related genes.
In this study, we are to explore the genetic factors effected on the prevalence mechanism of osteosarcoma disease through analyzing the inter relationship between osteosarcoma disease related genes, and provide the genetic base more information on osteosarcoma for prevention, diagnosis and treatment of osteosarcoma. Though the research of gene therapy for tumor has a bright future, there are still different kinds of problems and difficulties. Different kinds of tumor have different pathogenic mechanisms, and some tumors are polygenic disease. We anticipated that COL as the possible feature genes of OS, but the molecular mechanism and target therapy of OS needs to be further explored and researched.
Acknowledgements
Thank all our colleagues for their valuable suggestions and discussion.
Disclosure of conflict of interest
None.
References
- 1.Mirabello L, Troisi RJ, Savage SA. Osteosarcoma incidence and survival rates from 1973 to 2004. Cancer. 2009;115:1531–43. doi: 10.1002/cncr.24121. [DOI] [PMC free article] [PubMed] [Google Scholar]
- 2.Arndt CA, Crist WM. Common musculoskeletal tumors of childhood and adolescence. N Engl J Med. 1999;341:342–52. doi: 10.1056/NEJM199907293410507. [DOI] [PubMed] [Google Scholar]
- 3.Ferrari S, Smeland S, Mercuri M, Bertoni F, Longhi A, Ruggieri P, Alvegard TA, Picci P, Capanna R, Bernini G, Müller C, Tienghi A, Wiebe T, Comandone A, Böhling T, Del Prever AB, Brosjö O, Bacci G, Saeter G Italian and Scandinavian Sarcoma Groups. Neoadjuvant chemotherapy with high-dose Ifosfamide, high-dose methotrexate, cisplatin, and doxorubicin for patients with localized osteosarcoma of the extremity: a joint study by the Italian and Scandinavian Sarcoma Groups. J. Clin. Oncol. 2005;23:8845–52. doi: 10.1200/JCO.2004.00.5785. [DOI] [PubMed] [Google Scholar]
- 4.Levine AJ. p53, the cellular gatekeeper for growth and division. Cell. 1997;88:323–31. doi: 10.1016/s0092-8674(00)81871-1. [DOI] [PubMed] [Google Scholar]
- 5.Ragland BD, Bell WC, Lopez RR, Siegal GP. Cytogenetics and molecular biology of osteosarcoma. Lab Invest. 2002;82:365–73. doi: 10.1038/labinvest.3780431. [DOI] [PubMed] [Google Scholar]
- 6.Wang H, Zeng X, Oliver P, Le L, Chen J, Chen L, Zhou W, Agrawal S, Zhang R. MDM2 oncogene as a target for cancer therapy: an antisense approach. Int J Oncol. 1999;15:653–713. [PubMed] [Google Scholar]
- 7.He Y, Liang X, Meng C, Shao Z, Gao Y, Wu Q, Liu J, Wang H, Yang S. Genetic polymorphisms of interleukin-1 beta and osteosarcoma risk. Int Orthop. 2014;38:1671–6. doi: 10.1007/s00264-014-2374-2. [DOI] [PMC free article] [PubMed] [Google Scholar]
- 8.Song G, Wang J, Lu J, Xu H, Zhao Z, Tang Q, Zou C, Yin J, Xie X, Shen J. [Role of SCUBE3 in promoting osteosarcoma cell growth and its association with prognosis] . Nan Fang Yi Ke Da Xue Xue Bao. 2014;34:617–21. [PubMed] [Google Scholar]
- 9.Eeckhoute J, Carroll JS, Geistlinger TR, Torres-Arzayus MI, Brown M. A cell-type-specific transcriptional network required for estrogen regulation of cyclin D1 and cell cycle progression in breast cancer. Gene Develop. 2006;20:2513–26. doi: 10.1101/gad.1446006. [DOI] [PMC free article] [PubMed] [Google Scholar]
- 10.Abdollahi A, Schwager C, Kleeff J, Esposito I, Domhan S, Peschke P, Hauser K, Hahnfeldt P, Hlatky L, Debus J, Peters JM, Friess H, Folkman J, Huber PE. Transcriptional network governing the angiogenic switch in human pancreatic cancer. Proc Natl Acad Sci U S A. 2007;104:12890–5. doi: 10.1073/pnas.0705505104. [DOI] [PMC free article] [PubMed] [Google Scholar]
- 11.Paoloni M, Davis S, Lana S, Withrow S, Sangiorgi L, Picci P, Hewitt S, Triche T, Meltzer P, Khanna C. Canine tumor cross-species genomics uncovers targets linked to osteosarcoma progression. BMC Genomics. 2009;10:625. doi: 10.1186/1471-2164-10-625. [DOI] [PMC free article] [PubMed] [Google Scholar]
- 12.Fujita A, Sato JR, Rodrigues LO, Ferreira CE, Sogayar MC. Evaluating different methods of microarray data normalization. BMC Bioinformatics. 2006;7:469. doi: 10.1186/1471-2105-7-469. [DOI] [PMC free article] [PubMed] [Google Scholar]
- 13.Troyanskaya O, Cantor M, Sherlock G, Brown P, Hastie T, Tibshirani R, Botstein D, Altman RB. Missing value estimation methods for DNA microarrays. Bioinformatics. 2001;17:520–5. doi: 10.1093/bioinformatics/17.6.520. [DOI] [PubMed] [Google Scholar]
- 14.Austin MA, Berry DB, Busch EM, Feltz KT, Goodman TA, Hogan SJ. Call-processing system and method. Google Patents. 1996 [Google Scholar]
- 15.Pollard KS, Dudoit S, van der Laan MJ. Bioinformatics and Computational Biology Solutions Using R and Bioconductor. Springer; 2005. Multiple testing procedures: the Multtest Package and Applications to Genomics; pp. 249–71. [Google Scholar]
- 16.Benjamini Y, Hochberg Y. Controlling the false discovery rate: a practical and powerful approach to multiple testing. Journal of the Royal Statistical Society Series B (Methodological) 1995:289–300. [Google Scholar]
- 17.Szklarczyk D, Franceschini A, Kuhn M, Simonovic M, Roth A, Minguez P, Doerks T, Stark M, Muller J, Bork P, Jensen LJ, von Mering C. The STRING database in 2011: functional interaction networks of proteins, globally integrated and scored. Nucleic Acids Res. 2011;39:D561–D8. doi: 10.1093/nar/gkq973. [DOI] [PMC free article] [PubMed] [Google Scholar]
- 18.Franceschini A, Szklarczyk D, Frankild S, Kuhn M, Simonovic M, Roth A, Lin J, Minguez P, Bork P, von Mering C, Jensen LJ. STRING v9. 1: protein-protein interaction networks, with increased coverage and integration. Nucleic Acids Res. 2013;41:D808–D15. doi: 10.1093/nar/gks1094. [DOI] [PMC free article] [PubMed] [Google Scholar]
- 19.Shannon P, Markiel A, Ozier O, Baliga NS, Wang JT, Ramage D, Amin N, Schwikowski B, Ideker T. Cytoscape: a software environment for integrated models of biomolecular interaction networks. Genome Res. 2003;13:2498–504. doi: 10.1101/gr.1239303. [DOI] [PMC free article] [PubMed] [Google Scholar]
- 20.Giot L, Bader JS, Brouwer C, Chaudhuri A, Kuang B, Li Y, Hao YL, Ooi CE, Godwin B, Vitols E, Vijayadamodar G, Pochart P, Machineni H, Welsh M, Kong Y, Zerhusen B, Malcolm R, Varrone Z, Collis A, Minto M, Burgess S, McDaniel L, Stimpson E, Spriggs F, Williams J, Neurath K, Ioime N, Agee M, Voss E, Furtak K, Renzulli R, Aanensen N, Carrolla S, Bickelhaupt E, Lazovatsky Y, DaSilva A, Zhong J, Stanyon CA, Finley RL Jr, White KP, Braverman M, Jarvie T, Gold S, Leach M, Knight J, Shimkets RA, McKenna MP, Chant J, Rothberg JM. A protein interaction map of Drosophila melanogaster. Science. 2003;302:1727–36. doi: 10.1126/science.1090289. [DOI] [PubMed] [Google Scholar]
- 21.Li S, Armstrong CM, Bertin N, Ge H, Milstein S, Boxem M, Vidalain PO, Han JD, Chesneau A, Hao T, Goldberg DS, Li N, Martinez M, Rual JF, Lamesch P, Xu L, Tewari M, Wong SL, Zhang LV, Berriz GF, Jacotot L, Vaglio P, Reboul J, Hirozane-Kishikawa T, Li Q, Gabel HW, Elewa A, Baumgartner B, Rose DJ, Yu H, Bosak S, Sequerra R, Fraser A, Mango SE, Saxton WM, Strome S, Van Den Heuvel S, Piano F, Vandenhaute J, Sardet C, Gerstein M, Doucette-Stamm L, Gunsalus KC, Harper JW, Cusick ME, Roth FP, Hill DE, Vidal M. A map of the interactome network of the metazoan C. elegans. Science. 2004;303:540–3. doi: 10.1126/science.1091403. [DOI] [PMC free article] [PubMed] [Google Scholar]
- 22.Zhang QC, Petrey D, Garzón JI, Deng L, Honig B. PrePPI: a structure-informed database of protein-protein interactions. Nucleic Acids Res. 2013;41:D828–33. doi: 10.1093/nar/gks1231. [DOI] [PMC free article] [PubMed] [Google Scholar]
- 23.Nam D, Kim SY. Gene-set approach for expression pattern analysis. Brief Bioinform. 2008;9:189–97. doi: 10.1093/bib/bbn001. [DOI] [PubMed] [Google Scholar]
- 24.Smoot ME, Ono K, Ruscheinski J, Wang PL, Ideker T. Cytoscape 2.8: new features for data integration and network visualization. Bioinformatics. 2011;27:431–2. doi: 10.1093/bioinformatics/btq675. [DOI] [PMC free article] [PubMed] [Google Scholar]
- 25.Choi S, Srivas R, Fu KY, Hood BL, Dost B, Gibson GA, Watkins SC, Van Houten B, Bandeira N, Conrads TP, Ideker T, Bakkenist CJ. Quantitative proteomics reveal ATM kinase-dependent exchange in DNA damage response complexes. J Proteome Res. 2012;11:4983–91. doi: 10.1021/pr3005524. [DOI] [PMC free article] [PubMed] [Google Scholar]
- 26.Maere S, Heymans K, Kuiper M. BiNGO: a Cytoscape plugin to assess overrepresentation of gene ontology categories in biological networks. Bioinformatics. 2005;21:3448–9. doi: 10.1093/bioinformatics/bti551. [DOI] [PubMed] [Google Scholar]
- 27.Allison DB, Cui X, Page GP, Sabripour M. Microarray data analysis: from disarray to consolidation and consensus. Nat Rev Genet. 2006;7:55–65. doi: 10.1038/nrg1749. [DOI] [PubMed] [Google Scholar]
- 28.Huang da W, Sherman BT, Lempicki RA. Systematic and integrative analysis of large gene lists using DAVID bioinformatics resources. Nat Protoc. 2008;4:44–57. doi: 10.1038/nprot.2008.211. [DOI] [PubMed] [Google Scholar]
- 29.Zhang B, Kirov S, Snoddy J. WebGestalt: an integrated system for exploring gene sets in various biological contexts. Nucleic Acids Res. 2005;33(Suppl 2):W741–W8. doi: 10.1093/nar/gki475. [DOI] [PMC free article] [PubMed] [Google Scholar]
- 30.Duncan D, Prodduturi N, Zhang B. WebGestalt2: an updated and expanded version of the Web-based Gene Set Analysis Toolkit. BMC Bioinformatics. 2010;11(Suppl 4):P10. [Google Scholar]
- 31.Barøy T, Kresse SH, Skårn M, Stabell M, Castro R, Lauvrak S Llombart-Bosch A, Myklebost O, Meza-Zepeda LA. Reexpression of LSAMP inhibits tumor growth in a preclinical osteosarcoma model. Mol Cancer. 2014;13:93. doi: 10.1186/1476-4598-13-93. [DOI] [PMC free article] [PubMed] [Google Scholar]
- 32.Jeon DG, Lee SY, Kim JW. Bone primary sarcomas undergone unplanned intralesional procedures-the possibility of limb salvage and their oncologic results. J Surg Oncol. 2006;94:592–8. doi: 10.1002/jso.20607. [DOI] [PubMed] [Google Scholar]
- 33.Wang L, Smith A, Iacopetta B, Wood D, Papadimitriou J, Zheng M. Nested PCR-SSCP assay for the detection of p53 mutations in paraffin wax embedded bone tumours: improvement of sensitivity and fidelity. Clin Mol Pathol. 1996;49:M176. doi: 10.1136/mp.49.3.m176. [DOI] [PMC free article] [PubMed] [Google Scholar]
- 34.Ayerza MA, Muscolo DL, Aponte-Tinao LA, Farfalli G. Effect of erroneous surgical procedures on recurrence and survival rates for patients with osteosarcoma. Clin Orthop Relat Res. 2006;452:231–5. doi: 10.1097/01.blo.0000229314.58878.88. [DOI] [PubMed] [Google Scholar]
- 35.Bramer JA, Abudu AA, Tillman RM, Carter SR, Sumathi VP, Grimer RJ. Pre- and post-chemotherapy alkaline phosphatase levels as prognostic indicators in adults with localised osteosarcoma. Eur J Cancer. 2005;41:2846–52. doi: 10.1016/j.ejca.2005.07.024. [DOI] [PubMed] [Google Scholar]
- 36.Pratap J, Galindo M, Zaidi SK, Vradii D, Bhat BM, Robinson JA, Choi JY, Komori T, Stein JL, Lian JB, Stein GS, van Wijnen AJ. Cell growth regulatory role of Runx2 during proliferative expansion of preosteoblasts. Cancer Res. 2003;63:5357–62. [PubMed] [Google Scholar]
- 37.lark JC, Dass CR, Choong PF. A review of clinical and molecular prognostic factors in osteosarcoma. J Cancer Res Clin Oncol. 2008;134:281–97. doi: 10.1007/s00432-007-0330-x. [DOI] [PubMed] [Google Scholar]


