Abstract
Lead is a widely-spread environmental pollutant and a commonly-used industrial chemical that can cause multisystemic adverse health effects. However, the effects of lead exposure on diabetic animals have not been reported so far. The aim of this study is to evaluate the effects of lead exposure on thyroid, renal and oxidative stress markers in diabetic Wistar rats. Diabetes was induced with an intraperitoneal (i.p.) injection of streptozocin (STZ). Six weeks later, rats were exposed i.p. to either distilled water (control group) or 25, 50 and 100 mg/kg of lead acetate (treatment groups). We found a positive relationship between the administered doses of lead acetate and its measured levels in blood samples (P < 0.01). Treatment of diabetic animals with lead acetate resulted in significant weight loss (P < 0.001). It also caused an increase in thyroid stimulating hormone levels (P < 0.05) and reductions in thyroxine (P < 0.05) and triiodothyronine levels (P < 0.01), a clinical picture consistent with hypothyroidism. Lead acetate exposure increased urea levels (P < 0.05) and caused a significant decrease in creatinine (P < 0.05). Besides, while the concentrations of malondialdehyde were not affected, glutathione stores were depleted (P < 0.01); in response to lead exposure. In conclusion, exposure of diabetic rats to lead acetate resulted in weight loss, clinical hypothyroidism, renal damage and oxidative stress.
Keywords: Lead, rat, diabetes, thyroid, systemic toxicity
Introduction
Being a ubiquitous element in the environment, lead causes toxic effects to various organ systems. Although environmental lead exposures, where the general population is exposed to lead mainly through ingestion [1] are common, currently the most important sources of lead exposure are occupational settings, which usually involve inhalation of lead oxide dust particles [2,3]. According to the American Centers for Disease Control (CDC), lead is the main environmental toxin in children [4] and as such it results in one of ‘the most prevalent diseases of environmental origin among children’ [5].
Over the last few decades, modern lifestyles have increased the prevalence of several non-communicable multisystemic diseases including diabetes mellitus (DM). According to World Health Organization (WHO), the global prevalence of DM is 347 million cases and it is estimated that it caused more than 3 million deaths in 2003 [6]. In the UAE, the prevalence of DM among expatriates ranges from 13 to 19%, obviously depending on their genetic backgrounds. On the other hand, 25% of Emiratis are diabetic [7]. With such high levels, the UAE has the second highest global prevalence of DM [8].
It has been estimated that thyroid disorders would eventually develop in about one third of Type I diabetic patients [9], indicating that there is a strong association between these two conditions. In Spain, the incidence of thyroid dysfunction in patients with Type II diabetes was reported to be around 10%, whereas its prevalence was about 32% [10].
On the other hand, in experimental animal research, streptozocin (STZ), which is an alkylating agent that causes DNA damage and cross-linking [11], is frequently used for studying Type I (insulin dependent) diabetes mellitus [12]. Being similar to the natural disease, this model can also induce an immune-mediated reaction [13] and can affect the thyroid functions of the treated animals. When 80 mg/Kg of STZ was given through sublingual injections, triiodothyronine (T3) levels in Sprague-Dawley (SD) rats had a statistically significant drop only during the first two weeks of induced DM, whereas, thyroxine (T4) levels remained low throughout the 7 weeks of assessment i.e. the levels of only the biologically active hormone, namely T3, were maintained [14].
Currently, oxidative stress is correlated with a variety of pathological conditions and complications including both types of DM [15,16]. Because of the intrinsic nature of the synthesis of thyroid hormones since iodide has to be oxidized first, interactions with reactive oxygen species (ROS) such as the oxidizing agent H2O2 may obviously result in glandular pathologies [17]. Many thyroid abnormalities such as overt hypothyroidism, Graves’ disease and Hashimoto thyroiditis have been associated with oxidative stress as the levels of superoxide dismutase (SOD) were found to be elevated [18,19].
Similarly, lead exposure is also associated with oxidative damage [20,21], resulting in for instance, a decrease in hepatic SOD levels [20], the production of ROS and the overconsumption of intracellular glutathione stores [21,22]. Lead can also inhibit hepatic glutathione reductase, glutathione-S-transferase and glutathione peroxidase enzymes [23].
In this study, our main aim is to determine the relationship between exposure to several doses of lead acetate trihydrate and the pituitary-thyroid pathway in STZ-induced diabetic rats. In addition, we also studied lead’s effects on the liver, kidneys and oxidative stress markers.
Materials and methods
The Research Ethics Committee (Institutional Review Board) at the College of Medicine and Health Sciences at UAE University approved this study.
Animals
We used adult male Wistar rats. The weight of the animals was monitored before the induction of DM and throughout until the last day of the experiments. The animals, housed in polypropylene plastic cages, were kept in 12-hours’ long cycles of light and dark. The temperature in the animal house was maintained at 22 ± 2°C . The animals were provided with chow and tap drinking water ad libitum. Sodium pentobarbital (70 mg/kg) was administered as a general anesthetic before the collection of samples.
Induction of diabetes mellitus
Type I diabetes was induced in one month old rats by treating them with a single dose of 60 mg/kg STZ freshly prepared in citrate buffer, given as i.p. injections [24]. The animals were monitored and their weight was recorded on a weekly basis. Six weeks later and just before the start of experiments, blood samples from the tail were examined for random blood sugar (RBS) levels using an Accucheck performa glucometer (Roche Diagnostics, NSW, Australia). The cut value for diagnosing diabetes was set at 300 mg/dL and the animals that have not become diabetic were excluded.
Treatment protocol
The treatment protocol that we used is shown in (Table 1). Six weeks post DM induction with STZ, the animals were divided into four groups i.e. the control group is also a diabetic group. All groups were treated with daily i.p. injections for five days. This time duration of five days is commonly used in lead studies [25]. As for the control group, the animals were given distilled water (DW). On the other hand, the three treatment groups received 25, 50, and 100 mg/kg of lead acetate trihydrate, respectively.
Table 1.
Treatment protocol
| Groups | 5 Days Treatment, i.p. Lead Dose (mg/kg) | Percentage of Lead Acetate Trihydrate LD50 (%) |
|---|---|---|
| Control | DW | |
| A | 25 | 12.50 |
| B | 50 | 25.00 |
| C | 100 | 50.00 |
The control group was treated with daily intraperitoneal (i.p.) injections of distilled water (DW) for five days. Treatment groups A, B and C were given 25, 50, and 100 mg/kg of lead acetate trihydrate, respectively. The relationship between lead acetate trihydrate doses and the percentage of its LD50 (%) is shown.
Blood samples
Following the injection with the last dose on day 5, all blood samples were collected within half an hour to one hour later. The sampling process took place between 9.00 a.m. to 1.00 p.m. The abdominal cavity was opened and blood samples were collected from the inferior vena cava. The preloaded syringes contained the anticoagulant 4% sodium citrate. We used fresh whole blood samples to determine complete blood counts (CBC). The remaining blood samples were centrifuged at 3000 g for 10 minutes. Then, the prepared plasma and a portion of whole blood samples, that were used to determine blood lead levels (BLL), were stored at -80.0°C waiting for analysis.
Chemicals
Lead acetate trihydrate was obtained from Sigma, Aldrich (Missouri, USA). An inductively coupled plasma mass spectrometer (ICP-MS) and the following list of chemicals were used to determine BLL. Tetra methyl ammonium hydroxide (TMAH), Triton X-100, and EDTA disodium salt; all were TraceSelect® grade and were purchased from Sigma-Aldrich (St. Louis, MO, USA). Lead, the primary standard and the Rhodium, the internal standard, were PE Pure® grade and obtained from PerkinElmer (CT, USA). Standard reference materials (SRM) Sero Whole Blood level 2 were purchased from Seronorm® (Sero, Norway). Pure water was supplied through our lab resources and equipped with MilliQ Millipore® laboratory pure water (> 18 MOhms).
Assessment of BLL
We used an adapted version of the ICP-MS method, that was described by Nunes, J.A., et al. [26] in order to determine BLL in whole blood samples. We carried out all the analyses on a PerkinElmer Nexion 300® machine and the software version is Nexion®. For this purpose, the three major isotopes of lead: m/z 206, 207, and 208 were looked for.
Assessment of hormonal levels
We purchased thyroid stimulating hormone (TSH) ELISA kits for rats from USCN Life Science Inc. (Wuhan, China). Total T3 and total T4 ELISA kits for rats were obtained from MyBioSource Company (California, USA). We analyzed the plasma samples by following the instructions that were given in the relevant company’s manuals.
Assessment of oxidative stress markers
The kits for determining glutathione (GSH) levels in plasma were purchased from Sigma, Aldrich (Missouri, USA). The MDA assay kit was obtained from Northwest Life Science Specialties (Vancouver, USA). Then, the manufacturers’ instructions as described previously were followed [27].
Assessment of complete blood counts (CBC)
ABX VET ABC Hematology Analyzer machine, which has a special analysis card for rats, is purchased from ABX Diagnostics (Montpellier, France). We used this machine to analyze CBC parameters in whole blood samples.
Assessment of biochemical parameters
Kidney and liver functions were determined using Cobas Integra 400 biochemistry analyzer from Roche (Indianapolis, USA). The following 6 parameters in plasma were determined: blood urea, creatinine (CRE), albumin (ALB), aspartate aminotransferase (AST), C-reactive protein (CRP) and total proteins.
Statistical analysis
We used GraphPad Prism 5 for Windows, version 5.01, 2007 to analyze our data. All parameters were analyzed with one way ANOVA. This was followed with Bonferroni post-hoc test for selected groups to compare the control group with each treatment group. Results are presented as mean ± standard error of the mean (SEM).
Results
Weight monitoring
Adult male Wistar rats were injected with STZ to induce DM. over the next six weeks, there was no significant difference in the weight of these rats i.e. the animals maintained nearly the same weight throughout the observation period (data not shown).
During the experiments, the diabetic control group maintained its weight throughout the five days of treatment. However, treatment of the diabetic rats with various doses of lead acetate resulted in significant reductions in the weight of these animals (Figure 1). The group that was treated with 100 mg/kg of lead acetate had the highest amount of weight loss.
Figure 1.
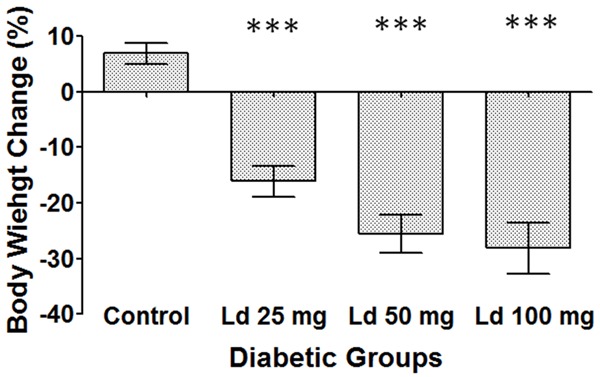
Percentage of weight change over five days of treatment. One-way ANOVA test, followed by Bonferroni post-hoc test for selected groups are used. Results represent mean ± SEM, (n = 9), and ***: P < 0.001.
RBS results
Six weeks post DM induction; the animals had an RBS level ranging from 394.0 to 600.0 mg/dL with a mean level of 546.3 ± 8.9 mg/dL.
BLL results
The control group did not have any detectable BLL (Figure 2). In comparison, the groups that were treated with lead acetate had increasing and statistically significant BLL. Treatment of the rats with 25, 50, and 100 mg/kg of lead acetate caused BLL of 1228, 1498 and 2330 ppb, respectively.
Figure 2.
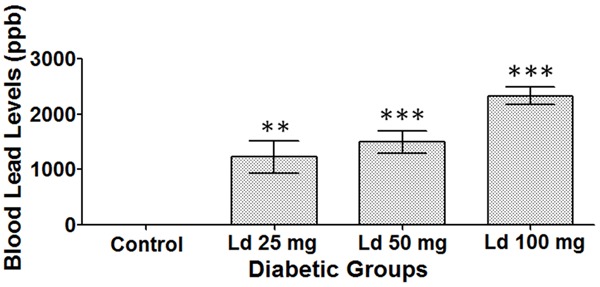
Blood lead levels (BLL). One-way ANOVA test, followed by Bonferroni post-hoc test for selected groups are used. Results represent mean ± SEM, (n = 4-7), and **: P < 0.01, ***: P < 0.001.
Thyroid function tests
There was an increase in TSH levels in the groups that were treated with 50 and 100 mg/kg of lead acetate, compared with the control group (Figure 3A). However, the level was statistically significant only in the group that received the highest dose. On the other hand, treatment with 50 and 100 mg/kg of lead acetate caused a statistically significant reduction in T4 levels (Figure 3B). Similarly, the decrease in T3 levels was significant only in these same two groups i.e. the ones that were treated with 50 and 100 mg/kg of lead acetate (Figure 3C).
Figure 3.
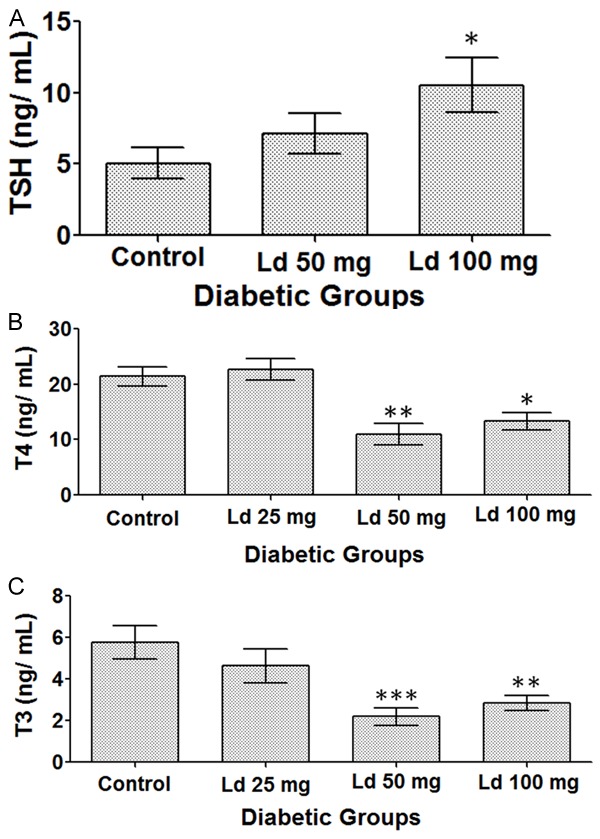
Levels of (A) TSH. (B) T4. (C) T3. One-way ANOVA test, followed by Bonferroni post-hoc test for selected groups are used. Results represent mean ± SEM, (n = 5-10), and *: P < 0.05, **: P < 0.01, and ***: P < 0.001.
Oxidative stress markers in plasma
Compared to the control group, there was a reduction in GSH levels in all treated groups. However, the low levels were statistically significant only in the groups that received high lead acetate doses (50 and 100 mg/kg) (Figure 4A).
Figure 4.
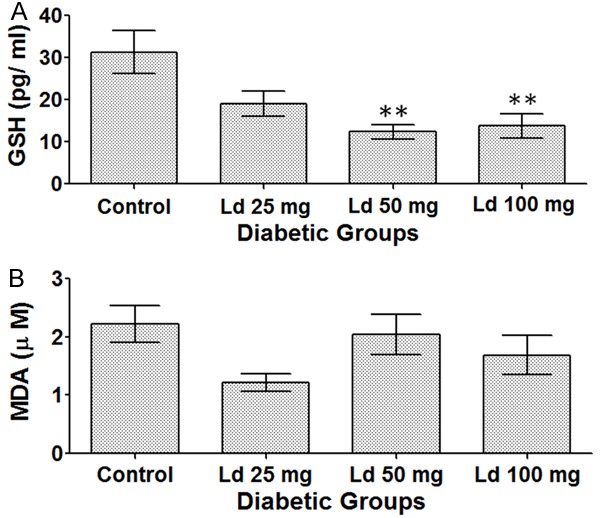
Levels of (A) GSH, (B) MDA. One-way ANOVA test, followed by Bonferroni post-hoc test for selected groups are used. Results represent mean ± SEM, (n = 6-12), and **: P < 0.01.
On the other hand, no statistically significant results were observed regarding MDA levels in the various treatment groups (Figure 4B).
CBC results
At the given treatment doses and exposure durations, CBC parameters including hemoglobin levels, hematocrit percentage, WBC counts and platelet counts were well preserved and no significant effects were detected (data not shown).
Assessment of biochemical parameters
Lead exposure resulted in significant effects on renal functions. In comparison to the control group, treatment with high doses of lead acetate i.e. 50 and 100 mg/kg caused a statistically significant increase in urea levels (Figure 5A) and at the same time a significant reduction in creatinine levels (Figure 5B). Regarding hepatic parameters, lead exposure did not have any significant effect on AST, CRP, total proteins and ALB levels (data not shown).
Figure 5.
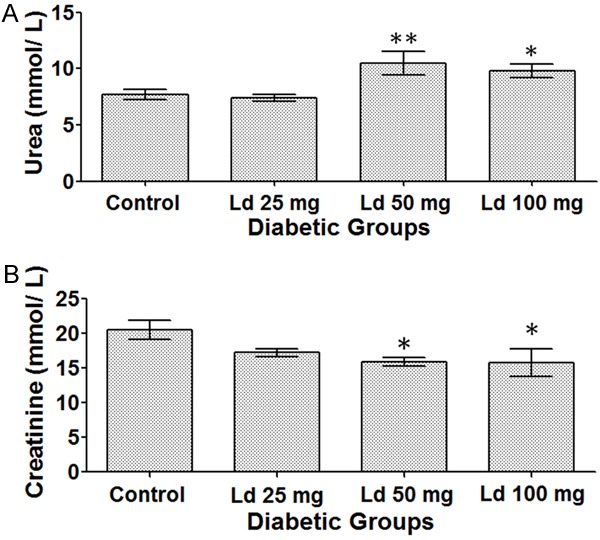
(A) Urea levels. (B) Creatinine levels. One-way ANOVA test, followed by Bonferroni post-hoc test for selected groups are used. Results represent mean ± SEM, (n = 7-14), and *: P < 0.05 and **: P < 0.01.
Discussion
In this study, we investigated the effect of lead on the thyroid glands in STZ-induced diabetic rats. Lead exposure resulted in significant effects on the pituitary-thyroid pathway, leading to an increase in TSH levels and reductions in T4 and T3 levels. Our results demonstrated that lead exposure made the animals emaciated. Moreover, when the effect of lead on other systems was studied, our results showed a depletion of GSH stores and deleterious effects on renal parameters.
The LD50 through the intraperitoneal route (i.p.) in rats is 150 mg/kg for lead acetate and 200 mg/kg for lead acetate trihydrate [28], which is a more soluble form of the compound and is miscible with water [29]. Accordingly, the doses that we used represent the following percentages of LD50 of lead acetate trihydrate (Table 1). Since the LD50 of lead acetate trihydrate is 200 mg/kg i.e. being in the range of 50-500 mg/kg, this chemical is considered to be moderately toxic [30].
Regarding weight change, normal non-diabetic animals usually gain a significant amount of weight over time. However, our data showed that these diabetic rats maintained nearly the same weight throughout the six weeks post DM induction. The lack of normal increase in weight in these diabetic animals is most probably due to STZ exposure and diabetes.
Although the diabetic control rats maintained their weight during the five days of treatment, lead acetate treated groups lost significant amounts of their weight. This was most significant for the group that was treated with 100 mg/kg of lead acetate as these animals lost about 28% of their initial weight during the treatment period, compared to the control group. A previous study showed a similar effect of weight loss when animals were treated with 100 µL of 20 mg/kg of lead acetate i.p. for 5 days [25].
In regard with BLL, there was a very positive relationship in a dose-response manner between the administered doses of lead acetate and the measured BLL in plasma. The exposure to 25, 50, and 100 mg/kg of lead acetate resulted in BLL of 1228, 1498 and 2330 ppb, respectively. Using this conversion factor: 1 µg/dL = 10 ppb [31,32], the measured BLL in ppb in the three treatment groups equals 123, 150 and 233 µg/dL, respectively. In clinical settings, such BLL of more than 100 µg/dL are considered very high and would most probably result in severe lead poisoning [33].
In this study, we have demonstrated that lead exposure caused an elevation in TSH levels, which was statistically significant in the group that was treated with the highest dose i.e. 100 mg/kg of lead acetate. Determination of TSH levels in clinical settings is the first step for the diagnosis of thyroid disorders since it is considered to be a more precise marker for identifying thyroid malfunctioning than the thyroid hormones themselves [34]. Any abnormalities in TSH levels are followed by measuring T4 and T3 levels, which in our study were found to be significantly reduced. Apparently, lead exposure decreased T4 and T3 levels, and this in turn led to a positive feedback effect on the anterior pituitary gland increasing TSH secretion. The combination of high TSH and low T4 and T3 levels in our study are highly suggestive of a clinical hypothyroid state.
Both Type I and Type II Diabetes Mellitus are considered a risk factor for developing thyroid disorders [35]. A longitudinal clinical trial has shown that among 58 patients with Type I DM who were followed up for 18 years, 18 subjects developed hypothyroidism [36]. So, is hypothyroidism in our study caused by DM or lead exposure? It has been previously demonstrated that injecting rats with 100 mg/kg of STZ could cause a reduction in T4 and T3 levels 12 weeks later. However, the administration of smaller doses of 40, 60 and 80 mg/kg of STZ did not affect T4 and T3 levels [37]. Accordingly, the observed reduction in T4 and T3 levels in our study is most probably a direct result of lead exposure. although the animals in our study had DM for only 6 weeks, which is relatively a short duration of time, the contribution of DM cannot be completely ruled out completely.
Regarding oxidative stress markers, our data show a clear effect of lead exposure on GSH levels, which were significantly reduced. This can be explained by the fact that GSH protects our bodies from reactive oxygen species (ROS) through its sulfhydryl (SH) group, to which many reactive species and heavy metals (e.g. lead) can bind. This would eventually lead to a depletion of GSH stores and cause the various systemic toxicities of lead exposure such as hepatic and renal damage [38]. On the other hand, MDA, which is a ‘reliable marker’ and the ‘most mutagenic product’ of lipid peroxidation [39], was not affected in our study. However, in another study of a longer duration of exposure (six weeks), the treated Wistar rats with either 10 or 40 mg/kg of lead acetate by gavage had significantly high MDA levels [40].
Our results show that lead exposure had a direct toxic effect on renal functions leading to an increase in urea levels. Urea is an end-product of proteins’ degradation and is eventually filtered by the kidneys [41]. As such, our data are consistent with a recently published study which showed that treatment of mice with 40 mg/kg of lead acetate for 10 days resulted in an increase in urea levels [42]. Along with creatinine levels, urea is a commonly tested marker for renal functions [43]. On the other hand, the vast majority of creatinine comes from skeletal muscles and the heart [44]. Since creatinine levels are ‘roughly proportional to muscle mass’ [43], the most probable cause for the significantly low creatinine levels in these diabetic animals in our study is emaciation as the animals lost significant amounts of their weight and muscle bulk. On the other hand, in another study, when non-diabetic mice were exposed to 40 mg/kg of lead acetate over 10 days, this treatment resulted in an elevation in their blood creatinine levels [42].
In this study, short-term treatment of diabetic animals with various doses of lead acetate over five days did not affect hepatic parameters. These parameters included AST, CRP, total proteins and ALB levels.
In conclusion, in this study, treatment with lead acetate caused clear changes that are consistent with clinical hypothyroidism i.e. high TSH, and low T4 and T3 levels. Lead also reduced the levels of the essential antioxidant, GSH. In addition, lead exposure resulted in renal damage. The exact molecular mechanisms through which lead acetate causes these effects need to be elucidated.
Acknowledgements
We express our sincere thanks to Ms. Priya Yuvaraju for her technical help in carrying out this study.
Disclosure of conflict of interest
None.
References
- 1.ToxGuide for Lead 2007 [cited 2010 28/12] Available from: http://www.atsdr.cdc.gov/toxguides/toxguide-13.pdf.
- 2.Ford MD. Clinical Toxicology. Philadelphia: Saunders; 2001. pp. 723–733. [Google Scholar]
- 3.Public Health Statement for Lead. 2007 [cited 2010 19/09] Available from: http://www.atsdr.cdc.gov/phs/phs.asp?id=92&tid=22.
- 4.Patrick L. Lead toxicity, a review of the literature. Part 1: Exposure, evaluation, and treatment. Altern Med Rev. 2006;11:2–22. [PubMed] [Google Scholar]
- 5.Silbergeld EK. Preventing lead poisoning in children. Annu Rev Public Health. 1997;18:187–210. doi: 10.1146/annurev.publhealth.18.1.187. [DOI] [PubMed] [Google Scholar]
- 6.Diabetes. October 2013 [cited 2014 28/ 03] Available from: http://www.who.int/mediacentre/factsheets/fs312/en/
- 7.Malik M, Bakir A, Saab BA, King H. Glucose intolerance and associated factors in the multi-ethnic population of the United Arab Emirates: results of a national survey. Diabetes Res Clin Pract. 2005;69:188–195. doi: 10.1016/j.diabres.2004.12.005. [DOI] [PubMed] [Google Scholar]
- 8.Bloushi KA. Diabetes mellitus and periodontal disease in the United Arab Emirates. International Dental Journal. 2008;58:S248–S251. [Google Scholar]
- 9.Kadiyala R, Peter R, Okosieme OE. Thyroid dysfunction in patients with diabetes: clinical implications and screening strategies. Int J Clin Prac. 2010;64:1130–1139. doi: 10.1111/j.1742-1241.2010.02376.x. [DOI] [PubMed] [Google Scholar]
- 10.Díez JJ, Sánchez P, Iglesias P. Prevalence of thyroid dysfunction in patients with type 2 diabetes. Exp Clin Endocrinol Diabetes. 2011;119:201–207. doi: 10.1055/s-0031-1271691. [DOI] [PubMed] [Google Scholar]
- 11.Bathaie SZ, Sedghgoo F, Jafarnejad A, Farzami B, Khayatian M. Spectroscopic studies of STZ-induced methylated-DNA in both in vivo and in vitro conditions. Spectrochimica Acta Part A Mol Biomol Spectrosc. 2008;71:803–808. doi: 10.1016/j.saa.2008.02.002. [DOI] [PubMed] [Google Scholar]
- 12.Tesch GH, Allen TJ. Rodent models of streptozotocin-induced diabetic nephropathy. Nephrology (Carlton) 2007;12:261–6. doi: 10.1111/j.1440-1797.2007.00796.x. [DOI] [PubMed] [Google Scholar]
- 13.Rees DA, Alcolado JC. Animal models of diabetes mellitus. Diabet Med. 2005;22:359–70. doi: 10.1111/j.1464-5491.2005.01499.x. [DOI] [PubMed] [Google Scholar]
- 14.Rodgers CD, Noble EG, Taylor AW. The effect of STZ-induced diabetes on serum triiodothyronine (T3) and thyroxine (T4) levels in the rat: a seven week time course. Diabetes Research (Edinburgh, Scotland) 1994;26:93–100. [PubMed] [Google Scholar]
- 15.Maritim AC, Sanders RA, Watkins JB 3rd. Diabetes, oxidative stress, and antioxidants: a review. J Biochem Mol Toxicol. 2003;17:24–38. doi: 10.1002/jbt.10058. [DOI] [PubMed] [Google Scholar]
- 16.Kakkar R, Mantha SV, Radhi J, Prasad K, Kalra J. Increased oxidative stress in rat liver and pancreas during progression of streptozotocin-induced diabetes. Clinical Sci (Lond) 1998;94:623–632. doi: 10.1042/cs0940623. [DOI] [PubMed] [Google Scholar]
- 17.Zoeller RT, Tan SW, Tyl RW. General background on the hypothalamic-pituitary-thyroid (HPT) axis. Crit Rev Toxicol. 2007;37:11–53. doi: 10.1080/10408440601123446. [DOI] [PubMed] [Google Scholar]
- 18.Santi A, Duarte MM, Moresco RN, Menezes C, Bagatini MD, Schetinger MR, Loro VL. Association between thyroid hormones, lipids and oxidative stress biomarkers in overt hypothyroidism. Clin Chem Lab Med. 2010;48:1635–9. doi: 10.1515/CCLM.2010.309. [DOI] [PubMed] [Google Scholar]
- 19.Lassoued S, Mseddi M, Mnif F, Abid M, Guermazi F, Masmoudi H, El Feki A, Attia H. A comparative study of the oxidative profile in Graves’ disease, Hashimoto’s thyroiditis, and papillary thyroid cancer. Biol Trace Elem Res. 2010;138:107–15. doi: 10.1007/s12011-010-8625-1. [DOI] [PubMed] [Google Scholar]
- 20.Chaurasia SS, Kar A. Protective effects of vitamin E against lead-induced deterioration of membrane associated type-I iodothyronine 5’-monodeiodinase (5’ D-I) activity in male mice. Toxicology. 1997;124:203–209. doi: 10.1016/s0300-483x(97)00155-8. [DOI] [PubMed] [Google Scholar]
- 21.Gurer H, Ercal N. Can antioxidants be beneficial in the treatment of lead poisoning? Free Radic Biol Med. 2000;29:927–945. doi: 10.1016/s0891-5849(00)00413-5. [DOI] [PubMed] [Google Scholar]
- 22.Patrick L. Lead toxicity part II: the role of free radical damage and the use of antioxidants in the pathology and treatment of lead toxicity. Altern Med Rev. 2006;11:114–27. [PubMed] [Google Scholar]
- 23.Rahman S, Sultana S. Chemopreventive activity of glycyrrhizin on lead acetate mediated hepatic oxidative stress and its hyperproliferative activity in Wistar rats. Chem Biol Interact. 2006;160:61–69. doi: 10.1016/j.cbi.2005.12.003. [DOI] [PubMed] [Google Scholar]
- 24.Sleem M, Taye A, El-Moselhy MA, Mangoura SA. Combination therapy with losartan and L-carnitine protects against endothelial dysfunction of streptozotocin-induced diabetic rats. Eur J Pharmacol. 2014;744:10–17. doi: 10.1016/j.ejphar.2014.09.032. [DOI] [PubMed] [Google Scholar]
- 25.Abdel Moneim AE, Dkhil MA, Al-Quraishy S. The protective effect of flaxseed oil on lead acetate-induced renal toxicity in rats. J Hazard Mater. 2011;194:250–5. doi: 10.1016/j.jhazmat.2011.07.097. [DOI] [PubMed] [Google Scholar]
- 26.Nunes JA. A Simple Method Based on ICP-MS for Estimation of Background Levels of Arsenic, Cadmium, Copper, Manganese, Nickel, Lead, and Selenium in Blood of the Brazilian Population. J Toxicol Environ Health A. 2010;73:878–887. doi: 10.1080/15287391003744807. [DOI] [PubMed] [Google Scholar]
- 27.Ali MA, Kazzam E, Amir N, Nyberg F, Adem A. Effects of dehydration and blockade of angiotensin II AT1 receptor on stress hormones and anti-oxidants in the one-humped camel. BMC Vet Res. 2013;9:232. doi: 10.1186/1746-6148-9-232. [DOI] [PMC free article] [PubMed] [Google Scholar]
- 28.Material Safety Data Sheet, Lead Acetate, Trihydrate 2011, Carolina Biological Supply Company.
- 29.National Institute of Environmental Health Sciences, N.T.P. Report on Carcinogens. 12th edition. Research Triangle Park, N.C.: U.S. Dept. of Health and Human Services, Public Health Service, National Toxicology Program; 2011. [Google Scholar]
- 30.Final Contaminant List 3 Chemicals. 2009 [cited 2014 05/ 05] Available from: http://www.google.ae/url?sa=t&rct=j&q=&esrc=s&source=web&cd=2&ved=0CDoQFjAB&url=http%3A%2F%2Fwater.epa.gov%2Fscitech%2Fdrinkingwater%2Fdws%2Fccl%2Fupload%2FCCL3Chem_Screening_to_PCCL_08-31-09_508v2.pdf&ei=cFZnU4vrC6PR0QXj9oCYBQ&usg=AFQjCNE3Is6eJ30N4s1Jy7PkAbKlfHH7_w&sig2=y53jZvisXiwJranmb9IQYw&bvm=bv.65788261,d.d2k.
- 31.Odum HT. Heavy Metals in the Environment: Using Wetlands for Their Removal. Boca Raton: Lewis Publishers; 2000. [Google Scholar]
- 32.Thomas RJ, editor. Determining the link between trace metals and human disease. 2002 [cited 2014 03/ 02] Available from: http://pubs.acs.org/subscribe/archive/tcaw/11/i01/html/01thomas.html.
- 33.Pourmand A, Khedir Al-Tiae T, Mazer-Amirshahi M. Perspective on lead toxicity, a comparison between the United States and Iran. Daru. 2012;20:70. doi: 10.1186/2008-2231-20-70. [DOI] [PMC free article] [PubMed] [Google Scholar]
- 34.Pimentel L, Hansen KN. Thyroid disease in the emergency department: a clinical and laboratory review. J Emerg Med. 2005;28:201–9. doi: 10.1016/j.jemermed.2004.08.020. [DOI] [PubMed] [Google Scholar]
- 35.Duntas LH, Orgiazzi J, Brabant G. The interface between thyroid and diabetes mellitus. Clin Endocrinol (Oxf) 2011;75:1–9. doi: 10.1111/j.1365-2265.2011.04029.x. [DOI] [PubMed] [Google Scholar]
- 36.Umpierrez GE, Latif KA, Murphy MB, Lambeth HC, Stentz F, Bush A, Kitabchi AE. Thyroid dysfunction in patients with type 1 diabetes: a longitudinal study. Diabetes Care. 2003;26:1181–5. doi: 10.2337/diacare.26.4.1181. [DOI] [PubMed] [Google Scholar]
- 37.Hemmings SJ, Spafford D. Neonatal STZ model of type II diabetes mellitus in the Fischer 344 rat: characteristics and assessment of the status of the hepatic adrenergic receptors. Int J Biochem Cell Biol. 2000;32:905–919. doi: 10.1016/s1357-2725(00)00019-4. [DOI] [PubMed] [Google Scholar]
- 38.Gürer H, Ozgünes H, Neal R, Spitz DR, Erçal N. Antioxidant effects of N-acetylcysteine and succimer in red blood cells from lead-exposed rats. Toxicology. 1998;128:181–189. doi: 10.1016/s0300-483x(98)00074-2. [DOI] [PubMed] [Google Scholar]
- 39.Ayala A, Munoz MF, Arguelles S. Lipid peroxidation: production, metabolism, and signaling mechanisms of malondialdehyde and 4-hydroxy-2-nonenal. Oxid Med Cell Longev. 2014;2014:360438. doi: 10.1155/2014/360438. [DOI] [PMC free article] [PubMed] [Google Scholar]
- 40.Yan LC. In: Oxidative Damage of Cardiovascular System in Rats Following Lead Exposure, in Intelligent Structure and Vibration Control, Pts 1 and 2. Zhong SB, Cheng YM, Qu XL, editors. 2011. pp. 987–991. [Google Scholar]
- 41.Fenton RA, Knepper MA. Urea and renal function in the 21st century: insights from knockout mice. J Am Soc Nephrol. 2007;18:679–688. doi: 10.1681/ASN.2006101108. [DOI] [PubMed] [Google Scholar]
- 42.Li L, Zhang Y, Ma J, Dong W, Song Q, Zhang J, Chu L. Salvia miltiorrhiza Injection ameliorates renal damage induced by lead exposure in mice. ScientificWorldJournal. 2014;2014:572697. doi: 10.1155/2014/572697. [DOI] [PMC free article] [PubMed] [Google Scholar]
- 43.Ferguson MA, Waikar SS. Established and emerging markers of kidney function. Clin Chem. 2012;58:680–689. doi: 10.1373/clinchem.2011.167494. [DOI] [PMC free article] [PubMed] [Google Scholar]
- 44.Wyss M, Kaddurah-Daouk R. Creatine and creatinine metabolism. Physiol Rev. 2000;80:1107–1213. doi: 10.1152/physrev.2000.80.3.1107. [DOI] [PubMed] [Google Scholar]


