

Abstract
Primates are able to track small moving visual targets using smooth pursuit eye movements. Target motion for smooth pursuit is signaled by neurons in visual cortical areas MT and MST. In this study, we trained monkeys to either initiate or withhold smooth pursuit in the presence of a moving target to test whether this decision was reflected in the relative strength of “go” and “no-go” processes. We found that the gain of the motor response depended strongly on whether monkeys were instructed to initiate or withhold pursuit, thus demonstrating voluntary control of pursuit initiation. We found that the amplitude of the neuronal response to moving targets in areas MT and MST was also significantly lower on no-go trials (by 2.1 spikes/s on average). The magnitude of the neural response reduction was small compared with the behavioral gain reduction. There were no significant differences in neuronal direction selectivity, spatial selectivity, or response reliability related to pursuit initiation or the absence thereof. Variability in eye speed was negatively correlated with firing rate variability after target motion onset during go trials but not during no-go trials, suggesting that MT and MST activity represents an error signal for a negative feedback controller. We speculate that modulation of the visual motion signals in areas MT and MST may be one of the first visual cortical events in the initiation of smooth pursuit and that the small early response modulation may be amplified to produce an all-or-none motor response by downstream areas.
Keywords: decision-making, motion, movement, smooth pursuit, voluntary movement
the primate oculomotor system incorporates a number of strategies to detect and respond to retinal image motion. When gaze is fixed on a small moving object of interest, a voluntary eye movement called smooth pursuit rotates the eye to match angular target velocity. Smooth pursuit typically requires a visual stimulus; however, even in the presence of a moving target, voluntary effort or attention is required to fully initiate the response (Burke and Barnes 2011; Mulligan et al. 2013; Pola and Wyatt 1993; Wyatt and Pola 1987). Thus the sensory-motor transformation for pursuit might be characterized as a “switch” that gates activation of the motor system by appropriate sensory inputs. The switch could be implemented as a gain element that controls the ratio of eye speed to target speed and that changes from a small value during fixation to a larger value during pursuit. The change in gain could be stepwise or graded. Although much is known about the neural pathways for generating smooth pursuit, the mechanisms underlying the decision to initiate pursuit have not been fully determined. Elucidation of these mechanisms may reveal principles that apply to voluntary movement initiation in general.
The computation of target motion for smooth pursuit involves visual cortical areas MT and MST. These areas contain a high proportion of neurons that have direction- and speed-selective responses to moving visual targets prior to and during smooth pursuit. Some MST neurons also carry an extraretinal signal proportional to eye velocity (Newsome et al. 1988). Lesions of these areas impair smooth pursuit (Dürsteler et al. 1987), while electrical stimulation alters pursuit but does not evoke smooth eye movements during fixation (Groh et al. 1997; Komatsu and Wurtz 1989).
MT and MST project directly to frontal cortex, including the saccade (FEFsac) and smooth pursuit (FEFsem) regions of the frontal eye field (FEF). These areas also have cells that respond to visual motion in a direction- and speed-selective manner (Gottlieb et al. 1994; Xiao et al. 2006). Stimulation of FEFsem evokes smooth eye movements (Gottlieb et al. 1993, 1994; MacAvoy et al. 1991), while stimulation of the saccade region of the FEF can suppress pursuit (Izawa et al. 2011). MT and MST also project to the basilar pontine nuclei [dorsolateral pontine nucleus (DLPN), nucleus reticularis tegmenti pontis (NRTP)], which provide input to the cerebellum as well as to the nucleus of the optic tract (Mustari et al. 2009).
In this study, we trained monkeys to either initiate or withhold smooth pursuit in the presence of a moving target. In go/no-go paradigms monkeys decide whether to initiate pursuit or continue to fixate, and this decision may reflect the relative strength of “go” and “no-go” processes (Fukushima et al. 2011, 2013; Heinen et al. 2006, 2011; Kurkin et al. 2011; Schichinohe et al. 2009; Yang et al. 2010). We found that the gain of the motor response was reduced almost to zero when monkeys were instructed to withhold pursuit, thus demonstrating voluntary control. We found that the gain of neuronal responses to the moving target in MT and MST was also significantly reduced. The magnitude of the neural response modulation was small compared with the behavioral gain reduction. The enhanced response to target motion on go trials was associated with a negative correlation between eye speed fluctuations and neuronal activity. This correlation might reflect the computation of an error signal used in a negative feedback loop that drives smooth pursuit initiation.
We speculate that modulation of the gain of direction-selective responses in visual cortex is among the earliest cortical events leading to the initiation of smooth pursuit, and that it provides a biasing input to downstream areas that transform the initial bias into a full motor response. The initiation of smooth pursuit might be compared to the watershed of a river, small, early signals in sensory cortex being the rivulets whose contributions channel together to drive the motor output. Confirmation of this idea could help to resolve the issue of whether voluntary movement commands arise fully formed in the motor circuitry or are foreshadowed by weaker signals in sensory cortex.
MATERIALS AND METHODS
Experiments were performed on two adult male rhesus monkeys (Macaca mulatta). All methods were approved by the Institutional Animal Care and Use Committees at Columbia University, the New York State Psychiatric Institute, and the University of California, San Francisco. Monkeys were prepared for experiments by surgical implantation of a post used for head restraint, a recording chamber for positioning microelectrodes within the neocortex, and a monocular scleral search coil for recording eye position (Robinson 1963). Monkeys were trained to sit in a primate chair for the duration of the experiment with their heads restrained and to perform visual fixation and tracking tasks for liquid reward.
Visual stimulation.
Visual stimuli were generated and controlled by a CRS VSG2/3F video frame buffer. The output from the video board was displayed on a calibrated color monitor with a 60-Hz noninterlaced refresh rate. The spatial resolution of the display was 1,280 pixels by 1,024 lines. The central fixation target was a 0.5° white or yellow square, luminance 15 cd/m2, presented on a uniform dark background. Moving targets were 1.0° white squares, luminance 15 cd/m2. The frame buffer was programmed to send out digital pulses (frame sync) for timing purposes at the beginning of each video frame in which a target was turned on or off. These pulses were recorded by the computer with a hardware timer and stored together with the eye movement data.
Neuronal recording.
Recording chambers were placed at stereotaxic coordinates 5P, 15L. Neural activity was recorded extracellularly with Parylene-insulated or epoxy-coated tungsten microelectrodes (impedance 0.15–2.0 MΩ). Electrode penetrations were oriented in the coronal and sagittal planes such that the electrode passed first through the dorsal and then the ventral bank of the superior temporal sulcus (STS). Areas MT and MST were identified on the basis of depth relative to the pial surface and physiological characteristics. Upon completion of the experiments, both animals were euthanized and perfused with 4% paraformaldehyde. The brains were sectioned at 40-μm thickness on a freezing microtome. The sections were treated with a silver stain for myelin (Gallyas 1971) and examined microscopically for patterns of myelination associated with areas MT and MST (Maunsell and Van Essen 1983; Van Essen et al. 1981). Two parasagittal sections from monkey F are shown in Fig. 1. The sections are spaced 960 μm apart. Three electrode tracks (which were oriented close to the plane of sectioning) were reconstructed and can be seen to pass through MST on the dorsal/anterior bank of the STS and then into MT on the ventral/posterior bank. These results were typical and demonstrate that the orientation of electrode penetrations made it relatively straightforward to assign neurons to either MST or MT. Moreover, all neurons recorded on the dorsal/anterior bank of the STS were the dorsal subdivision of MST (MSTd).
Fig. 1.
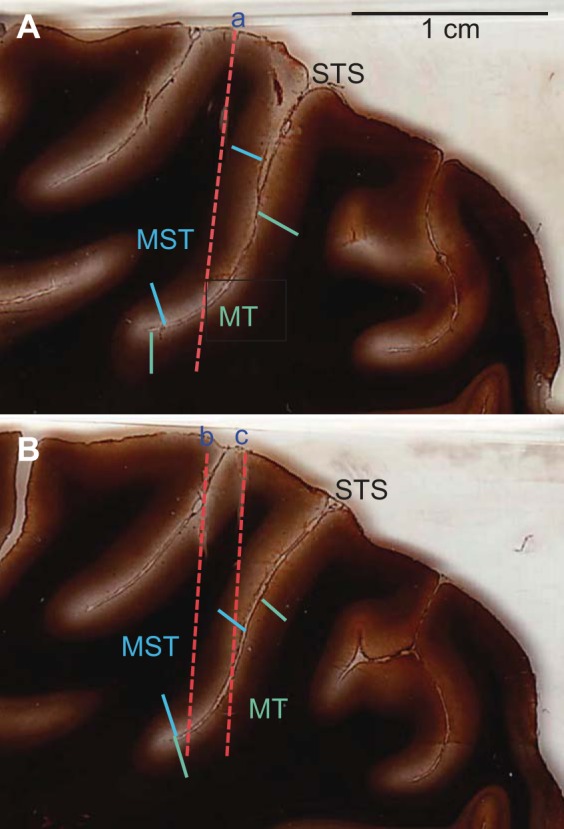
Histology. A and B: myelin-stained sections from 1 monkey showing electrode tracks (red dashed lines labeled a, b, c) in relation to dorsal medial superior temporal (MSTd) and middle temporal (MT) cortical areas. Blue lines show approximate borders of MSTd, while green lines show MT borders. STS, superior temporal sulcus.
Both MT and MST have a high proportion of direction-selective neurons but have strikingly different receptive field sizes (Albright and Desimone 1987; Komatsu and Wurtz 1988; Raiguel et al. 1997; Van Essen et al. 1981). Receptive fields were mapped with a handheld light projector while monkeys kept their eye fixed on a small LED to receive a reward. MST neurons had large receptive fields that often included the ipsilateral visual field. MT neurons had smaller receptive fields and were restricted to the contralateral visual field. Receptive fields did not overlap with the fixation target. The relationship between receptive field size and eccentricity had a slope of 0.69 for MT and 1.16 for MST (Ferrera and Lisberger 1997a).
Action potentials were detected with a time-amplitude window and converted to digital pulses with 0.1-ms precision. Spike trains were converted to spike density functions by convolving with a causal filter. The filter was an alpha function defined as a(t) = k × t × exp[(1 − t)/τ], with τ = 8 ms. The constant, k, was set to a value such that the time integral of a(t) was equal to 1.0.
To compute average firing rate for a given set of trials relative to a given event, spike times relative to event time were binned with 1-ms resolution to create a histogram of spike frequency (mean spike count) across trials. The spike probability histogram was smoothed by convolving with the alpha function described in the previous paragraph. The result was multiplied by 1,000.0 to convert to spikes per second. Variance was computed similarly except that mean spike count was replaced by the variance of the spike count in each histogram bin. To compute population averages, the mean firing rate and variance were averaged across cells.
Eye movement recording and analysis.
Eye position was monitored with a monocular scleral search coil system (CNC Engineering, Seattle, WA). The horizontal and vertical eye position signals were digitally sampled by computer at 1 kHz/channel and stored on disk for off-line analysis. Eye velocity was computed by convolving eye position with a digital filter. The filter was constructed by taking the first derivative of a temporal Gaussian, G(t), such that dG/dt = −k × t × exp(−t2/τ2), where τ = 8 ms and k is a constant that sets the overall filter gain to 1.0. This filter does not introduce any time delay between the position input and velocity output but adds temporal uncertainty to the velocity estimates. Horizontal [h′(t)] and vertical [v′(t)] eye velocities were combined to estimate radial eye speed [r′(t), where speed is the magnitude of the velocity vector] with the formula r′(t) = [h′(t)2 + v′(t)2]1/2.
Saccades that achieved radial eye speed greater than a criterion (30°/s or 10°/s, depending on the analysis) were detected by an automated procedure. For some analyses, saccades were deleted (the entire saccade was deleted, not just the portion above the threshold) and the eye velocity samples were replaced by interpolating between the eye velocity samples immediately before and after the saccade.
Behavioral task.
Monkeys were trained to initiate or withhold visual tracking of a small moving target presented in or near their central visual field (Fig. 2). At the start of each trial, a small square appeared in the center of the video display and the monkey had 600 ms to achieve fixation. After fixation was held for a random amount of time (200-1,800 ms), a moving target appeared a few degrees perifoveally and moved either toward or away from the center of the screen. The axis of target motion was not always along a radius relative to the fixation point. Rather, the axis was adjusted so that at least one direction of target motion was close to the cell's optimal direction.
Fig. 2.
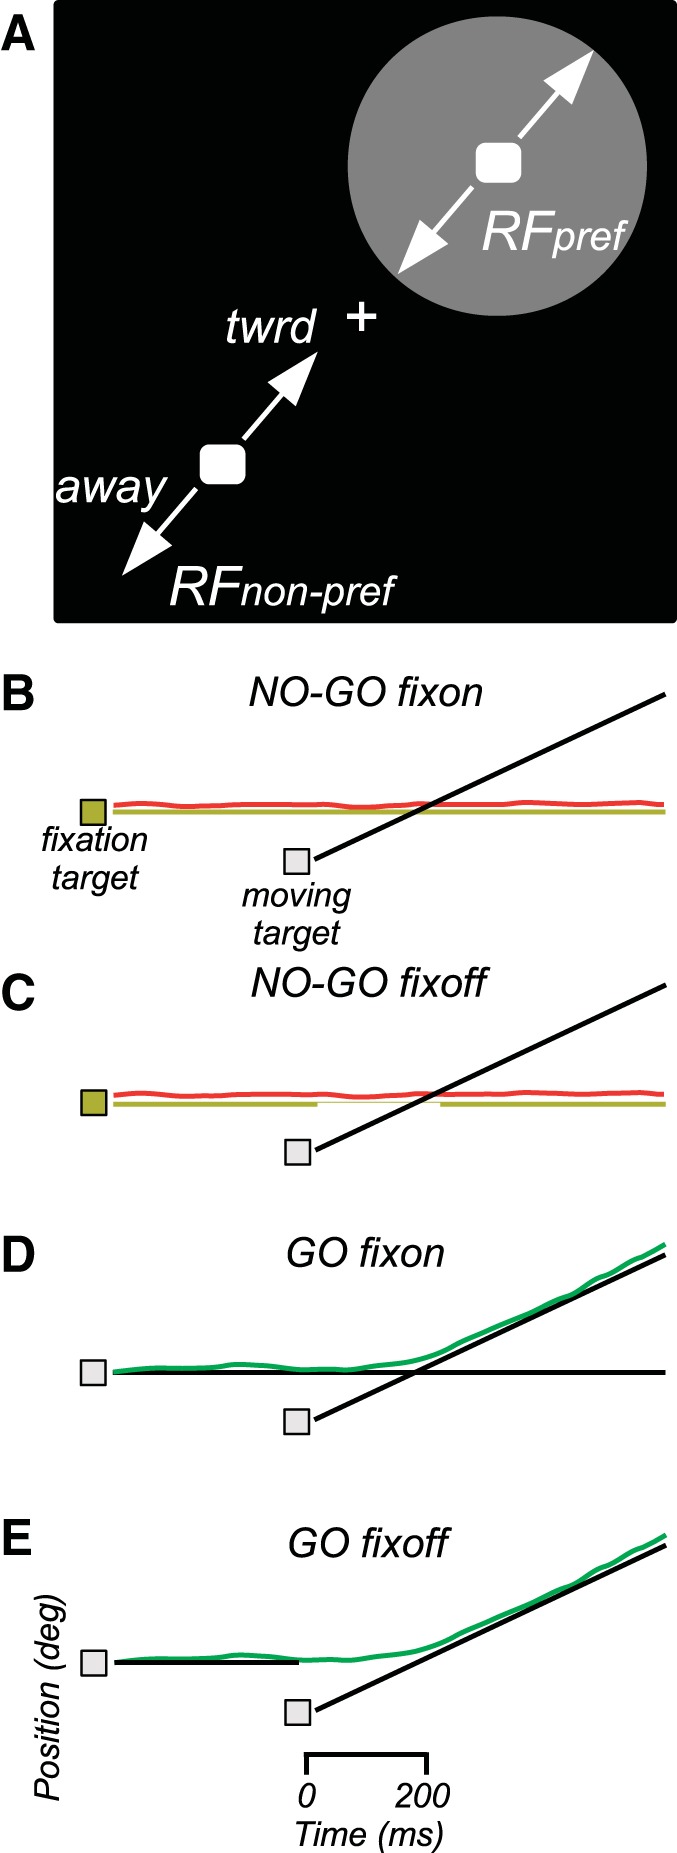
Task design. A: schematic of video display with targets for initial fixation and smooth pursuit. The gray circle suggests the size and location of a receptive field (RF) of a typical MT cell during initial fixation. B and C: target and eye position as a function of time for no-go trials. Yellow line is fixation target position (gap in C indicates when target is blanked for fixoff trials); black line is moving target position; red line is eye position. D and E: target and eye position for go trials. Black lines are fixation and moving target position; green line is eye position.
The initial position of the moving target was within the receptive field of the cell being recorded on half the trials, and at the opposite location on the other trials. “Target location” refers to the location at the onset of motion, unless otherwise indicated. MT and MST receptive fields were often large enough to have some response at both locations;, hence we refer to “preferred” and “nonpreferred” locations, rather than “inside” and “outside.” Thus there were two target locations (preferred/nonpreferred) and two directions of motion (toward/away). By randomizing target location and direction, this design minimizes anticipatory pursuit. The average initial target eccentricity was 4.0° (range: 1.0–10.8°). The speed of the moving target was chosen to evoke a strong response from the cell, but no attempt was made to optimize target speed. The average target speed was 10.3°/s (range: 3.8–19.2°/s).
Go and no-go trials were distinguished by the color of the initial fixation target, which was white on go trials and yellow on no-go trials. The luminance of both colors was the same (15 cd/m2). The fixation target color remained constant throughout the trial. For half the trials, the fixation target remained on for the entire trial (“fixon” trials). For the other half (“fixoff” trials), the fixation target was extinguished when the moving target appeared. The fixation target remained off for 200 ms on no-go trials and was then reilluminated. On go trials, the fixation target stayed off for the remainder of the trial. This manipulation was done to test whether leaving the fixation target on would bias the animal to maintain fixation whereas turning it off would bias the animal to initiate pursuit. The total number of trial conditions was 16 (2 initial target locations × 2 directions × go/no-go × fixon/fixoff).
The monkey was required to keep his eye position within ±2° of the fixation target. When the moving target appeared, the fixation requirement was turned off for 200–300 ms. After this grace period, eye position was again required to be within ±2° of the fixation target on no-go trials or within the same proximity to the moving target on go trials. These windows were large relative to the monkeys' typical fixation accuracy. The average fixation error (absolute value of eye position − target position) during the first 100 ms after the moving target appeared was 0.23° on no-go trials (0.13° SD, n = 7,491) and 0.27° on go trials (0.18° SD, n = 7,565).
On a small proportion of trials, monkeys failed to keep their eye position within these limits and the trial was terminated without reward. However, the behavioral constraints on eye position were lenient enough that unrewarded trials were extremely rare and generally occurred when the monkey failed to initiate a trial, looked away from the display in the middle of a trial, or otherwise disengaged from the task. We made no attempt to quantify the proportion of unrewarded trials or to analyze behavior or neural activity on such trials. All of the analyses below are based on correctly completed and rewarded trials. All correct trials were rewarded with an equal quantity of juice.
RESULTS
Behavior.
In this study, two male rhesus monkeys performed an eye tracking task in which they either initiated or withheld smooth pursuit in the presence of a moving target. Eye movements were analyzed to determine how well monkeys withheld pursuit when instructed to do so (“no-go” trials) and to determine an appropriate time window for comparing neural activity when monkeys initiated or withheld pursuit. The data were collected during 68 recording sessions (43 from monkey B, 25 from monkey F), one to three sessions per animal per day. The mean number of trials per session was 220 (14 repetitions of each trial condition, on average).
To estimate the latency and gain of smooth pursuit, we computed radial eye speed (see materials and methods) for each trial. We then normalized by dividing eye speed by target speed and then averaged over all trials in each session, keeping go and no-go trials separate. The normalized eye speeds for all sessions are plotted in Fig. 3A. On go trials, pursuit was initiated between 100 and 200 ms after the appearance of the moving target. On no-go trials, there was a slight increase in radial eye speed, peaking around 200 ms after target onset, but the maximum eye speed was much less than on go trials, indicating that monkeys were successful in withholding smooth pursuit.
Fig. 3.
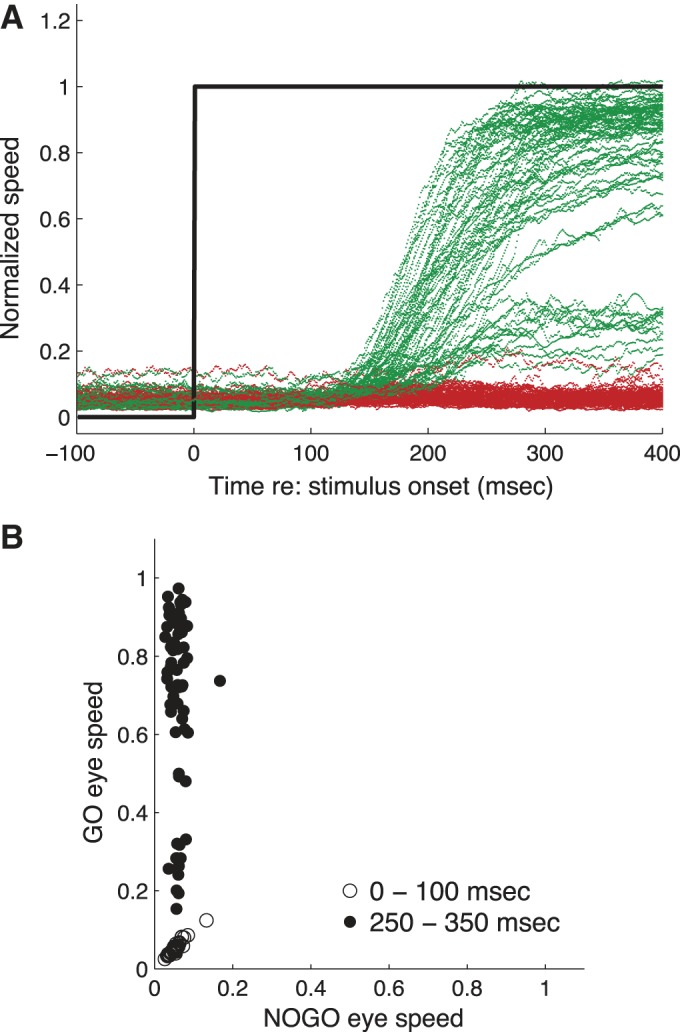
Eye movement behavior. A: normalized target speed (black line) and eye speed for go (green) and no-go (red) trials. B: average gain before (0–100 ms after target onset) and after (250–350 ms after target onset) pursuit initiation.
The gain of pursuit (eye speed/target speed) on go trials was generally <1.0 and was somewhat variable, with several sessions having gains <0.5. Some of this variability is likely due to differences in initial target location; more eccentric targets generally elicit weaker pursuit (Lisberger and Westbrook 1985). It is also possible that the gain of pursuit on go trials was reduced by the fact that go and no-go trials were randomly interleaved, requiring the animal to change its preparatory set each time the trial condition switched from go to no-go or vice versa, i.e., on about half of the trials.
We quantified the gain of pursuit by averaging normalized eye speed during two task epochs: 0–100 ms and 250–300 ms after target onset (Fig. 3B). During the earlier epoch, there was very little eye movement for either go or no-go trials [average normalized eye speed go-trials = 0.051 ± 0.002 (SE), no-go trials = 0.052 ± 0.002 (SE)] and the difference between go and no-go trials was not significant (P = 0.77, t-test paired by session). During the later epoch, the gain was nearly zero when monkeys were instructed to withhold pursuit (avg. gain no-go trials = 0.06 ± 0.003) compared with trials when monkeys were instructed to initiate pursuit (avg. gain go trials = 0.77 ± 0.024). This difference was significant (P < 10−30, t-test paired by session). On no-go trials the mean change in gain between the earlier and later epochs was 0.01 (P = 0.03, paired t-test), while for go trials the change in gain was 0.72 (P < 0.0001, paired t-test).
In the go/no-go paradigm, monkeys decide whether to initiate pursuit or continue to fixate. This decision may reflect the relative strength of “go” and “no-go” processes. To further manipulate this balance, we conducted 39 sessions in which the fixation target was either extinguished for 200 ms (fixoff) or remained illuminated (fixon) after the moving target appeared. Figure 4 shows eye speed (with saccades removed) averaged over the 39 sessions in which the fixon/fixoff manipulation was used. On go trials, pursuit was initiated an average of 18 ms later when the fixation target remained illuminated. Once initiated, pursuit eye speed followed a parallel time course on both fixon and fixoff trials, although after 400 ms pursuit gain remained 4.4% lower on fixon trials. The presence or absence of the fixation target had no significant effect on no-go trials. These results show that the net effect of the fixation target was to delay the onset of pursuit and reduce the gain, suggesting that the fixation (“no-go”) signal may not be fully extinguished after the onset of pursuit.
Fig. 4.
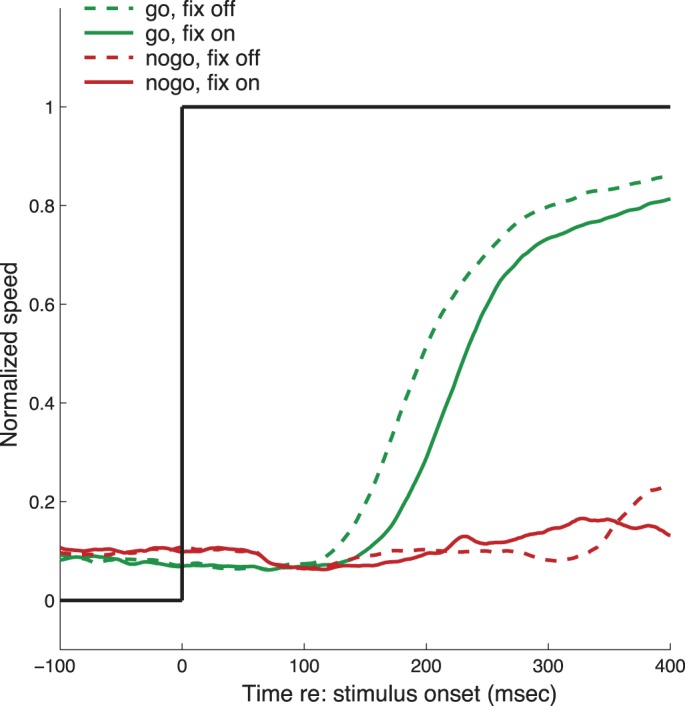
Comparison of normalized eye speed (eye speed/target speed) for all sessions with fixon and fixoff conditions.
Visual tracking of moving targets comprises smooth eye movement as well as corrective saccades. One might expect that the preparation to initiate or withhold pursuit would also affect the saccadic component. This expectation was confirmed. The frequency of saccades with peak velocities ≥30°/s that occurred in a time window ±100 ms around target onset was ∼1 per 20 trials and did not differ between “go” and “no-go” conditions (go: mean number of saccades = 0.053, no-go: mean = 0.055; paired t-test, P = 0.69, n = 68). However, if the eye velocity threshold was lowered to 10°/s to include smaller saccades, then the frequency of saccades was significantly higher on no-go trials (go mean = 0.21, no-go mean = 0.29; paired t-test, P < 0.0001, n = 68). Thus, prior to pursuit onset, saccades with peak velocities of at least 10°/s were more prevalent on no-go trials; however, their amplitude was significantly smaller (go mean saccade amplitude = 0.60°, no-go mean = 0.41°; t-test, P < 0.0001).
To examine saccades during pursuit initiation, we detected rapid eye movements with minimum velocity of 30°/s (this threshold was used to avoid including smooth eye velocity) in a window 100–200 ms after target onset. The frequency of saccades was many times greater on go trials (go mean number of saccades per trial: 0.62, no-go mean: 0.04; paired t-test, P < 0.0001, df = 67). The amplitude of each saccade was computed by integrating eye velocity during the saccade. To estimate the change in position due to pursuit, the saccade was deleted before integrating eye velocity. The net saccade amplitude was then calculated as the integral of the total eye velocity minus pursuit eye velocity. Saccades that occurred 100–200 ms after target onset were significantly larger on go trials (go mean amplitude = 2.52°, no-go mean = 0.62°; t-test, P < 0.0001). Thus saccade frequency and amplitude varied significantly with go/no-go condition prior to and during pursuit initiation. This raises two questions: 1) Did saccades occurring around the time of target onset affect neuronal activity? 2) Did neuronal activity predict saccade characteristics during pursuit initiation? These issues are addressed in the next section.
Neuronal responses.
To identify activity potentially related to the decision to initiate smooth pursuit, we recorded well-isolated action potentials from 68 neurons in MT and MST of two monkeys (MT: n = 30 cells, MST: n = 38 cells). The population response in MT began to deviate from baseline firing 47 ms after the appearance of the target in the receptive field. The population response in MST started 53 ms after target motion onset (Fig. 5). By comparison, smooth pursuit latencies were typically in the range of 100–150 ms (Fig. 3). Sixty cells (88%) had a significant change in response 50–150 ms after target onset compared with a baseline period 50 ms before to 50 ms after target onset (t-test, P < 0.05).
Fig. 5.
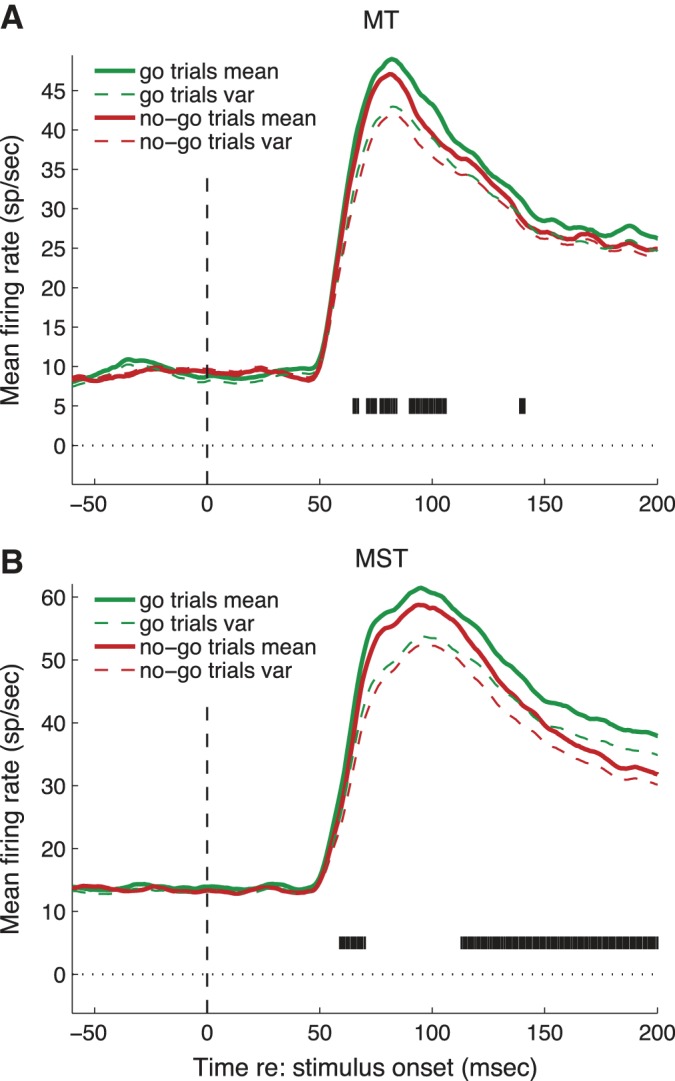
Time course of population response for all neurons. A: MT neurons. Green solid trace is activity (smoothed mean firing rate) during go trials, red is during no-go trials. Dashed lines are smoothed spike count variance. Black tick marks indicate individual time bins in which the firing rates were significantly different (t-test, P < 0.05) B: MST neurons, same conventions as A.
To examine the time course of activity in MT and MST, we computed spike density functions by convolving the spike train on every trial with a causal temporal filter (alpha function, see materials and methods). We then averaged the spike density functions for each cell, using only trials where the target initially appeared at the preferred location (inside the receptive field). We separated go and no-go trials but combined over the remaining conditions (target direction and fixation target on/off). The average population spike density functions were then computed by taking the mean spike density across all cells. This process estimates the effect of go and no-go conditions in the face of other sources of neuronal response variability. Figure 5 shows that the initial responses in both MT and MST were slightly stronger for go trials than for no-go trials.
To define an appropriate time epoch in which to analyze neural responses uncontaminated by image motion due to pursuit, we considered the behavioral results in Fig. 3. These show that pursuit was not initiated until at least 100 ms after target onset and that there was no significant difference in eye speed between go and no-go trials during the interval 0–100 ms after target onset. If we use conservative estimates of 80 ms after target motion onset as the time of the earliest pursuit eye movement and 40 ms as the minimum visual response latency of MT and MST neurons, then there is a time window of 120 ms after target onset within which retinal image motion due to pursuit cannot influence neuronal firing in MT and MST. In subsequent analyses, we consider only neural activity within this time window.
To quantify the response difference between go and no-go conditions, we computed the average firing rate on each trial (without smoothing or normalizing) within a window 50 to 120 ms after target motion onset. We also computed firing rate during a background period −70 to 0 ms relative to target onset. We then took the difference between the later and earlier firing rates as the evoked response for each trial. This response was averaged over all trials for each cell, keeping go and no-go trials separate. The mean response evoked on go trials vs. no-go trials is plotted for each cell in Fig. 6A. The distribution of differences (go minus no-go) is plotted in Fig. 6B (black bars). The average difference was 2.1 spikes/s and was statistically significant (P = 0.0002, paired t-test) for the entire population (n = 68). For MT, the average difference was 2.0 ± 0.71 spikes/s (P = 0.0045, paired t-test, n = 30). For MST, the average difference was 2.2 ± 0.78 spikes/s (P = 0.0049, paired t-test, n = 38). The average difference during a background period (−100 to 0 ms relative to target motion onset) was not significantly different from zero (Fig. 6B, gray bars). On a cell-by-cell basis, the percentage reduction [(go firing rate − no-go firing rate)/(go firing rate)] averaged 23%.
Fig. 6.
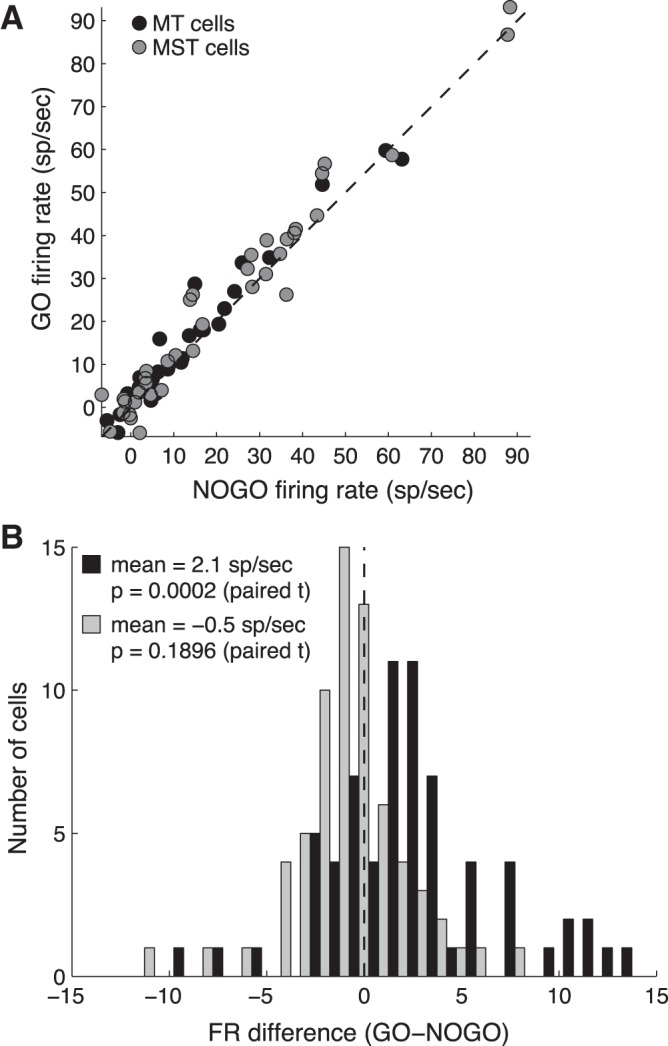
Average firing rate 50–100 ms after moving target onset. A: go vs. no-go trials. Each point is 1 cell. B: histograms of firing rate (FR) differences (go − no-go) during background (−100 to 0 ms relative to target motion onset) and stimulus (50–100 ms after target motion onset).
The average population response 50–120 ms after target onset was highly selective for initial target location and direction (Fig. 7A). For each target location and direction, there was a stronger response on go trials compared with no-go trials. A five-way ANOVA (dependent variables = firing rate, explanatory variables = cell, go/no-go condition, target initial location, target direction, and fixon/fixoff) showed significant effects (P < 0.005) for all factors except fixon/fixoff (Table 1). Location and direction selectivity, measured as the difference in firing rate between preferred and nonpreferred locations or directions, did not vary significantly between go and no-go trials. Direction and location selectivity were further examined by constructing receiver operating characteristic (ROC) curves to estimate the discriminability of preferred and nonpreferred locations and directions based on evoked firing rates. Area under the ROC curves did not depend significantly on go/no-go condition for target direction or initial location.
Fig. 7.
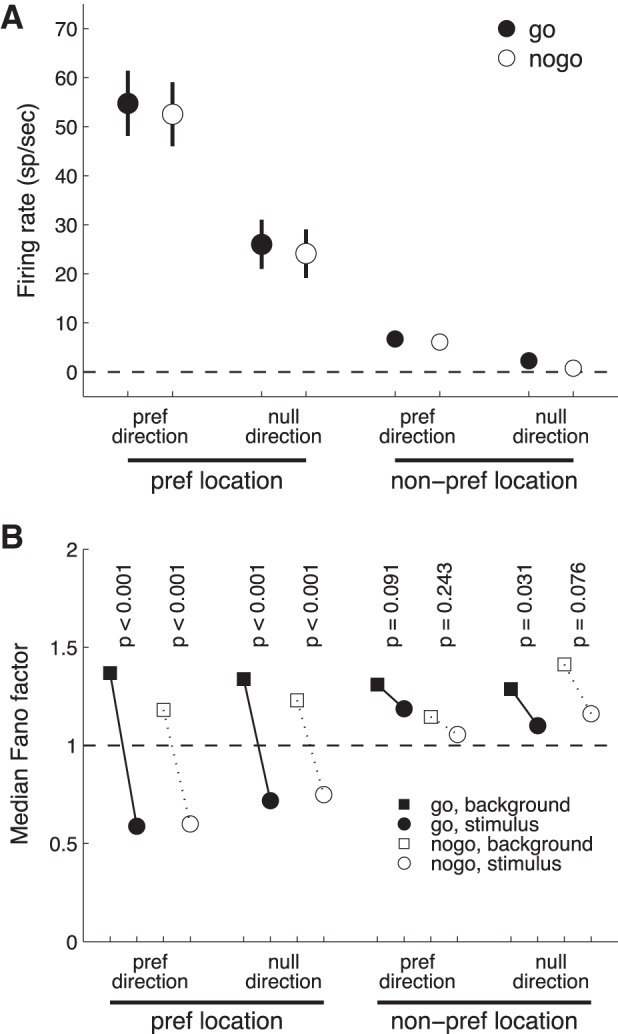
Mean firing rate and reliability. A: firing rate for go vs. no-go trials sorted by target location and direction. Error bars are ±1 SE. B: Fano factor.
Table 1.
Five-way ANOVA
| Factor | F | P | df |
|---|---|---|---|
| Cell | 56.5 | 0 | 67 |
| Go vs. no-go | 8.3 | 0.004 | 1 |
| Initial target location | 181.1 | 0 | 3 |
| Target direction | 262.7 | 0 | 1 |
| Fixon vs. fixoff* | 3.4 | 0.064 | 1 |
| Saccade presence* | 0.07 | 0.79 | 1 |
Two different 5-way models were used: one that included fixon/fixoff and one that included saccade presence/absence; all other explanatory variables (factors) were the same in both models. Firing rate was the dependent variable.
Analysis of eye movements revealed that, prior to pursuit initiation, saccades were more prevalent on no-go trials but were of smaller amplitude compared with go trials. To determine whether saccade amplitude affected firing rate, we detected saccades with minimum eye velocity of 10°/s in a window 50 ms before to 50 ms after target onset (this time window excludes the response to the moving target). Saccade amplitude was coded as 0 on trials in which no saccade was detected in this window. We ran a five-way ANOVA (Table 1; dependent variable = firing rate 50–120 ms after target onset, explanatory variables = cell, go/no-go condition, target location, direction, saccade presence). The effect of saccade presence on firing rate was not significant (P ≥ 0.05). Furthermore, there was no significant correlation between firing rate and saccade amplitude (Pearson's r = 0.005, P = 0.53, n = 14,947; note that the overall mean firing rate for each cell was subtracted from the firing rate on each trial prior to calculation of the correlation).
Smooth pursuit was delayed on trials in which the fixation target remained on when the moving target appeared (fixon trials) compared with trials in which the fixation target was extinguished (fixoff trials). Neuronal responses 50–120 ms after moving target onset were reduced during fixon trials by an average of 1.5 spikes/s compared with fixoff trials, but the reduction was not statistically significant (paired t-test, P = 0.0564, n = 39).
Previous studies have suggested that attention modulates the variability of neural firing in some visual areas (Mitchell et al. 2007). This was examined here by computing the Fano factor (variance divided by mean; Fano 1947) of spike counts during the initial target presentation (50 to 120 ms after target onset) and background (70 to 0 ms before target onset). For each cell, trials were sorted by go/no-go condition, target direction, and initial location. Conditions where the mean spike count was zero were excluded, as this results in an infinite Fano factor.
In several conditions (5/8), the stimulus-driven response had a significantly lower Fano factor than the background activity (Fig. 7B; P values are the result of 2-sided Wilcoxon rank sum test). Stimulus presence reduced the Fano factor even for conditions in which there was no change in the mean firing rate (i.e., null direction, nonpreferred location). These observations are consistent with a previous report (Churchland et al. 2010). Within each condition, we compared the Fano factors for go and no-go trials. There was no significant difference for any of the eight comparisons (P > 0.25, Wilcoxon rank sum test). For targets at the preferred location, the target onset-associated reduction in Fano factor was larger on go trials (average Fano factor difference, stimulus − background = −0.79) than no-go trials (average difference = −0.66). This difference in Fano factor reduction between conditions was not significant (paired t-test, P = 0.11, n = 68).
One explanation for the reduction in Fano factor after stimulus onset is that spike count regularity might depend on firing rate. To explore this, we plotted Fano factor as a function of spike count (Fig. 8). During the background period (Fig. 8A), the average Fano factor was 1.47 and had a broad distribution (SD = 0.76) with a long right tail. During the stimulus period (Fig. 8B), the Fano factor depended strongly on mean spike count and was typically below 0.5 for spike counts above 3.5 per 70 ms (50 spikes/s). Fano factors below 1.0 indicate that the trial-to-trial spike count variability is less than expected from a Poisson process. In neither the background period nor the stimulus period was there a significant difference in Fano factor between go and no-go conditions (t-test, paired by cell, background period P = 0.12, stimulus period P = 0.76), consistent with the results in the previous paragraph and Fig. 7.
Fig. 8.
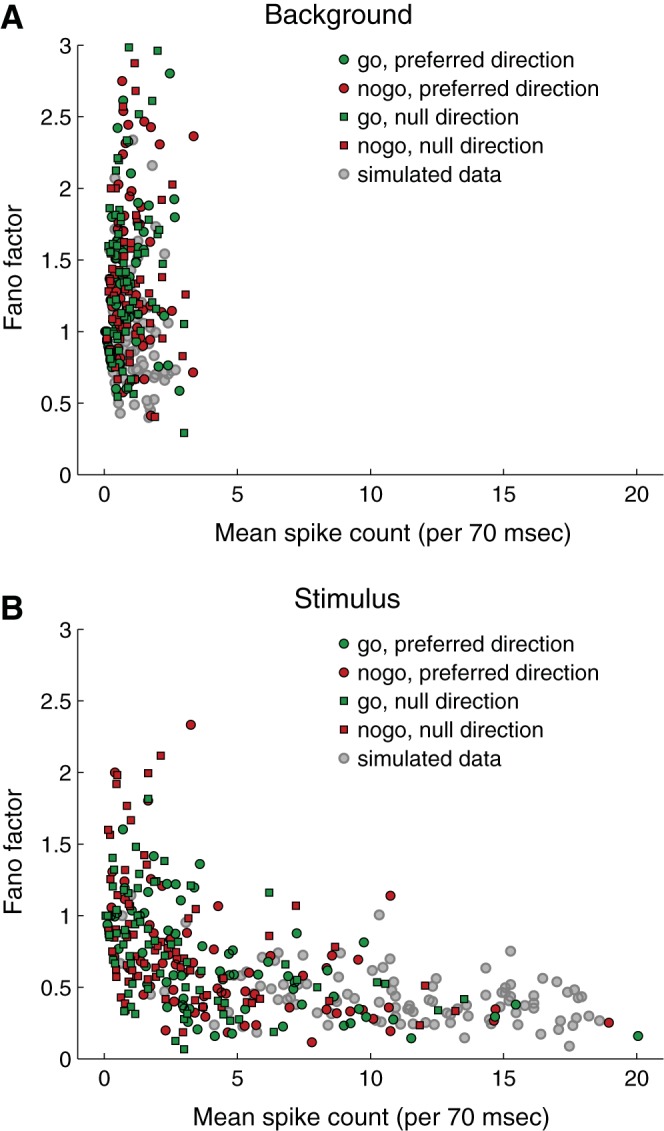
Fano factor as a function of spike count. A: background period (50 to 0 ms before target onset). B: stimulus period (50 to 100 ms after target onset).
To form an expectation about how ideal, randomly firing neurons might behave, given the parameters of our data and analysis, we ran simulations that generated random spike trains with the same range of average spike counts (5–300 spikes/s), duration (70 ms), and number of trials (14) as in our experiments. The simulated spike counts were Poisson distributed with mean Fano factor = 1.0. The Fano factor distributions for the simulated spike trains were broad (SD = 0.37) and had long right tails. Neither the mean Fano factor nor the shape of the Fano factor distribution depended on mean firing rate. We added an absolute refractory period to the spike train generator and found that refractoriness always decreased the mean Fano factor below 1.0.
The simulations suggest that some of the scatter in measured Fano factors seen in Fig. 8 is an expected consequence of sampling a random spike generation process in short (70 ms) time intervals. However, the mean Fano factor of 1.47 and standard deviation of 0.76 found in the background period data are both significantly higher than the values of 1.0 and 0.37, respectively, in the simulations. The spike count-dependent reduction of Fano factor below 1.0 that was observed in the data was also observed in simulations when a refractory period was included in the algorithm that generated the spike trains. In Fig. 8B, the gray circles represent Fano factor vs. spike count for simulated spike trains with a refractory period of 5 ms.
Previous studies have explored the relationship between fluctuations in MT activity and smooth pursuit velocity (Osborne et al. 2005). Hohl and Lisberger (2011) showed that small eye movements can drive activity in MT, while Lee and Lisberger (2013) reported that random variability of neuronal activity in area MT is correlated with variability in eye velocity during smooth pursuit. Schoppik et al. (2008) showed a similar relationship for frontal pursuit area activity and pursuit. Such correlations suggest a direct coupling between neurons and behavior. We examined this relationship in the present data set, restricting the analysis to trials in which the moving target appeared at the preferred location. We calculated the mean firing rate for each neuron and direction of target motion and then subtracted this mean from the firing rate on each trial, separating preferred and null directions. Horizontal and vertical eye velocity were combined to yield radial eye speed. Saccades were removed with a threshold of 30°/s.
The P values for the correlations, each weighted by the sign of the corresponding correlation coefficient, were log transformed [−ln(P)] and plotted in Fig. 9. For targets moving in the preferred direction (Fig. 9, A and B), there was a significant negative correlation between firing rate and eye speed fluctuations for go trials. For no-go trials, there are hints of a correlation for the preferred direction, but nothing was significant at the corrected P < 0.05 level. There were no significant (P > 0.05, Bonferroni corrected) correlations for the null direction (Fig. 9, C and D). These results show that both target direction and go/no-go condition modulate the noise correlations between neural responses in MT/MST and eye speed.
Fig. 9.

Significance of correlations between residual eye speed and firing rate. Color code represents −ln(P): yellow for positive correlations, blue for negative, Bonferroni corrected. The color bar indicates P values. A: go trials with target moving in the preferred direction. Vertical and horizontal lines represent time of target motion onset. Diagonal dashed line separates eye leading neuronal firing (above diagonal) from eye lagging firing (below diagonal). B: no-go trials, preferred direction. C: go trials, null direction. D: no-go trials, null direction.
If neural activity fluctuations drove eye movement variability, then the strongest correlations should be found for eye movement fluctuations following neural activity by ∼50 ms. In fact, the opposite was true. The time lag that produced the strongest negative correlations was when eye movement fluctuations occurred ∼50 ms prior to neural activity. This suggests that eye movements suppressed the neural response and is opposite to the effect found in the frontal pursuit area (Schoppik et al. 2008).
One way that eye movements can drive neural activity in MT and MST is by producing retinal image motion. If the noise correlations were the result of neuronal sensitivity to retinal image motion of the background scene, then they should be the same for a given time lag, i.e., the pattern of correlations should show up as a diagonal band spanning the entire time range in Fig. 9. This was not the case. Rather, the region of significant correlations starts ∼50 ms after target onset and tapers after pursuit onset. The correlations appear to be gated by the presence of the moving target.
To account for the lack of significant correlations on no-go trials, the retinal slip hypothesis would require that there be more variability in eye speed on go trials compared with no-go trials. In fact, the variance in eye speed, pooled over all sessions, was almost always greater on no-go trials. For example, in the time bin representing 50–100 ms after target onset for the neuronal response and 0–50 ms for the eye movement, the variance in eye speed was 4.89 (°/s)2 on go trials, compared with 5.62 (°/s)2 on no-go trials [F-test P = 0.031, df(go) = 728, df(no-go)= 729]. The appearance of negative correlations after target motion onset is consistent with the computation of an error signal in a negative feedback control system (Robinson et al. 1986) that computes the difference between target velocity and eye velocity. A simple model is presented in discussion to explain the timing and sign of these correlations.
As mentioned above, corrective saccades were more frequent on go than no-go trials. To address the possibility that enhanced neuronal responses on go trials might be related to the production of such saccades, we did the following analysis. First, we removed the smooth component of eye velocity, leaving only the saccades (the velocity threshold was 30°/s). Then we performed the correlation analysis described above using saccadic eye velocity rather than smooth eye velocity. We found no significant correlations at the P < 0.05 level (Bonferroni corrected). It is therefore unlikely that firing rate was either driving or driven by saccades.
DISCUSSION
How the brain initiates voluntary movements is still a profound mystery. Smooth pursuit eye movements present an excellent opportunity to shed light on this process because the behavior is easily quantified and the neural pathways are well defined (Ilg and Thier 2008). At what level of the sensory-motor circuit for pursuit are sensory signals converted to motor commands? Does this happen suddenly or gradually (either in terms of time or processing stages)? Movement initiation also provides an opportunity to study the neural mechanisms of simple decisions. Such decisions could be implemented by a modulation of mean firing rate, a reduction of variability, changes in selectivity or sensitivity, or a combination of these and other mechanisms.
The present results provide evidence for a large behavioral gain control and a small but reliable modulation of stimulus-evoked activity in visual areas MT and MST. The behavioral gain control is not like an on/off switch but appears to allow a continuum of gain values, like a dimmer switch. Smooth pursuit onset was delayed when the stationary fixation target remained on after the appearance of the moving target. Hence, fixating a visual target delays pursuit more than fixating without a target, as if there is an interaction between the visual fixation and pursuit targets, in addition to or instead of an interaction between fixation and pursuit responses.
Modulation of neuronal activity (go vs. no-go) was present from the beginning of the response to the visual target, which occurred ∼50 ms before the onset of the motor response. Thus there is sufficient time for a small modulation of direction-selective responses in visual cortex to be amplified into an all-or-none motor response by downstream structures in frontal cortex, cerebellum, or brain stem that are involved in generating smooth pursuit (Ilg and Thier 2008; Mustari et al. 2009). Target motion onset was also associated with a reduction in neural firing variability, and this reduction was slightly (but not significantly) greater preceding pursuit initiation. Negative correlations between eye speed and firing rate were found on go trials when the target moved in the preferred direction, supporting the idea that MT and MST are involved in computing an error signal for smooth pursuit initiation.
Previous studies.
There are only a few prior studies that have examined smooth pursuit in the context of a go/no-go task. Kurkin et al. (2011) recorded from MSTd during a go/no-go pursuit task and reported that there was no modulation of activity related to the go/no-go instruction, in agreement with the present finding that instruction has no effect on baseline activity. However, Kurkin et al. also found that nearly all MSTd cells in their sample responded after the onset of smooth pursuit and hence were not able to assess the modulation of response to a moving target prior to the initiation of pursuit. Yang et al. trained monkeys to make go/no-go pursuit decisions based on a visual cue (Heinen et al. 2011; Yang et al. 2010) and found that the decision altered activity in the supplemental eye field. Burke and Barnes (2011) used a go/no-go pursuit task in human subjects who underwent fMRI. They found that this task evoked differential activity in a number of areas involved in oculomotor control. However, they did not report modulation of the BOLD signal in human MT+. If the magnitude and duration of neural modulation in humans are comparable to those in monkeys, it may be too small and too brief to evoke measurable changes in cerebral blood flow or oxygenation.
Role of attention and preparatory set.
Smooth pursuit engages several cognitive processes including attention, decision-making, and prediction or preparation (Barnes 2008; Ferrera and Lisberger 1995, 1997b; Knox and Bekkour 2002). However, there are few reports on the role of voluntary attention specifically in smooth pursuit initiation. Wyatt and Pola (1987) distinguished between active and passive pursuit and noted that attention modulated the gain of the oculomotor response to moving targets. We have shown here that monkeys can voluntarily withhold smooth pursuit in the presence of a moving target. Because initial target position and direction of motion were randomized, it is unlikely that the monkeys were able to anticipate either property of the target. Therefore, they could not systematically deploy spatial attention or prepare a specific motor response before the target appeared. However, the moving target likely draws attention when it appears, and the strength of this orienting response may be modulated by the intent to initiate pursuit.
Attention modulates the activity of MT neurons during covert or overt tracking (Ferrera and Lisberger 1997a; Recanzone and Wurtz 2000; Siedemann and Newsome 1999; Treue and Maunsell 1996). However, the effect of attention on firing rate is often strongest during the later component of the response. The effect of attention on the initial visual response is typically very weak. Considering both the task design and the nature of attentional modulation in MT, it is more likely that the neural response modulation reported here is due to a general preparatory set for initiating or withholding pursuit but may also reflect covert spatial attention or movement planning.
Firing rate variability.
Trial-to-trial variability in firing rate can be quantified by the Fano factor (spike count variance divided by mean; Fano 1947). Several studies have reported that stimulus onset reduces Fano factor from a baseline level of about 1.3 or 1.4 to a value closer to 1.0, which is typical of a Poisson process (Churchland et al. 2010; Mitchell et al. 2009). Here, we found that stimulus onset reliably reduced variability across most conditions, even when there was no increase in mean firing rate, as reported by Churchland et al. (2010). We also found that stimulus-driven activity could be associated with Fano factors well below 1.0. This indicates that trial-to-trial firing was less variable than a Poisson process, an effect that was not reported by Mitchell et al. (2009) or Churchland et al. (2010).
Maimon and Assad (2009) also reported that firing rate variability in areas MT and MST was Poisson-like, whereas LIP and area 5 neurons were more regular (Fano factor < 1.0) as measured by interspike intervals and trial-to-trial spike count. The present study joins several others in reporting sub-Poisson variability in MT and MST (Bair and Koch 1996; Huang and Lisberger 2013; Osborne et al. 2004). In our hands, regularity in MT and MST increased with increasing spike count, an effect that is expected for spike trains with a finite refractory period. It should be noted that the mean firing rates evoked by preferred stimuli averaged >50 spikes/s in the present study, while the mean firing rates for MT in Churchland et al. (2010) and Maimon and Assad (2009) appear to be much lower (roughly 30 spikes/s). Hence, the stimulus or behavioral conditions in previous studies may not have driven the cells as strongly as in the present study.
Mitchell et al. (2009) reported that the reduction in firing variability associated with stimulus onset was enhanced by spatial attention. In the present study, we found that variability reduction occurred for both go and no-go trials and there was no significant difference between the two conditions. If changes in mean firing and variability are both characteristic of spatial attention, then the lack of a difference in variability argues against the notion that the neural modulation seen in this study is due to attention.
Noise correlations.
Fluctuations in neural activity in area MT and in the frontal pursuit area precede and may give rise to fluctuations in smooth pursuit velocity (Hohl and Lisberger 2011; Lee and Lisberger 2013; Osborne et al. 2005; Schoppik et al. 2008). It has also been reported that image motion due to small eye movements may drive responses in MT (Hohl and Lisberger 2011). Here, we found evidence for coupling between MT/MST activity and pursuit eye speed when the target was moving in the preferred direction of the neurons. Noise correlations between eye speed and firing rate were found only on go trials. Temporally, the effect arose only after target motion onset. Others have reported positive correlations such that increases in eye speed drive increases in firing rate, or vice versa. Here, we found that the correlations were negative.
The eye speed fluctuations were not produced by variability in firing rate. Rather, the timing of the effect shows that eye speed fluctuations were correlated with neural activity that occurred 50 ms later, approximately the visual latency of MT and MST neurons. The timing of the correlations was therefore consistent with a neuronal response to retinal image motion induced by eye movements during fixation. However, the fact that the correlations appeared only after the onset of the moving target suggests that they represent a response to target motion and not motion of the background image.
The sign and approximate timing of the noise correlations are consistent with the operation of a negative feedback control system believed to underlie the generation of smooth pursuit eye movements (Robinson et al. 1986). The error signal in this negative feedback controller is related to the difference between target velocity and eye velocity and could be represented by the firing of MT and MST neurons. Under certain conditions, the output of the controller (a command for eye velocity, y) will be negatively correlated with the error. To show this, we simulated a simple PID (proportional, integral, derivative) controller. The equations for the PID controller were
| (1) |
where e(t) is the error signal (image velocity), T′ is target velocity, and E′ is eye velocity. The control signal, y(t), is given by
| (2) |
where k is the overall feedback gain. The controller takes target velocity as input and produces eye velocity as output. The internal dynamics are governed by the time constants of the controller's integrator and differentiator (kI, kD) and also include sensory and motor time delays. This simulation is not intended as a realistic model of smooth pursuit. However, it suggests how the error signal and eye velocity can become negatively correlated.
Simulations were run under two conditions: high gain (k = 0.1, “go” trials; Fig. 10A) and low gain (k = 0.001, “no-go” trials; Fig. 10B; kI and kD did not vary between simulations). Independent Gaussian noise was added to the target velocity input and to the controller output (y), to represent sensory and motor variability. The two noise sources were uncorrelated. The correlation between the error and control signals was computed as a function of time relative to target motion onset. To simulate target motion input, the target velocity stepped from 0 to 1.0, creating an error signal, which the controller attempted to eliminate by increasing eye velocity. The presence of the error signal during pursuit initiation coupled with the high gain of the controller resulted in a negative correlation between the error and control signals as the increase in controller output worked to reduce the error (Fig. 10C).
Fig. 10.

Simulations of a negative feedback PID (proportional, integral, derivative) controller. A and B: target and eye velocity on high- and low-gain trials, respectively. C and D: correlations between controller error and eye velocity as a function of time (target motion onset at t = 50, horizontal and vertical solid lines). The color bar indicates correlation strength (r): yellow for positive, blue for negative.
When the gain was low (Fig. 10B), the error signal was present but eye velocity did not increase, probably because the controller output had little effect on the error. The result was that the error was uncorrelated with eye velocity (Fig. 10D). The sign and strength of the correlation between the error signal and eye velocity appear to be determined by the gain of the negative feedback. The negative correlation only appears during pursuit initiation when there is a sufficiently large error signal. Thus the correlations between eye velocity and firing rate can be explained if firing rate in MT and MST represents an error signal for smooth pursuit initiation, and the gain of the controller using that error signal is greater on “go” than “no-go” trials. Interpreted in the light of these simulations, the experimental results (Fig. 9) suggest that the gain of the controller depends on behavioral state (go/no-go) as well as target direction relative to the cells' preferred direction.
Conclusions.
The decision to initiate or withhold smooth pursuit in the presence of a moving target has a powerful effect on the gain of the behavioral response and a weaker, but reliable effect on the response of neurons in visual areas MT and MST. The decision does not affect the selectivity or reliability of the neurons. The neural modulation may be due to attention or the preparation of a specific motor response but may also reflect a nonspecific preparation to initiate or withhold pursuit. Activity in MT and MST may represent an error signal that is correlated with fluctuations in eye speed when the gain of the system that converts target velocity to eye velocity is large.
GRANTS
This work was supported by National Institute of Mental Health Grant MH-059244.
DISCLOSURES
No conflicts of interest, financial or otherwise, are declared by the author(s).
AUTHOR CONTRIBUTIONS
Author contributions: V.P.F. conception and design of research; V.P.F. performed experiments; V.P.F. analyzed data; V.P.F. interpreted results of experiments; V.P.F. prepared figures; V.P.F. drafted manuscript; V.P.F. edited and revised manuscript; V.P.F. approved final version of manuscript.
ACKNOWLEDGMENTS
The author thanks Stephen Lisberger for crucial support in the early stage of this project. Some experiments were conducted at the University of California, San Francisco, Department of Physiology.
REFERENCES
- Albright TD, Desimone R. Local precision of visuotopic organization in the middle temporal area (MT) of the macaque. Exp Brain Res 65: 582–592, 1987. [DOI] [PubMed] [Google Scholar]
- Bair W, Koch C. Temporal precision of spike trains in extrastriate cortex of the behaving monkey. Neural Comput 8: 1185–1202, 1996. [DOI] [PubMed] [Google Scholar]
- Barnes GR. Cognitive processes involved in smooth pursuit eye movements. Brain Cogn 68: 309–326, 2008. [DOI] [PubMed] [Google Scholar]
- Burke MR, Barnes GR. The neural correlates of inhibiting pursuit to smoothly moving targets. J Cogn Neurosci 23: 3294–3303, 2011. [DOI] [PubMed] [Google Scholar]
- Churchland MC, Yu BM, Cunningham JP, Sugrue LP, Cohen MR, Corrado GS, Newsome WT, Clark AM, Hosseini P, Scott BS, Bradley DC, Smith MA, Kohn A, Movshon JA, Armstrong KA, Moore T, Chang SW, Snyder LH, Lisberger SG, Priebe NJ, Finn IM, Ferster D, Ryu SI, Santhanam G, Sahani M, Shenoy KV. Stimulus onset quenches neural variability: a widespread cortical phenomenon. Nat Neurosci 13: 369–378, 2010. [DOI] [PMC free article] [PubMed] [Google Scholar]
- Dürsteler MR, Wurtz RH, Newsome WT. Directional pursuit deficits following lesions of the foveal representation within the superior temporal sulcus of the macaque monkey. J Neurophysiol 57: 1262–1287, 1987. [DOI] [PubMed] [Google Scholar]
- Fano U. Ionization yield of radiations. II. The fluctuations of the number of ions. Phys Rev 72: 26, 1947. [Google Scholar]
- Ferrera VP, Lisberger SG. Attention and target selection for smooth pursuit eye movements. J Neurosci 15: 7472–7484, 1995. [DOI] [PMC free article] [PubMed] [Google Scholar]
- Ferrera VP, Lisberger SG. Neuronal responses in visual areas MT and MST during smooth pursuit target selection. J Neurophysiol 78: 1433–1446, 1997a. [DOI] [PubMed] [Google Scholar]
- Ferrera VP, Lisberger SG. The effect of a moving distractor on the initiation of smooth-pursuit eye movements. Vis Neurosci 14: 323–338, 1997b. [DOI] [PubMed] [Google Scholar]
- Fukushima J, Akao T, Schichinohe N, Kurkin S, Kaneko CR, Fukushima K. Neuronal activity in the caudal frontal eye fields of monkeys during memory-based smooth pursuit eye movements: comparison with the supplementary eye fields. Cereb Cortex 21: 1910–1924, 2011. [DOI] [PMC free article] [PubMed] [Google Scholar]
- Fukushima K, Fukushima J, Warabi T, Barnes GR. Cognitive processes involved in smooth pursuit eye movements: behavioral evidence, neural substrate and clinical correlation. Front Syst Neurosci 7: 4, 2013. [DOI] [PMC free article] [PubMed] [Google Scholar]
- Gallyas F. Silver staining of Alzheimer's neurofibrillary changes by means of physical development. Acta Morphol Acad Sci Hung 19: 1–8, 1971. [PubMed] [Google Scholar]
- Gottlieb JP, Bruce CJ, MacAvoy MG. Smooth eye movements elicited by microstimulation in the primate frontal eye field. J Neurophysiol 69: 786–799, 1993. [DOI] [PubMed] [Google Scholar]
- Gottlieb JP, MacAvoy MG, Bruce CJ. Neural responses related to smooth-pursuit eye movements and their correspondence with electrically elicited smooth eye movements in the primate frontal eye field. J Neurophysiol 72: 1634–1653, 1994. [DOI] [PubMed] [Google Scholar]
- Groh JM, Born RT, Newsome WT. How is a sensory map read out? Effects of microstimulation in visual area MT on saccades and smooth pursuit eye movements. J Neurosci 17: 4312–4330, 1997. [DOI] [PMC free article] [PubMed] [Google Scholar]
- Heinen SJ, Hwang H, Yang SN. Flexible interpretation of a decision rule by supplementary eye field neurons. J Neurophysiol 106: 2992–3000, 2011. [DOI] [PMC free article] [PubMed] [Google Scholar]
- Heinen SJ, Rowland J, Lee BT, Wade AR. An oculomotor decision process revealed by functional magnetic resonance imaging. J Neurosci 26: 13515–13522, 2006. [DOI] [PMC free article] [PubMed] [Google Scholar]
- Hohl SS, Lisberger SG. Representation of perceptually invisible image motion in extrastriate visual area MT of macaque monkeys. J Neurosci 31: 16561–16569, 2011. [DOI] [PMC free article] [PubMed] [Google Scholar]
- Huang X, Lisberger SG. Circuit mechanism revealed by spike-timing correlations in macaque area MT. J Neurophysiol 109: 851–866, 2013. [DOI] [PMC free article] [PubMed] [Google Scholar]
- Ilg UJ, Thier P. The neural basis of smooth pursuit eye movements in the rhesus monkey brain. Brain Cogn 68: 229–240, 2008. [DOI] [PubMed] [Google Scholar]
- Izawa Y, Suzuki H, Shinoda Y. Suppression of smooth pursuit eye movements induced by electrical stimulation of the monkey frontal eye field. J Neurophysiol 106: 2675–2687, 2011. [DOI] [PubMed] [Google Scholar]
- Knox PC, Bekkour T. Non-target influences on the initiation of smooth pursuit. Prog Brain Res 140: 211–224, 2002. [DOI] [PubMed] [Google Scholar]
- Komatsu H, Wurtz RH. Relation of cortical areas MT and MST to pursuit eye movements. I. Localization and visual properties of neurons. J Neurophysiol 60: 580–603, 1988. [DOI] [PubMed] [Google Scholar]
- Komatsu H, Wurtz RH. Modulation of pursuit eye movements by stimulation of cortical areas MT and MST. J Neurophysiol 62: 31–47, 1989. [DOI] [PubMed] [Google Scholar]
- Kurkin S, Akao T, Shichinohe N, Fukushima J, Fukushima K. Neuronal activity in medial superior temporal area (MST) during memory-based smooth pursuit eye movements in monkeys. Exp Brain Res 214: 293–301, 2011. [DOI] [PMC free article] [PubMed] [Google Scholar]
- Lee J, Lisberger SG. Gamma synchrony predicts neuron-neuron correlations and correlations with motor behavior in extrastriate visual area MT. J Neurosci 33: 19677–19688, 2013. [DOI] [PMC free article] [PubMed] [Google Scholar]
- Lisberger SG, Westbrook LE. Properties of visual inputs that initiate horizontal smooth pursuit eye movements in monkeys. J Neurosci 5: 1662–1673, 1985. [DOI] [PMC free article] [PubMed] [Google Scholar]
- MacAvoy MG, Gottlieb JP, Bruce CJ. Smooth-pursuit eye movement representation in the primate frontal eye field. Cereb Cortex 1: 95–102, 1991. [DOI] [PubMed] [Google Scholar]
- Maimon G, Assad JA. Beyond Poisson: increased spike-time regularity across primate parietal cortex. Neuron 62: 426–440, 2009. [DOI] [PMC free article] [PubMed] [Google Scholar]
- Maunsell JH, Van Essen DC. The connections of the middle temporal visual area (MT) and their relationship to a cortical hierarchy in the macaque monkey. J Neurosci 3: 2563–2586, 1983. [DOI] [PMC free article] [PubMed] [Google Scholar]
- Mitchell JF, Sundberg KA, Reynolds JH. Differential attention-dependent response modulation across cell classes in macaque visual area V4. Neuron 55: 131–141, 2007. [DOI] [PubMed] [Google Scholar]
- Mitchell JF, Sundberg KA, Reynolds JH. Spatial attention decorrelates intrinsic activity fluctuations in macaque area V4. Neuron 63: 879–888, 2009. [DOI] [PMC free article] [PubMed] [Google Scholar]
- Mulligan JB, Stevenson SB, Cormack LK. Reflexive and voluntary control of smooth eye movements. Proc SPIE 8651: 86510Z, 2013. [Google Scholar]
- Mustari MJ, Ono S, Das VE. Signal processing and distribution in cortical-brainstem pathways for smooth pursuit eye movements. Ann NY Acad Sci 1164: 147–154, 2009. [DOI] [PMC free article] [PubMed] [Google Scholar]
- Newsome WT, Wurtz RH, Komatsu H. Relation of cortical areas MT and MST to pursuit eye movements. II. Differentiation of retinal from extraretinal inputs. J Neurophysiol 60: 604–620, 1988. [DOI] [PubMed] [Google Scholar]
- Osborne LC, Bialek W, Lisberger SG. Time course of information about motion direction in visual area MT of macaque monkeys. J Neurosci 24: 3210–3222, 2004. [DOI] [PMC free article] [PubMed] [Google Scholar]
- Osborne LC, Lisberger SF, Bialek W. A sensory source for motor variation. Nature 437: 412–416, 2005. [DOI] [PMC free article] [PubMed] [Google Scholar]
- Pola J, Wyatt HJ. The role of attention and cognitive processes. Rev Oculomot Res 5: 371–392, 1993. [PubMed] [Google Scholar]
- Raiguel S, Van Hulle MM, Xiao DK, Marcar VL, Lagae L, Orban GA. Size and shape of receptive fields in the medial superior temporal area (MST) of the macaque. Neuroreport 8: 2803–2808, 1997. [DOI] [PubMed] [Google Scholar]
- Recanzone GH, Wurtz RH. Effects of attention on MT and MST neuronal activity during pursuit initiation. J Neurophysiol 83: 777–790, 2000. [DOI] [PubMed] [Google Scholar]
- Robinson DA. A method of measuring eye movement using a scleral search coil in a magnetic field. IEEE Trans Biomed Eng 10: 137–145, 1963. [DOI] [PubMed] [Google Scholar]
- Robinson DA, Gordon JL, Gordon SE. A model of the smooth pursuit eye movement system. Biol Cybern 55: 43–57, 1986. [DOI] [PubMed] [Google Scholar]
- Schichinohe N, Akao T, Kurkin S, Fukushima J, Kaneko CRS, Fukushima K. Memory and decision-making in the frontal cortex during visual motion processing for smooth pursuit eye movements. Neuron 62: 717–732, 2009. [DOI] [PMC free article] [PubMed] [Google Scholar]
- Schoppik D, Nagel KI, Lisberger SG. Cortical mechanisms of smooth eye movements revealed by dynamic covariations of neural and behavioral responses. Neuron 58: 248–260, 2008. [DOI] [PMC free article] [PubMed] [Google Scholar]
- Siedemann E, Newsome WT. Effect of spatial attention on the responses of area MT neurons. J Neurophysiol 81: 1783–1794, 1999. [DOI] [PubMed] [Google Scholar]
- Treue S, Maunsell JH. Attentional modulation of visual motion processing in cortical areas MT and MST. Nature 382: 539–541, 1996. [DOI] [PubMed] [Google Scholar]
- Van Essen DC, Maunsell JH, Bixby JL. The middle temporal visual area in the macaque: myeloarchitecture, connections, functional properties and topographic organization. J Comp Neurol 199: 293–326, 1981. [DOI] [PubMed] [Google Scholar]
- Wyatt HJ, Pola J. Smooth eye movements with step-ramp stimuli: the influence of attention and stimulus extent. Vision Res 27: 1565–1580, 1987. [DOI] [PubMed] [Google Scholar]
- Xiao Q, Barborica A, Ferrera VP. Modulation of visual responses in macaque frontal eye field during covert tracking of invisible targets. Cereb Cortex 17: 918–828, 2006. [DOI] [PubMed] [Google Scholar]
- Yang S, Hwang H, Ford J, Heinen S. Supplementary eye field activity reflects a decision rule governing smooth pursuit but not the decision. J Neurophysiol 103: 2458–2469, 2010. [DOI] [PMC free article] [PubMed] [Google Scholar]