

Abstract
Mitochondrial autophagy, also known as mitophagy, is an autophagosome-based mitochondrial degradation process that eliminates unwanted or damaged mitochondria after cell stress. Most studies dealing with mitophagy rely on the analysis by fluorescence microscopy of mitochondrial-autophagosome colocalization. However, given the fundamental role of mitophagy in the physiology and pathology of organisms, there is an urgent need for novel quantitative methods with which to study this process. Here, we describe a flow cytometry-based approach to determine mitophagy by using MitoTracker Deep Red, a widely used mitochondria-selective probe. Used in combination with selective inhibitors it may allow for the determination of mitophagy flux. Here, we test the validity of the use of this method in cell lines and in primary cell and tissue cultures.
Keywords: astrocyte primary culture, autophagic flux, autophagy, flow cytometry, neurodegeneration, mitochondria, mitophagic flux, mitophagy, retina
Abbreviations: ΔΨ, mitochondrial membrane potential; 3MA, 3-methyladenine; Atg, autophagy-related; CCCP, carbonyl cyanide m-chlorophenyl hydrazone; Co, control; COX4I1, cytochrome c oxidase subunit IV isoform 1; CsA, cyclosporin A; E, embryonic day; EBSS, Earle's balanced salt solution; FIS, fisetin; HCQ, hydroxychloroquine; LC3, MAP1LC3/LC3; KO, knockout; MEFs, mouse embryonic fibroblasts; MTDR, MitoTracker Deep Red; MTOR, mechanistic target of rapamycin; NAM, nicotinamide; N+L, ammonium chloride + leupeptin; P, postnatal day; PARK2, Parkin RBR E3 ubiquitin protein ligase; PINK1, PTEN-induced putative kinase 1; PHEN, 1,10-phenanthroline; Rapa, rapamycin; TIMM23, translocase of inner mitochondrial membrane 23 homolog (yeast); TOMM20, translocase of outer mitochondrial membrane 20 homolog (yeast); TOMM40, translocase of outer mitochondrial membrane 40 homolog (yeast); WM, wortmannin; WT, wild type
Introduction
Selective mitochondrial autophagy, or mitophagy, is a cell process that specifically targets mitochondria to autophagosomes for subsequent degradation in lysosomes.1 Mitophagy is the only known pathway through which complete, damaged, and dysfunctional mitochondria are eliminated.2 The presence of mitochondria inside autophagosomes was observed more than 50 y ago3 and has more recently been demonstrated using fluorescence in vivo microscopy by Elmore and coworkers, who coined the term mitophagy.4,5 Mitophagy is responsible for the specific elimination of mitochondria during the maturation of erythrocytes, the only mature cells that are completely devoid of these organelles.6 It had been proposed that mitophagy is responsible for the disappearance of paternal mitochondria in the developing embryo,7,8 although this idea has been recently challenged.9
Mitophagy is most commonly induced in vitro in mammalian cells using the uncoupler CCCP (carbonyl cyanide m-chlorophenyl hydrazone), which reduces mitochondrial membrane potential (ΔΨm).10 Mitochondria are then targeted for lysosomal degradation, which requires the interaction of PARK2/PARKIN-PINK1 proteins. Following mitochondrial depolarization PINK1 is stabilized at the mitochondrial membrane where it recruits PARK2, which in turn ubiquitinates several proteins that target the mitochondria for degradation.11 Mitophagy can also be triggered by the activation of specific mitochondrial receptors; these are proteins that harbor a MAP1LC3/LC3 (microtubule-associated protein 1 light chain 3)-interacting region/LIR, which forms a bridge linking the mitochondria to the autophagosome.12 The most commonly described receptors are BNIP3,13,14 BNIP3L/NIX,15 yeast Atg3216 and FUNDC1.17 Other proteins implicated in mitophagy include AMBRA1,18 AMFR,19 SMURF1,20 HK1,21 VDAC22 and the small GTPase RHEB.23 Lipids also participate in the formation of bridges between mitochondria and autophagosomes. Cardiolipin, a lipid of the inner mitochondrial membrane, is externalized to the outer membrane, where it acts as an “eat-me” signal, triggering mitophagy.24 Several drugs have been shown to specifically induce mitophagy. For example, nicotinamide (NAM) promotes mitophagy through a mechanism dependent upon cyclosporin A (CsA), an inhibitor of the mitochondrial permeability transition pore, suggesting that mitochondria with low ΔΨ are specifically targeted for autophagic degradation.25 NAM-induced mitophagy is mediated by an increase in the NAD+/NADH ratio, which activates SIRT1, a protein that promotes cell survival and longevity.26 Mitophagy is also induced by fisetin, another activator of SIRT1.26
Despite the existence of different signals by which mitochondria are targeted for degradation, there is a lack of quantitative methods for the study of mitophagy. While mitophagy can be assessed by microscopy analysis of the LC3B colocalization with mitochondrial proteins and by western blot of mitochondrial proteins, these methods do not provide quantitative data. There is thus a great need for novel techniques for the accurate and rapid assessment of mitophagy. Here, we analyze the validity of a flow-cytometric assay of mitophagy using of MitoTracker Deep Red in combination with several of mitophagic and lysosomal inhibitors. Furthermore, we describe a new index for the measurement of mitophagy flux and analyze the utility of this index in comparing the activity of compounds that regulate mitophagy.
Results
Flow cytometry analysis of mitophagy in cell lines
CCCP is the most commonly used inducer of mitophagy in mammalian cells and is thought to exert its effects by reducing the mitochondrial membrane potential.10 We used low doses of CCCP to induce mitophagy in SH-SY5Y neuroblastoma cells, a Park2-expressing cell line. Mitochondrial population levels were determined by flow cytometry using MitoTracker Deep Red (MTDR) dye. (Fig. 1A) displays a typical histogram where CCCP induces a 20% decrease of MTDR fluorescence levels relative to untreated cells. Importantly, this decrease was prevented when the cells were treated with the lysosomal inhibitor hydroxychloroquine (HCQ, blue) 3 h before flow cytometry analysis. In cells that were cultured in the absence of amino acids (EBSS), a classical autophagy-inducing stimulus, MTDR fluorescence was decreased as compared with controls, an effect that was reversed by HCQ treatment (Fig. 1B). Interestingly this decrease in the fluorescence levels after CCCP was also observed when MTDR was incubated before the treatments, indicating that the fluorescence reduction was not due to reduced loading of the probe after CCCP treatment (Fig. S1A, B).
Figure 1.

Mitophagy induced by amino acid starvation and CCCP treatment in SH-SY5Y cells is blocked by lysosomal inhibition. SH-SY5Y cells were treated with CCCP (A) or EBSS (B) for the indicated times and also treated with the lysosomal inhibitor HCQ 3 h before analysis to block lysosomal degradation. MTDR was used to determine mitochondrial staining by flow cytometry. * Indicates comparisons between control (Co) and treatments (CCCP and EBSS). # Indicates differences between presence and absence of HCQ within treatments. * or #P < 0.05, ** or ##P < 0.01, *** or ###P < 0.001 (C) Western blot analysis for the indicated mitochondrial proteins in SH-SY5Y cells treated as above for the indicated times.
These findings were corroborated by western blot; both CCCP treatment and amino acid starvation decreased the levels of several mitochondrial proteins, including TOMM40 and COX4I1, an effect that was blocked by HCQ (Fig. 1C). The decrease in TIMM23 levels observed in response to amino acid starvation and CCCP treatment was not reversed by lysosomal inhibition, in agreement with autophagy-independent degradation of TIMM23 that occurs in several circumstances.27
Neither CCCP treatment nor amino acid starvation induced mitophagy in HeLa cells; no decreases in MTDR fluorescence levels were observed in response to either stimulus, meaning no change in mitochondria (Fig. 2A, B), although amino acid starvation induced a classical autophagy response determined by flow cytometry in HeLa GFP-LC3B cells (Fig. 2D), while CCCP did not induce autophagy in these cells (Fig. 2C). Ectopic expression of PARK2-GFP but not GFP in HeLa cells resulted in a reduction on MTDR staining indicating that PARK2 expression was necessary for mitophagy induction in HeLa cells after CCCP (Fig. S1C). The MTOR inhibitor rapamycin induced autophagy but not mitophagy in HeLa cells (Fig. S2A, B), while in SH-SY5Y cells, rapamycin had no effect on mitochondrial levels and failed to induce autophagy, despite inhibiting MTOR (Fig. S2C and D).
Figure 2.

Neither amino acid starvation nor CCCP induce mitophagy in HeLa cells. HeLa-GFP-LC3 cells were incubated with CCCP (A, C) or EBSS (B, D) for the indicated times. EBSS cells were treated with HCQ 3 h before analysis to block lysosomal degradation. Flow cytometry was used to determine MTDR staining (A, B) and to assess autophagy (with GFP quenching; C, D). * Indicates comparisons between control (Co) and treatments (CCCP and EBSS). # Indicates differences between presence and absence of HCQ within treatments. * or #P < 0.05, ** or ##P < 0.01, *** or ###P < 0.001
Together these data demonstrate that MTDR fluorescence determination by flow cytometry is an easy and reliable approach to determining MTDR fluorescence, and when used in conjunction with lysosomal inhibitors, constitutes a rapid method for measuring mitophagy.
Nicotinamide and fisetin induce mitophagy in a lysosomal-dependent manner
Although CCCP is the most widely used experimental inducer of mitophagy, other compounds such as nicotinamide, fisetin (FIS) and 1,10-phenanthroline (PHEN) have been also described as mitophagy inducers.2,25,47 We thus conducted mitophagy assays in SH-SY5Y cells treated with these inducers for 6 h (Fig. 3) and 24 h (Fig. S3). Both NAM and FIS reduced MTDR fluorescence, while PHEN had no effect (Fig. 3A). Importantly, the decrease in MTDR fluorescence levels induced by NAM and FIS was reversed by HCQ treatment, indicating that this effect is dependent on lysosomal activity (Fig. 3A; Fig. S3A). Moreover the decrease in MTDR fluorescence induced by CCCP, NAM, and FIS was attenuated by treatment with the vacuolar ATPase inhibitor bafilomycin A1 and by incubation with a combination of ammonium chloride and leupeptine after 24 h incubation (Fig. 3B, C; Fig. S3B, C). Interestingly all of these treatments also induced mitochondrial colocalization with autophagosomes, as detected by confocal microscopy and assessed by TOMM20 and LC3B profile analysis in confocal z planes (Fig. S4). Thus a plethora of different lysosomal inhibitors block mitochondrial mass reduction in the basal state and after mitophagy induction. Taken together, these findings indicate that NAM and FIS also induce mitophagy in a lysosomal-dependent manner and that these effects can be quantified by flow cytometry using MTDR.
Figure 3.

Nicotinamide and fisetin induce mitophagy in a lysosomal-dependent manner, an effect blocked by different lysosomal inhibitors. SH-SY5Y cells were incubated with NAM, FIS, PHEN, or CCCP for 6 h and mitophagy determined (A) after treatment with the lysosomal inhibitor HCQ 3 h before analysis, or in the continued presence of (B) bafilomycin A1 (BafA1) or (C) ammonium chloride+leupeptin (N+L). * Indicates comparisons between control (Co) and treatments. # Indicates differences between presence and absence of HCQ, BafA1 or N+L within treatments. * or #P < 0.05, ** or ##P < 0.01, *** or ###P < 0.001
Mitophagy is blocked by pharmaco- logical and genetic downregulation of autophagy
To further demonstrate that the observed decreases in MTDR fluorescence were indeed autophagy-dependent, we used transformed Atg5-KO mouse embryonic fibroblasts (MEFs) for our assay. As is shown in Figure 4A, EBSS and CCCP reduced the levels of MTDR in wild-type (WT) cells but not in Atg5-KO cells. Interestingly ectopic overexpression of Atg5-GFP restored mitophagy in Atg5-KO MEFs (Fig. S1D). Moreover, our assay was also useful to detect basal mitophagy, since Atg5-KO MEFs as well as cells treated for 48 h with wortmannin (WM) manifested increased MTDR levels (Fig. 4A and B). CCCP-induced reduction in MTDR fluorescence was also attenuated by WM and short-time 3-methyladenine (3MA) treatment (Fig. S1E), in agreement with the time-dependent effect of 3MA on type III PtdIns3K activity.28
Figure 4.

Mitophagy is inhibited in Atg5-KO mouse embryonic fibroblasts and in SH-SY5Y cells treated with WM and cyclosporin A. (A) WT and Atg5-knockout (KO) mouse embryonic fibroblasts (MEFs) were incubated in the absence or presence of EBSS and CCCP for the indicated times.* Indicates comparisons between control (Co) and treatments (CCCP, EBSS). # Indicates differences between WT and atg5-KO cells. (B) SH-SY5Y cells were treated for 24 h with 100 nM WM and then incubated in the absence or presence of CCCP for additional 24 h. * Indicates comparisons between control (Co) and CCCP. # Indicates differences between presence and absence of WM. * or #P < 0.05, ###P < 0.001. (C, D) SH-SY5Y cells were incubated in the absence or presence of CCCP or NAM for 6 h (C) and 24 h (D) and with the mitophagy blocker CsA and subjected to flow cytometry analysis of MTDR fluorescence. * Indicates comparisons between control (Co) and treatments, CCCP or NAM. # Indicates differences between presence and absence of CsA within treatments. * or #P < 0.05, ** or ##P < 0.01, *** or ###P < 0.001.
The mitochondrial matrix protein cyclophilin D, which is involved in the control of mitochondrial permeability transition and transmembrane potential, also appears to modulate mitophagy, as inhibition of this protein with CsA blocks mitophagy in hepatocytes, cardiac cells, and human fibroblasts.4,25,29,30 As expected, we found that CsA blocked the decrease in MTDR levels induced by CCCP and NAM (Fig. 4C, D). Taken together these data indicate that MTDR determination by flow cytometry is an effective, rapid, and reliable method for the quantitative analysis of mitophagy in several cell types in response to a range of mitophagy-inducing stimuli.
Determination of mitophagy in primary cells and tissues using flow cytometry
To validate our approach, we measured mitophagy in primary cultures of cells and tissue. In agreement with our findings in cell lines, treatment of primary cultures of mouse astrocytes with CCCP resulted in a decrease in MTDR fluorescence intensity, an effect that was abolished by the presence of CsA (Fig. 5A).
Figure 5.

Mitophagy assessment in primary cells. (A) Primary cultures of astrocytes were treated with 25 μM CCCP for the indicated times in the presence or absence of CsA. * Indicates comparisons between control (Co) and CCCP. # Indicates differences between presence and absence of CsA within treatments. (B, C) E13.5 retinas were incubated with EBSS (6 h), rapamycin (24 h) or CCCP (6 h), in the absence or presence of 3MA (B) or CsA (C), and were then dissociated and incubated with MTDR for flow cytometry analysis. * Indicates comparisons between control (Co) and treatments, EBSS or rapamycin. # Indicates differences between presence and absence of CsA or 3MA within treatments. * or #P < 0.05, ** or ##P < 0.01, *** or ###P < 0.001.
The retina is a particularly relevant model for the study of the central nervous system as it is readily accessible and can be maintained in organotypic cultures, in which cell-cell and cell-matrix interactions are preserved.31 We have previously described the fundamental role of autophagy in proper retinal development.32,33 To test the suitability of our method for the quantification of mitophagy in mouse retinas, we cultured embryonic retinas in the presence of CCCP, EBSS, and rapamycin (Fig. 5B, C) and found a decrease in the levels of MTDR fluorescence that was reversed by treatment with the autophagy inhibitor 3MA and the mitophagy inhibitor CsA (Fig. 5B, C). These findings show that MTDR determination by flow cytometry is a useful means of quantifying mitochondrial levels and mitophagy that can also be applied to primary cells and tissue cultures.
Mitochondrial mass is increased in the retina of a mouse model of retinitis pigmentosa
Finally, we validated our MTDR assay in a pathophysiological model. Retinitis pigmentosa is a retinal dystrophy that results in the death of retinal photoreceptor cells, the light-sensitive cells of this tissue.34 Patients with retinitis pigmentosa eventually become blind, and currently there is no effective therapy for this devastating condition. Pde6brd10/Rd10 mice are used as an animal model of this disease.35 In these mice, photoreceptor death begins at postnatal day P20, and is accompanied by molecular alterations in photoreceptor cells, including increased levels of oxidative stress and massive calcium accumulation.36
To determine whether mitochondrial levels are altered in these mice, we isolated retinas from WT and Pde6brd10 mice on P20 and P30 and evaluated MTDR fluorescence levels by flow cytometry. MTDR fluorescence levels were increased at both time points in Pde6brd10 versus WT animals (Fig. 6A). Western blot revealed increases in the levels of several mitochondrial proteins in Pde6brd10 mice, including COX4I1, TOMM20, and TOMM40, corroborating the increase in mitochondrial mass and suggesting that alterations in autophagy or mitophagy contribute to the pathophysiology of retinitis pigmentosa (Fig. 6B).
Figure 6.
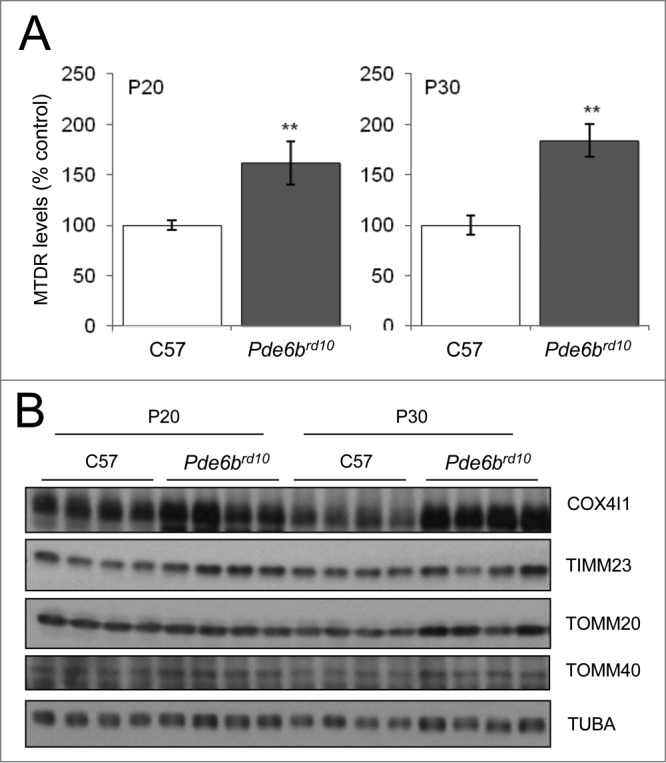
Increased mitochondrial levels in a mouse model of retinitis pigmentosa. Whole retinas from WT and Pde6brd10 mice were isolated on postnatal d 20 and 30. They were then dissociated and incubated with MTDR for flow cytometry analysis (A) or analyzed by western blot for the presence of the indicated mitochondrial proteins (B). *Indicates comparisons between C57 and Pde6brd10. **P < 0.01.
Determination of mitophagy flux
We defined “mitophagy flux” as the ratio of MTDR fluorescence in the presence of mitophagy and lysosomal inhibitors to that in the absence of inhibitors, normalized to the corresponding value in control cells. The mitophagy flux for CCCP, in the presence of different lysosomal and mitochondrial inhibitors, is shown in (Fig. 7A). By comparing mitophagy flux with autophagy flux we found that in certain cell lines, such as HeLa, EBSS did not induce mitophagy (Fig. 7B), although autophagy flux was observed (Fig. 7C), suggesting that mitochondria may be specifically excluded from the autophagic pathway. This phenomenon was not observed in SH-SY5Y cells, in which amino acid starvation induced productive mitophagy. Interestingly, the MTOR inhibitor rapamycin failed to induce mitophagy flux in either cell line, despite increasing autophagic flux in both cell types (Fig. 7C; Fig. S2D).
Figure 7.

Mitophagy and autophagy flux determinations. Mitophagy flux for CCCP, EBSS, and rapamycin (Rapa) in SH-SY5Y cells (A) and HeLa cells (B) in the presence of the indicated inhibitor. Autophagy flux in HeLa cells treated with EBSS and rapamycin with HCQ (C).
Discussion
We describe a new flow cytometry-based method to assess mitophagy, which can be combined with protease inhibitors for rapid, reproducible, and robust quantification of mitophagic flux in cell lines and in primary culture of cells and tissues. Moreover, we use this approach to demonstrate defects in mitophagy in a mouse model of retinitis pigmentosa, providing a proof of concept of this novel method.
Several approaches have been used to monitor mitophagy in yeast37 and in mammalian cells.38 Fluorescence microscopy imaging is the approach most commonly used for the evaluation of mitophagy. This method determines colocalization of mitochondria-specific dyes with the autophagosomal marker GFP-LC3 in living or fixed cells in combination with immunofluorescence for mitochondrial, autophagosomal, and lysosomal antibodies.39 However, unless lysosomal degradation is blocked, mitochondrial turnover occurs very rapidly, and colocalization events are rare.40 These approaches thus need to be combined with sophisticated image analysis in order to detect a sufficient number of mitochondria/autophagosome colocalization events. Moreover, the aforementioned methods do not provide a measure of effective mitophagy because defects in lysosomal degradation also increase colocalization. Similarly, the determination of autophagic activity from LC3 levels requires comparison with the levels found in the same cells when treated with protease inhibitors.41 A recent study describes the assessment of mitochondrial turnover using the fluorescent timer MitoTimer,42 however this method needs efficient transfection, as well as treatment of the cells with doxicyclin to induce the expression of the probe. Electron microscopy can also be used to study mitochondrial ultrastructure and the engulfment of mitochondria by autophagosomes. However, quantification often involves tedious and time-consuming morphometric analyses of large numbers of cells in order to obtain statistically relevant numbers. The development of a simple, quantitative method thus represents a major advance in the field of mitophagy research.
MitoTracker probes are lipophilic cations that include a chloromethyl group and a fluorescent moiety. They concentrate in mitochondria due to their negative charge and react with the reduced thiols present in mitochondrial matrix proteins. After this reaction the probe can be fixed and remains in the mitochondria independent of altered mitochondrial function or mitochondrial membrane potential.43,44 Our flow cytometry-based method determines mitophagy using the membrane mitochondrial dye MTDR by comparing the fluorescence levels per cell in the presence and absence of lysosomal inhibitors. We demonstrate that incubation with several mitophagy inducers results in a decrease in the fluorescence that is reversed in the presence of lysosomal inhibitors. Furthermore we also show that the decrease observed in fluorescence also occurs when the probe is preloaded into the cells before the experimental manipulations and thus reflecting real mitochondrial population levels and not merely changes in mitochondrial membrane potential.
Our method also reveals that only mitophagy-competent cells show some degree of basal mitophagy, as they increase the MTDR fluorescence levels in the presence of HCQ, bafilomycin A1, and N+L although to different extents, probably due to the particular mechanisms of action of each inhibitor. In addition we show that autophagy inhibition with wortmannin increases MTDR fluorescence levels indicating that SHSY-5Y cells have some degree of basal autophagy. However, autophagy inhibition with 3MA did not increase MTDR staining due probably to the short incubation time that has to be used with this particular inhibitor in order to block and not to induce autophagy.28 In agreement with this, we only observed the effect of WM in basal autophagy when cells were treated for more than 24 h with the inhibitor, suggesting low levels of basal autophagy in SHSY-5Y cells. Basal autophagy was also observed after Atg5-deficiency, thus indicating that a robust and chronic autophagy block is needed to observe basal mitophagy.
Our approach provides several advantages over currently used methods: it can rapidly analyze large numbers of cells, and by combining dyes with differential spectral properties, it can be used to simultaneously analyze multiple parameters. For example it can be combined with selective probes to assess levels of free radicals, cell viability or mitochondrial membrane potential. Combination of several mitochondrial probes has also been done in the initial mitophagy assessment by the group of Lemasters, where they use MitoTracker Green quenching by the membrane potential dependent die TMRM,4 and evaluate CsA dependent mitochondria depolarization and how mitochondria are located into LysoTracker-positive vesicles, however as this is evaluated by fluorescence microscopy it lacks the robustness and quantitation of our flow cytometry analysis. Moreover, in our method comparison of mitochondrial levels in the absence and presence of protease inhibitors allows the determination of mitophagic flux. As no transfection is necessary, this approach can be easily applied to tissues and cells that are difficult to transfect, such as primary cultures, and avoids the commonly observed side effects of autophagy induction after transfection or viral transduction.41 Additionally, this method dispenses with the need for image analysis, which requires sophisticated and expensive software. In order to exploit the maximum benefits of this assay and to decrease variability among treatments we suggest either to wash the probe after incubation or to minimize the time differences between samples. Furthermore, when testing new compounds and to avoid alterations on MitoTracker loading, we also recommend validating the results by performing experiments adding the probe before the treatments. Finally, the combination with autophagy and lysosomal inhibitors is necessary to confirm that indeed mitochondria are degraded by autophagy.
This method has pitfalls inherent to the chemical properties of the MitoTracker dyes. First, the electrophilic properties of the chloromethyl group allow its covalent reaction with nucleophilic amino acids (i.e. the cysteine residues of proteins).45,46 Thus MTDR staining can bind to and modify the activity of cysteine containing proteins in mitochondria. This issue can be partially resolved by performing the staining after treatments. Second, since the probe reacts with the thiols present in selected proteins such as HSPD1/Hsp60,45,46 changes that could affect the levels of those proteins or their redox status should be taken into account. The use of various combinations of lysosomal and mitophagy inhibitors could help minimizing this issue. Lastly, mitochondrial biogenesis can mask mitophagy assessment by MTDR, so this technique should be used for short periods of time, when there is mitophagy but not enough time for compensation by mitochondrial biogenesis.
We validated this approach using a variety of inducers of mitophagy, in addition to the commonly used but rather nonphysiological mitophagy inducer CCCP. We first demonstrated that NAM induces mitophagy even at short incubation times, in agreement with previously findings in long-term cultures of human primary fibroblasts.26 However, these effects may be cell type-dependent, as NAM did not induce mitophagic flux at longer incubation times, nor in embryonic mouse retinas (data not shown). We also tested the effects of phenanthroline, which has been proposed to induce mitophagy in a fission-dependent manner but failed to induce productive mitophagy in our experimental conditions.47 The MTDR-based mitophagy assay is reproducible in more physiological settings, such as astrocyte primary cultures, in which CCCP-induced mitophagy was blocked by CsA treatment. By contrast, NAM did not induce mitophagy in astrocytes under our experimental conditions (data not shown). Further studies will be necessary to elucidate the mitophagic pathways associated with individual inducers of this process.
While specific mitochondrial elimination by autophagy has been described during erythrocyte maturation6 it remains unknown whether or how mitophagy participates in other developmental processes, in which complete mitochondrial elimination is not observed. While our findings suggest that mitophagy participates in retinal development, further studies will be required to elucidate this putative role.
Mutations in PINK1 and PARK2 are associated with familial Parkinson disease, suggesting a possible role of mitophagy in this disease.48 Moreover, deregulation of mitochondrial quality control is the principal suspect in PARK2- and PINK1-related autosomal recessive Parkinson disease. Several other neurodegenerative conditions have been also linked to alterations in mitochondria and mitochondrial function, although it remains to be determined whether these changes are due to deregulation of mitophagy.49 We observed an increase in the levels of several mitochondrial proteins in retinal extracts from Pde6brd10 mice during the degenerative phase. In these mice retinal photoreceptors (the light-sensitive cells in the retina) begin to die around P15, leading first to night vision loss and later photopic vision loss due to cone death. While increased oxidative stress has been reported in Pde6brd10 mice50 further studies are required to determine whether this is associated with defective mitophagy. It has been proposed that alterations in calcium homeostasis are linked to mitophagy signaling; as calcium overload is one of the manifestations in retinitis pigmentosa, this finding further suggests a link between altered mitophagy and the pathophysiology of this disease.51
We tested the ability of 2 classic inducers of autophagy (amino acid starvation and CCCP) to increase mitophagic flux using our approach. We found that amino acid starvation induced mitophagic flux in SH-SY5Y but not HeLa cells, despite increasing autophagic flux in both cell lines. In this sense, HeLa cells appear to be similar to MCF-7 cells, in which mitochondria are specifically excluded during early (up to 30 h) starvation; a previous study using a proteomic approach has found no mitochondrial proteins inside autophagosomes before that time point.52 and it has been suggested that mitochondrial elongation may participate in this mitochondrial exclusion of “bulk” autophagy during starvation.53 We have shown that PARK2 overexpression in HeLa cells can restore CCCP-mediated mitophagy. Interestingly however, we found that rapamycin failed to induce mitophagy even in PARK2-competent (SH-SY5Y) cells, despite robustly inducing autophagy. This indicates that not all autophagy inducers can promote mitophagy, suggesting the existence of specific processes and pathways that mediate this process.
In summary, we have developed and validated a highly reproducible method to determine mitophagy using MitoTracker Deep Red. When used in combination with inhibitors of autophagy and mitophagy, this method allows for the determination of mitophagy flux. This index allows for the direct comparison of different inducers and inhibitors in the quantitative evaluation of mitophagy. Moreover, this approach is effective in primary culture of cells and tissues, and in the mouse model of retinitis pigmentosa, in which we also observe increased mitochondrial levels, suggesting that mitophagy is impaired in this neurodegenerative condition.
Materials and Methods
Cell culture, reagents, and transfection
Human neuroblastoma SH-SY5Y cells were obtained from the American Type Culture Collection (CRL 2266, CCL −2). HeLa cells, stably transfected with GFP-LC3B (HeLa-GFP-LC3), were kindly provided by Aviva Tolkovsky (John van Geest Center for Brain Repair, Cambridge, UK).54 MEFs, both wild type (WT) and atg5-KO, were kindly provided by Noboru Mizushima (Tokyo Dental and Medical University, Tokyo, Japan). Cells were cultured in DMEM, 10% fetal bovine serum (FBS), 1% penicillin/streptomycin, and 1% glutamine and incubated at 5% CO2. Cultures were tested to ensure the absence of mycoplasma contamination. The PARK2-GFP plasmid was provided by Ted Dawson (Johns Hopkins University School of Medicine, Baltimore, USA) and the pEGFP-C1-Atg5 plasmid was from Xuejun Jiang (Memorial Sloan Kettering Cancer Center, New York, USA) and described previously.55 Cells were transfected with lipofectamine 2000 (Life Techonologies, 11668027) following the manufacturer's instructions and the GFP-positive population was analyzed 24 h after transfection. Cells were incubated with CCCP (C2759; 10 μM or 25 μM as indicated), EBSS (E2888), fisetin (F4043, 10 μM), nicotinamide (F4043, 5 mM), 3MA (M9281, 10 mM), WM (Calbiochem 681675, 100 nM), bafilomycin A1 (B1793; 20nM, 50 nM), CsA (30024, 5 μM), NH4Cl (A9434, 10 mM) and PHEN (P131377, 50 μM) all from Sigma, rapamycin (200 nM; Calbiochem, 553210), hydroxichloroquine (Dolquine, 30 μM; Rubió Laboratories, 06680A) or leupeptin (100 μM; Fisher Scientific, BP-2662-25). For flow cytometry 7.5 × 10⁵ SH-SY5Y cells and 7.5 × 10⁵ HeLa-GFP-LC3 cells were seeded per well in 24-well plates. For western blot 20 × 105 cells were seeded in 6-well plates.
Animal procedures
All procedures were approved by the respective local ethics committees for animal experimentation, and all experiments were carried out in accordance with European Union guidelines and the ARVO Statement for the Use of Animals in Ophthalmic and Vision Research. WT C57BL/6J, CD1 and Balb/c mice were obtained from The Jackson Laboratory (Bar Harbor, ME) and used as controls. The Pde6brd10 mouse model of retinal degeneration, raised on a C57BL/6J background, was kindly provided by Bo Chang (The Jackson Laboratory). All Pde6brd10 mice used were homozygous for the Pde6brd10 mutation. Mice were maintained on a 12/12 hour light/darkness cycle at 20°C with ad libitum access to food and water. Embryos on a CD1 background were collected on E13.5. All animals were sacrificed by cervical dislocation and embryos were removed by caesarean section. The embryos were then placed in phosphate-buffered saline (PBS; Sigma, P4417) in a Petri dish and, under a microscope, the eyes were isolated and the neuroetinas dissected, separating the pigment epithelium, crystalline, vitreous, vessels, and other tissue, as previously described.56
Organotypic cultures of mouse embryonic retinas
Neuroretinas were cultured in N2 defined medium DMEM:HAM/F12 (Gibco, 42400) supplemented with 10 mM sodium bicarbonate (S7561), 1.1 mg/L pyruvate (P2256), 100 mg/L apotransferrin (T2252), 0.02 mg/mL sodium selenite (S5261), 0.32 mg/L putrescin (P5780), 0.2 mg/L progesterone (P8783), all from Sigma, and 0.05 g/L gentamicin (Gibco, 15710), and adjusted to pH 7.14. At the time of the culture was supplemented with 2 mM glutamine (Gibco, 25030) and 10 nM recombinant human INS/insulin (Sigma, I2643).
Astrocyte primary cultures
Primary cultures of astrocytes were prepared from 1-d-old Balb/c mouse cortex, as previously described.57 Animals were decapitated, the brain cortex was removed and the meninges carefully stripped off, and the cortex washed in ice-cold PBS and mechanically disrupted. Single-cell suspensions were plated in T-flasks (4 hemispheres/75 cm2) in Dulbecco's minimum essential medium supplemented with 20% (v/v) FBS (heat-inactivated), 1% (v/v) 100 U/mL penicillin/streptomycin solution and glucose (at a final concentration of 10 mM). Astrocytes were maintained in a humidified atmosphere (7% CO2) at 37°C. After 8 d, the phase dark cells growing on the astrocytic cell layer were separated by vigorous shaking and removed, and the medium was replaced with 15% (v/v) FBS. The remaining astrocytes were detached by mild trypsinization using trypsin/EDTA (0.25% w/v) and subcultured in T-flasks for another wk, and the medium was again replaced with 10% (v/v) FBS. The growth medium was changed twice every wk. For flow cytometry, astrocytes were plated at a concentration of 35 × 104 cells/well in 24-well plates.
MTDR determination by flow cytometry
After treatments adherent cells were trypsinized for 5 min at 37°C and resuspended in complete medium with 10 nM MitoTracker Deep Red (Invitrogen, M22426) and 1 μg/mL propidium iodide (Sigma, P4864) and then incubated for 15 min at 37°C. For selected experiments, cells were preloaded with 10 nM of MTDR, incubated for 15 min at 37°C, washed and the treated with the different compounds. Using an FC500 flow cytometer (Beckman Coulter, L'Hospitalet de Llobregat, Barcelona), 10,000 cells were acquired in the FL3 and FL4 channels. For organotypic retinal cultures retinas were cultured for 6 h and then incubated with trypsin (Gibco, 25300054) for 5 min at 37°C, and then dissociated by gentle pipetting. Trypsin-mediated digestion was arrested by the addition of complete medium and cells were centrifuged at 300 g and resuspended in HBSS with MTDR and PI for 15 min at 37°C. Next, 10,000 cells were acquired in the FL3 and FL4 channels of the FC500 flow cytometer (Beckman Coulter). Mean fluorescence in the FL4 channel in the viable cell (PtdIns-negative) population was plotted and normalized against that of untreated cells.
Western blot
After treatments, cells were washed in cold PBS and proteins were extracted in 150 μL lysis buffer, which consisted of 50 mM Tris-HCl, pH 6.8, 10% glycerol (v/v), 2% SDS (w/v; BioRad, 160-0301), protease inhibitor (P8783) and phosphatase inhibitor (1 mM sodium orthovanadate (S6508), 1 mM sodium fluoride (201154), and 5 mM sodium pyrophosphate (221368), all from Sigma. Next, the samples were heated for 10 min at 99°C and stored at −20°C. Protein concentration was determined using the Pierce BCA Protein Assay Kit (Pierce/Thermo Fisher Scientific, 23227) and was measured at 540 nm. Total protein extract (15 μg) was mixed with 10 mM DTT and bromophenol blue, loaded into Criterion TGX Precast Gels (Bio-Rad, 567–1124) and transferred onto PVDF membranes (Bio-Rad, 170–4157) for 14 min at 14 V using a Trans-Blot Turbo Transfer System (Bio-Rad). After transfer, membranes were activated with 100% methanol for 2 min and were blocked with 5% nonfat milk in PBS-T (PBS 1X, 0.5% Tween 20 [v/v; Sigma, 27434–8]) for 1 h at room temperature. The membranes were subsequently incubated with primary antibodies in 3% BSA in PBS-T for 12–16 h at 4°C in an orbital shaker, followed by incubation with secondary antibodies (1:2000-1:5000; DAKO, P0448, P0447, P0450) in PBS-T for 1 h at room temperature in an orbital shaker. The membranes were developed with Pierce ECL Western Blotting Substrate (Thermo Scientific, 32106) using RP2 Plus Curix films (ENKMV, Afga) and Amersham Hyperfilm (GE Healthcare, 28-9068-36). Antibodies against the following proteins were used: TOMM40 (sc-11414), TOMM20 (sc-17764), and TUBA/α-tubulin (sc-8035), from Santa Cruz Biotechnology; COX4I1 (459600, Invitrogen), RPS6/ribosomal protein S6 total (2317) and p-RPS6 (4856), from Cell Signaling Technology; TIMM23 (BD Bio, 611222); MAP1LC3B/LC3B (Sigma, L7543); and GAPDH (Abcam, ab8245).
Inmunoflourescence and confocal analysis
After treatments, cells were fixed for 30 min with 4% paraformaldehyde in PBS, washed and permeabilized with 0.1% SDS for 30 min and incubated for 16 h with the anti-LC3B (Nanotools, clone 5F10) and TOMM20 (Santa Cruz Biotechnology, sc-17764). Secondary antibodies were coupled to Alexa Fluor 488 and 568 (Invitrogen, ab150077, ab15013, ab175473, ab 175471). Nuclei were labeled with DAPI and cells were mounted with Fluoromount (Southern Biotech, 0100-01). Confocal analysis was performed with an SP5 Leica Confocal microscope (Alcobendas, Spain). Images were taken every 0.2 μm and the profile analyses were performed in confocal planes using the Leica LAS AF software.
Statistical analyses
Data shown in the figures represent the average of at least 3 experiments performed in triplicate and are presented as the mean (or median, as indicated) ± the standard error of the mean. Differences between treatments were analyzed using the Student t test, ANOVA, or in the case of non-normally distributed data, the nonparametric Mann-Whitney U-test (SPSS 17.0). Statistical significance was set at P < 0.05.
Acknowledgments
We thank Dolores Pérez-Sala for helpful discussions and Pedro Lastres for flow cytometry advice.
Disclosure of Potential Conflicts of Interest
No potential conflicts of interest were disclosed.
Funding
This research was carried out thanks to grants from MINECO, SAF2012-36079 and CDS2010-00045.
Supplemental Material
Supplemental data for this article can be accessed on the publisher's website
References
- 1.Boya P, Reggiori F, Codogno P. Emerging regulation and functions of autophagy. Nat Cell Biol 2013; 15:713-20; PMID:23817233; http://dx.doi.org/ 10.1038/ncb2788 [DOI] [PMC free article] [PubMed] [Google Scholar]
- 2.Ashrafi G, Schwarz TL. The pathways of mitophagy for quality control and clearance of mitochondria. Cell Death Differ 2013; 20:31-42; PMID:22743996; http://dx.doi.org/ 10.1038/cdd.2012.81 [DOI] [PMC free article] [PubMed] [Google Scholar]
- 3.Clark SL, Jr. Cellular differentiation in the kidneys of newborn mice studies with the electron microscope. J Biophys Biochem Cytol 1957; 3:349-62; PMID:13438920; http://dx.doi.org/ 10.1083/jcb.3.3.349 [DOI] [PMC free article] [PubMed] [Google Scholar]
- 4.Elmore SP, Qian T, Grissom SF, Lemasters JJ. The mitochondrial permeability transition initiates autophagy in rat hepatocytes. Faseb J 2001; 15:2286-7; PMID:11511528 [DOI] [PubMed] [Google Scholar]
- 5.Tolkovsky AM. Mitophagy. Biochim Biophys Acta 2009; 1793:1508-15; PMID:19289147; http://dx.doi.org/ 10.1016/j.bbamcr.2009.03.002 [DOI] [PubMed] [Google Scholar]
- 6.Sandoval H, Thiagarajan P, Dasgupta SK, Schumacher A, Prchal JT, Chen M, Wang J. Essential role for Nix in autophagic maturation of erythroid cells. Nature 2008; 454:232-5; PMID:18454133; http://dx.doi.org/ 10.1038/nature07006 [DOI] [PMC free article] [PubMed] [Google Scholar]
- 7.Al Rawi S, Louvet-Vallee S, Djeddi A, Sachse M, Culetto E, Hajjar C, Boyd L, Legouis R, Galy V. Postfertilization autophagy of sperm organelles prevents paternal mitochondrial DNA transmission. Science 2011; 334:1144-7; PMID:22033522; http://dx.doi.org/ 10.1126/science.1211878 [DOI] [PubMed] [Google Scholar]
- 8.Sato M, Sato K. Degradation of paternal mitochondria by fertilization-triggered autophagy in C. elegans embryos. Science 2011; 334:1141-4; PMID:21998252; http://dx.doi.org/ 10.1126/science.1210333 [DOI] [PubMed] [Google Scholar]
- 9.Luo SM, Ge ZJ, Wang ZW, Jiang ZZ, Wang ZB, Ouyang YC, Hou Y, Schatten H, Sun QY. Unique insights into maternal mitochondrial inheritance in mice. Proc Natl Acad Sci U S A 2013; 110:13038-43; PMID:23878233; http://dx.doi.org/ 10.1073/pnas.1303231110 [DOI] [PMC free article] [PubMed] [Google Scholar]
- 10.Narendra D, Tanaka A, Suen DF, Youle RJ. Parkin is recruited selectively to impaired mitochondria and promotes their autophagy. J Cell Biol 2008; 183:795-803; PMID:19029340; http://dx.doi.org/ 10.1083/jcb.200809125 [DOI] [PMC free article] [PubMed] [Google Scholar]
- 11.Youle RJ, Narendra DP. Mechanisms of mitophagy. Nat Rev Mol Cell Biol 2011; 12:9-14; PMID:21179058; http://dx.doi.org/ 10.1038/nrm3028 [DOI] [PMC free article] [PubMed] [Google Scholar]
- 12.Birgisdottir AB, Lamark T, Johansen T. The LIR motif - crucial for selective autophagy. J Cell Sci 2013; 126:3237-47; PMID:23908376 [DOI] [PubMed] [Google Scholar]
- 13.Rikka S, Quinsay MN, Thomas RL, Kubli DA, Zhang X, Murphy AN, Gustafsson ÅB. Bnip3 impairs mitochondrial bioenergetics and stimulates mitochondrial turnover. Cell Death Differ 2011; 18:721-31; PMID:21278801; http://dx.doi.org/ 10.1038/cdd.2010.146 [DOI] [PMC free article] [PubMed] [Google Scholar]
- 14.Hanna RA, Quinsay MN, Orogo AM, Giang K, Rikka S, Gustafsson AB. Microtubule-associated protein 1 light chain 3 (LC3) interacts with Bnip3 protein to selectively remove endoplasmic reticulum and mitochondria via autophagy. J Biol Chem 2012; 287:19094-104; PMID:22505714; http://dx.doi.org/ 10.1074/jbc.M111.322933 [DOI] [PMC free article] [PubMed] [Google Scholar]
- 15.Novak I, Kirkin V, McEwan DG, Zhang J, Wild P, Rozenknop A, Rogov V, Löhr F, Popovic D, Occhipinti A, et al.. Nix is a selective autophagy receptor for mitochondrial clearance. EMBO Rep 2010; 11:45-51; PMID:20010802; http://dx.doi.org/ 10.1038/embor.2009.256 [DOI] [PMC free article] [PubMed] [Google Scholar]
- 16.Kanki T, Wang K, Cao Y, Baba M, Klionsky DJ. Atg32 is a mitochondrial protein that confers selectivity during mitophagy. Dev Cell 2009; 17:98-109; PMID:19619495; http://dx.doi.org/ 10.1016/j.devcel.2009.06.014 [DOI] [PMC free article] [PubMed] [Google Scholar]
- 17.Liu L, Feng D, Chen G, Chen M, Zheng Q, Song P, Ma Q, Zhu C, Wang R, Qi W, et al.. Mitochondrial outer-membrane protein FUNDC1 mediates hypoxia-induced mitophagy in mammalian cells. Nat Cell Biol 2012; 14:177-85; PMID:22267086; http://dx.doi.org/ 10.1038/ncb2422 [DOI] [PubMed] [Google Scholar]
- 18.Van Humbeeck C, Cornelissen T, Hofkens H, Mandemakers W, Gevaert K, De Strooper B, Vandenberghe W. Parkin interacts with Ambra1 to induce mitophagy. J Neurosci 2011; 31:10249-61; PMID:21753002; http://dx.doi.org/ 10.1523/JNEUROSCI.1917-11.2011 [DOI] [PMC free article] [PubMed] [Google Scholar]
- 19.Fu M, St-Pierre P, Shankar J, Wang PT, Joshi B, Nabi IR. Regulation of mitophagy by the Gp78 E3 ubiquitin ligase. Mol Biol Cell 2013; 24:1153-62; PMID:23427266; http://dx.doi.org/ 10.1091/mbc.E12-08-0607 [DOI] [PMC free article] [PubMed] [Google Scholar]
- 20.Orvedahl A, Sumpter R Jr., Xiao G, Ng A, Zou Z, Tang Y, Narimatsu M, Gilpin C, Sun Q, Roth M, et al.. Image-based genome-wide siRNA screen identifies selective autophagy factors. Nature 2011; 480:113-7; PMID:22020285; http://dx.doi.org/ 10.1038/nature10546 [DOI] [PMC free article] [PubMed] [Google Scholar]
- 21.Okatsu K, Iemura S, Koyano F, Go E, Kimura M, Natsume T, Tanaka K, Matsuda N. Mitochondrial hexokinase HKI is a novel substrate of the Parkin ubiquitin ligase. Biochem Biophys Res Commun 2012; 428:197-202; PMID:23068103; http://dx.doi.org/ 10.1016/j.bbrc.2012.10.041 [DOI] [PubMed] [Google Scholar]
- 22.Geisler S, Holmstrom KM, Skujat D, Fiesel FC, Rothfuss OC, Kahle PJ, Springer W. PINK1/Parkin-mediated mitophagy is dependent on VDAC1 and p62/SQSTM1. Nat Cell Biol 2010; 12:119-31; PMID:20098416; http://dx.doi.org/ 10.1038/ncb2012 [DOI] [PubMed] [Google Scholar]
- 23.Melser S, Chatelain EH, Lavie J, Mahfouf W, Jose C, Obre E, Goorden S, Priault M, Elgersma Y, Rezvani HR, et al.. Rheb regulates mitophagy induced by mitochondrial energetic status. Cell Metab 2013; 17:719-30; PMID:23602449; http://dx.doi.org/ 10.1016/j.cmet.2013.03.014 [DOI] [PubMed] [Google Scholar]
- 24.Chu CT, Ji J, Dagda RK, Jiang JF, Tyurina YY, Kapralov AA, Tyurin VA, Yanamala N, Shrivastava IH, Mohammadyani D, et al.. Cardiolipin externalization to the outer mitochondrial membrane acts as an elimination signal for mitophagy in neuronal cells. Nat Cell Biol 2013; 15:1197-205; PMID:24036476; http://dx.doi.org/ 10.1038/ncb2837 [DOI] [PMC free article] [PubMed] [Google Scholar]
- 25.Kang HT, Hwang ES. Nicotinamide enhances mitochondria quality through autophagy activation in human cells. Aging Cell 2009; 8:426-38; PMID:19473119; http://dx.doi.org/ 10.1111/j.1474-9726.2009.00487.x [DOI] [PubMed] [Google Scholar]
- 26.Jang SY, Kang HT, Hwang ES. Nicotinamide-induced mitophagy: event mediated by high NAD+/NADH ratio and SIRT1 protein activation. J Biol Chem 2012; 287:19304-14; PMID:22493485; http://dx.doi.org/ 10.1074/jbc.M112.363747 [DOI] [PMC free article] [PubMed] [Google Scholar]
- 27.Goemans CG, Boya P, Skirrow CJ, Tolkovsky AM. Intra-mitochondrial degradation of Tim23 curtails the survival of cells rescued from apoptosis by caspase inhibitors. Cell Death Differ 2008; 15:545-54; PMID:18174902; http://dx.doi.org/ 10.1038/sj.cdd.4402290 [DOI] [PubMed] [Google Scholar]
- 28.Wu YT, Tan HL, Shui G, Bauvy C, Huang Q, Wenk MR, Ong CN, Codogno P, Shen HM. Dual role of 3-methyladenine in modulation of autophagy via different temporal patterns of inhibition on class I and III phosphoinositide 3-kinase. J Biol Chem 2010; 285:10850-61; PMID:20123989; http://dx.doi.org/ 10.1074/jbc.M109.080796 [DOI] [PMC free article] [PubMed] [Google Scholar]
- 29.Rodriguez-Enriquez S, Kim I, Currin RT, Lemasters JJ. Tracker dyes to probe mitochondrial autophagy (mitophagy) in rat hepatocytes. Autophagy 2006; 2:39-46; PMID:16874071; http://dx.doi.org/ 10.4161/auto.2229 [DOI] [PMC free article] [PubMed] [Google Scholar]
- 30.Carreira RS, Lee Y, Ghochani M, Gustafsson AB, Gottlieb RA. Cyclophilin D is required for mitochondrial removal by autophagy in cardiac cells. Autophagy 2010; 6:462-72; PMID:20364102; http://dx.doi.org/ 10.4161/auto.6.4.11553 [DOI] [PMC free article] [PubMed] [Google Scholar]
- 31.Valenciano AI, Boya P, de la Rosa EJ. Early neural cell death: numbers and cues from the developing neuroretina. Int J Dev Biol 2009; 53(8-10):1515-28; PMID:18947520. [DOI] [PubMed] [Google Scholar]
- 32.Boya P, Mellen MA, de la Rosa EJ. How autophagy is related to programmed cell death during the development of the nervous system. Biochem Soc Trans 2008; 36:813-7; PMID:18793142; http://dx.doi.org/ 10.1042/BST0360813 [DOI] [PubMed] [Google Scholar]
- 33.Mellén MA, de la Rosa EJ, Boya P. Autophagy is not universally required for phosphatidyl-serine exposure and apoptotic cell engulfment during neural development. Autophagy 2009; 5:964-72; PMID:19587526; http://dx.doi.org/ 10.4161/auto.5.7.9292 [DOI] [PubMed] [Google Scholar]
- 34.Sahel J, Bonnel S, Mrejen S, Paques M. Retinitis pigmentosa and other dystrophies. Dev Ophthalmol 2010; 47:160-7; PMID:20703049; http://dx.doi.org/ 10.1159/000320079 [DOI] [PubMed] [Google Scholar]
- 35.Daiger SP, Sullivan LS, Bowne SJ. Genes and mutations causing retinitis pigmentosa. Clin Genet 2013; 84:132-41; PMID:23701314 [DOI] [PMC free article] [PubMed] [Google Scholar]
- 36.Corrochano S, Barhoum R, Boya P, Arroba AI, Rodriguez-Muela N, Gomez-Vicente V, Bosch F, de Pablo F, de la Villa P, de la Rosa EJ. Attenuation of vision loss and delay in apoptosis of photoreceptors induced by proinsulin in a mouse model of retinitis pigmentosa. Invest Ophthalmol Vis Sci 2008; 49:4188-94; PMID:18515565; http://dx.doi.org/ 10.1167/iovs.08-2182 [DOI] [PubMed] [Google Scholar]
- 37.Camougrand N, Kissova I, Salin B, Devenish RJ. Monitoring mitophagy in yeast. Methods Enzymol 2008; 451:89-107; PMID:19185716; http://dx.doi.org/ 10.1016/S0076-6879(08)03208-4 [DOI] [PubMed] [Google Scholar]
- 38.Zhu Y, Chen G, Chen L, Zhang W, Feng D, Liu L, Chen Q. Monitoring mitophagy in Mammalian cells. Methods Enzymol 2014; 547:39-55; PMID:25416351; http://dx.doi.org/ 10.1016/B978-0-12-801415-8.00003-5 [DOI] [PubMed] [Google Scholar]
- 39.Dolman NJ, Chambers KM, Mandavilli B, Batchelor RH, Janes MS. Tools and techniques to measure mitophagy using fluorescence microscopy. Autophagy 2013; 9:1653-62; PMID:24121704; http://dx.doi.org/ 10.4161/auto.24001 [DOI] [PubMed] [Google Scholar]
- 40.Twig G, Elorza A, Molina AJ, Mohamed H, Wikstrom JD, Walzer G, Stiles L, Haigh SE, Katz S, Las G, et al.. Fission and selective fusion govern mitochondrial segregation and elimination by autophagy. Embo J 2008; 27:433-46; PMID:18200046; http://dx.doi.org/ 10.1038/sj.emboj.7601963 [DOI] [PMC free article] [PubMed] [Google Scholar]
- 41.Klionsky DJ, Abdalla FC, Abeliovich H, Abraham RT, Acevedo-Arozena A, Adeli K, Agholme L, Agnello M, Agostinis P, Aguirre-Ghiso JA, et al.. Guidelines for the use and interpretation of assays for monitoring autophagy. Autophagy 2012; 8:445-544; PMID:22966490; http://dx.doi.org/ 10.4161/auto.19496 [DOI] [PMC free article] [PubMed] [Google Scholar]
- 42.Hernandez G, Thornton C, Stotland A, Lui D, Sin J, Ramil J, Magee N, Andres A, Quarato G, Carreira RS, et al.. MitoTimer: a novel tool for monitoring mitochondrial turnover. Autophagy 2013; 9:1852-61; PMID:24128932; http://dx.doi.org/ 10.4161/auto.26501 [DOI] [PMC free article] [PubMed] [Google Scholar]
- 43.Keij JF, Bell-Prince C, Steinkamp JA. Staining of mitochondrial membranes with 10-nonyl acridine orange, MitoFluor Green, and MitoTracker Green is affected by mitochondrial membrane potential altering drugs. Cytometry 2000; 39:203-10; PMID:10685077; http://dx.doi.org/ 10.1002/(SICI)1097-0320(20000301)39:3%3c203::AID-CYTO5%3e3.0.CO;2-Z [DOI] [PubMed] [Google Scholar]
- 44.Poot M, Zhang YZ, Kramer JA, Wells KS, Jones LJ, Hanzel DK, Lugade AG, Singer VL, Haugland RP. Analysis of mitochondrial morphology and function with novel fixable fluorescent stains. J Histochem Cytochem 1996; 44:1363-72; PMID:8985128; http://dx.doi.org/ 10.1177/44.12.8985128 [DOI] [PubMed] [Google Scholar]
- 45.Dong H, Cheung SH, Liang Y, Wang B, Ramalingam R, Wang P, Sun H, Cheng SH, Lam YW. “Stainomics”: identification of mitotracker labeled proteins in mammalian cells. Electrophoresis 2013; 34:1957-64; PMID:23595693; http://dx.doi.org/ 10.1002/elps.201200557 [DOI] [PubMed] [Google Scholar]
- 46.Presley AD, Fuller KM, Arriaga EA. MitoTracker Green labeling of mitochondrial proteins and their subsequent analysis by capillary electrophoresis with laser-induced fluorescence detection. J Chromatogr B Analyt Technol Biomed Life Sci 2003; 793:141-50; PMID:12880861; http://dx.doi.org/ 10.1016/S1570-0232(03)00371-4 [DOI] [PubMed] [Google Scholar]
- 47.Park SJ, Shin JH, Kim ES, Jo YK, Kim JH, Hwang JJ, Kim JC, Cho DH. Mitochondrial fragmentation caused by phenanthroline promotes mitophagy. FEBS Lett 2012; 586:4303-10; PMID:23123158; http://dx.doi.org/ 10.1016/j.febslet.2012.10.035 [DOI] [PubMed] [Google Scholar]
- 48.Corti O, Brice A. Mitochondrial quality control turns out to be the principal suspect in parkin and PINK1-related autosomal recessive Parkinson's disease. Curr Opin Neurobiol 2013; 23:100-8; PMID:23206589; http://dx.doi.org/ 10.1016/j.conb.2012.11.002 [DOI] [PubMed] [Google Scholar]
- 49.Itoh K, Nakamura K, Iijima M, Sesaki H. Mitochondrial dynamics in neurodegeneration. Trends Cell Biol 2013; 23:64-71; PMID:23159640; http://dx.doi.org/ 10.1016/j.tcb.2012.10.006 [DOI] [PMC free article] [PubMed] [Google Scholar]
- 50.Doonan F, Donovan M, Cotter TG. Activation of multiple pathways during photoreceptor apoptosis in the rd mouse. Invest Ophthalmol Vis Sci 2005; 46:3530-8; PMID:16186330; http://dx.doi.org/ 10.1167/iovs.05-0248 [DOI] [PubMed] [Google Scholar]
- 51.Rimessi A, Bonora M, Marchi S, Patergnani S, Marobbio CM, Lasorsa FM, Pinton P. Perturbed mitochondrial Ca2+ signals as causes or consequences of mitophagy induction. Autophagy 2013; 9:1677-86; PMID:24121707; http://dx.doi.org/ 10.4161/auto.24795 [DOI] [PubMed] [Google Scholar]
- 52.Kristensen AR, Schandorff S, Hoyer-Hansen M, Nielsen MO, Jaattela M, Dengjel J, Andersen JS. Ordered organelle degradation during starvation-induced autophagy. Mol Cell Proteomics 2008; 7:2419-28; PMID:18687634; http://dx.doi.org/ 10.1074/mcp.M800184-MCP200 [DOI] [PubMed] [Google Scholar]
- 53.Gomes LC, Di Benedetto G, Scorrano L. During autophagy mitochondria elongate, are spared from degradation and sustain cell viability. Nat Cell Biol 2011; 13:589-98; PMID:21478857; http://dx.doi.org/ 10.1038/ncb2220 [DOI] [PMC free article] [PubMed] [Google Scholar]
- 54.Bampton ET, Goemans CG, Niranjan D, Mizushima N, Tolkovsky AM. The dynamics of autophagy visualized in live cells: from autophagosome formation to fusion with endo/lysosomes. Autophagy 2005; 1:23-36; PMID:16874023; http://dx.doi.org/ 10.4161/auto.1.1.1495 [DOI] [PubMed] [Google Scholar]
- 55.Gammoh N, Florey O, Overholtzer M, Jiang X. Interaction between FIP200 and ATG16L1 distinguishes ULK1 complex-dependent and -independent autophagy. Nat Struct Mol Biol 2013; 20:144-9; PMID:23262492; http://dx.doi.org/ 10.1038/nsmb.2475 [DOI] [PMC free article] [PubMed] [Google Scholar]
- 56.Rodriguez-Muela N, Koga H, Garcia-Ledo L, de la Villa P, de la Rosa EJ, Cuervo AM, Boya P. Balance between autophagic pathways preserves retinal homeostasis. Aging Cell 2013; 12:478-88; PMID:23521856; http://dx.doi.org/ 10.1111/acel.12072 [DOI] [PMC free article] [PubMed] [Google Scholar]
- 57.Sa Santos S, Fonseca LL, Monteiro MA, Carrondo MJ, Alves PM. Culturing primary brain astrocytes under a fully controlled environment in a novel bioreactor. J Neurosci Res 2005; 79:26-32; PMID:15602759; http://dx.doi.org/ 10.1002/jnr.20279 [DOI] [PubMed] [Google Scholar]
Associated Data
This section collects any data citations, data availability statements, or supplementary materials included in this article.