

SUMMARY
We describe a Hi-C based method, Micro-C, in which micrococcal nuclease is used instead of restriction enzymes to fragment chromatin, enabling nucleosome resolution chromosome folding maps. Analysis of Micro-C maps for budding yeast reveals abundant self-associating domains similar to those reported in other species, but not previously observed in yeast. These structures, far shorter than topologically-associating domains in mammals, typically encompass one to five genes in yeast. Strong boundaries between self-associating domains occur at promoters of highly transcribed genes and regions of rapid histone turnover that are typically bound by the RSC chromatin-remodeling complex. Investigation of chromosome folding in mutants confirms roles for RSC, “gene looping” factor Ssu72, Mediator, H3K56 acetyltransferase Rtt109, and the N-terminal tail of H4 in folding of the yeast genome. This approach provides detailed structural maps of a eukaryotic genome, and our findings provide insights into the machinery underlying chromosome compaction.
INTRODUCTION
Eukaryotic genomes are packaged into chromatin via a hierarchical series of folding steps. A great deal is known about the first level of chromatin compaction, as several crystal structures exist of the repeating subunit – the nucleosome – and genome-wide mapping studies have illuminated nucleosome positions and histone modifications across the genome for an ever-increasing number of organisms (Hughes and Rando, 2014; Rando, 2007; Zhang and Pugh, 2011). In contrast to the “primary structure” of chromatin, less is known about higher-order chromatin architecture. The next level of compaction is commonly thought to be the 30 nm fiber, which is readily observed by electron microscopy in vitro, but whose existence in vivo remains controversial (Fussner et al., 2011; Maeshima et al., 2014; Tremethick, 2007). The structure of a 30 nm fiber is hotly debated, with major models being solenoid and zigzag paths of the beads-on-a-string (Dorigo et al., 2004; Ghirlando and Felsenfeld, 2008; Routh et al., 2008; Song et al., 2014; Tremethick, 2007), as well as more recent polymorphic fiber models that incorporate variability in nucleosome repeat length (Collepardo-Guevara and Schlick, 2014). Moreover, mounting evidence suggests that 30 nm fiber may only occur in vitro due to the high dilution of chromatin fibers used in such studies – in dilute solution in vitro a given nucleosome will only have access to other nucleosomes on the same DNA fragment, while in the “sea of nucleosomes” in the nucleus many additional nucleosomes are available in trans for internucleosomal interactions (McDowall et al., 1986; Nishino et al., 2012). Beyond the 30 nm fiber, multiple additional levels of organization have been described, with prominent examples including gene loops (Ansari and Hampsey, 2005; O'Sullivan et al., 2004), enhancer-promoter loops (Sanyal et al., 2012), “topologically-associating domains”/”chromosomally-interacting domains” (TADs/CIDs) (Dixon et al., 2012; Le et al., 2013; Mizuguchi et al., 2014; Nora et al., 2012; Sexton et al., 2012), lamina-associated domains (LADs) (Pickersgill et al., 2006), and megabase-scale active and repressed chromatin compartments (Grob et al., 2014; Lieberman-Aiden et al., 2009). The 3-dimensional path of chromatin has been implicated in a large number of biological processes, as for example gene loops are proposed to enforce promoter directionality in yeast (Tan-Wong et al., 2012), TADs correspond to regulatory domains in mammals (Symmons et al., 2014), and LADs are correlated with gene silencing during development (Pickersgill et al., 2006).
Understanding higher-order chromatin structure has been greatly facilitated by the 3C family of techniques (such as Hi-C), which assay contact frequency between genomic loci based on isolation of DNA fragments that crosslink to one another in vivo (Dekker et al., 2002). However, these techniques currently suffer from suboptimal resolution, as they rely on restriction digestion of the genome, typically yielding ~4 kb average fragment size. Even with 4-cutter restriction enzymes, the heterogeneous distribution of restriction enzyme target sequences across the genome makes the resolution somewhat variable between individual loci of interest, and partial digestion still limits resolution to around 1 kb at best. Thus, our present understanding of chromatin structure has a “blind spot”, with ChIP-Seq, MNase-Seq, and ChIP-exo methodologies providing information over the ~1-150 bp length scale, and Hi-C typically providing information on the >1-4 kB length scale. This leaves the length scale relevant to secondary structures such as 30 nm fiber or yeast gene loops – on the order of ~2-10 nucleosomes – inaccessible to current methods for analyzing chromosome structure.
Here, we describe a Hi-C-based method – “Micro-C” – in which chromatin is fragmented into mononucleosomes using micrococcal nuclease, thus enabling nucleosome-resolution maps of chromosome folding. We generated high-coverage Micro-C maps for the budding yeast S. cerevisiae, finding abundant self-associating domains typically spanning 1-5 genes. Strong boundaries between self-associating domains occur at promoters of highly-transcribed genes and regions of rapid histone turnover, and are typically bound by the RSC ATP-dependent chromatin remodeling complex and by the cohesin loading complex. Finally, we investigate chromosome folding in detail in 14 mutants, confirming roles for RSC and Ssu72 in chromosome folding, and furthermore finding key roles for Mediator, the histone H4 N-terminal tail, and the H3K56 acetyltransferase Rtt109 in folding of the yeast genome. This approach thus enables analysis of chromosome folding at the resolution of chromatin's repeating subunit – the nucleosome – and will enable future investigations into chromosome folding to leverage the powerful genetic tools available in the yeast model system.
RESULTS
A nucleosome resolution chromosome folding assay
The resolution gap between 1D chromosome mapping assays (~1-200 bp resolution) and 3D chromosome folding assays (>1 kb resolution) lead us to develop a Hi-C protocol – termed “Micro-C” for MICROcoccal nuclease chromosome Conformation assay – in which chromatin fragmentation is achieved by MNase digestion, yielding mononucleosomes. This protocol is based on the Hi-C protocol (Lieberman-Aiden et al., 2009), with key alterations being the MNase digestion step, subsequent mononucleosomal end repair, and a modified two-step method for specifically purifying ligation products (Figure 1A, Supplemental Methods). After purification of ligation products between mononucleosomes, paired-end deep sequencing is used to characterize the ligation products. For some analyses, each pair mate is assigned to one of the 66,360 nucleosomes in budding yeast (Weiner et al., 2010) to yield a 66,360 × 66,360 nucleosome-nucleosome interaction matrix (Figure 1B, Supplemental Figure S1). Key technical controls include 1) sequencing of unligated samples, 2) ligation of MNase digestion reactions of uncrosslinked yeast, and 3) mixing of crosslinked chromatin from two yeast species (S. cerevisiae and K. lactis) prior to ligation to determine the rate of ligation between uncrosslinked molecules (Figure 1C, Supplemental Figure S1A, Tables S1-S2). The post-crosslinking interspecies mixing experiment reveals that ~10% of all interactions are spurious ligations at the dilution used.
Figure 1. Nucleosome-resolution chromosome folding maps.

(A) Overview of the Micro-C method. Bottom right panel shows Micro-C data for yeast chromosome 6. (B) Zoom-in on a 20 kb × 20 kb submatrix from chromosome 9 (360,001-380,000), with Micro-C interactions represented in white-yellow-red-black heatmap showing the interaction intensity for a given pair of loci. (C) Decay of internucleosomal interactions with distance. Distances along the x axis are provided in units of nucleosomes – first data point represents ligation between adjacent (N/N+1) nucleosomes, with data out to N/N+60 products shown. Y axis shows log2 of the number of ligation products, normalized to parts per million (for interactions out to 100 kb) for each dataset. Data for 20 wild-type replicates, and for no crosslinking and no ligation control datasets, are indicated. Schematics illustrate nucleosomes contributing to N/N+1, N/N+2, and N/N+3 ligation products, using a tetranucleosome cartoon for illustration. See also Supplemental Figures S1-S2.
Our technique provides an overlapping but nonidentical view of chromosome folding to restriction enzyme-based methods (Supplemental Methods, Supplemental Figure S2). Visual inspection of a prior low-resolution chromosome folding map for budding yeast (Duan et al., 2010) confirms the substantially higher resolution of our assay (Supplemental Figure S2B). However, Micro-C poorly captures known long-distance interactions in yeast: while we do recover preferential interactions between short chromosomes and a modest signal for telomeretelomere interactions, these interactions are relatively weak, and centromere-centromere interactions are not observed (Supplemental Figure S2). Micro-C thus serves as a complementary method to traditional 3C and Hi-C methods, being particularly well suited to short-range analysis of nucleosome fiber folding, which is invisible to restriction enzyme-based 3C/Hi-C assays.
Promoter nucleosomes form boundaries between self-associating domains
As is typical of all chromatin interaction maps, the vast majority of Micro-C interactions occur close to the diagonal – nucleosomes tethered near one another in one dimension tend to contact each other in 3D space (Figures 1B-C, Table S2). Nonetheless, there is significant variation in the density of interactions along the diagonal (Figure 1B), with abundant ~4-50 nucleosome “boxes” of internucleosome interactions that have a clear relationship to gene structure. These boxes of internucleosomal interactions are similar to the “topologically-associated domains” (TADs) described in mammals (Dixon et al., 2012; Nora et al., 2012) and the chromosomal interaction domains (CIDs) described in the bacterium C. crescentus (Le et al., 2013), which have also been observed in flies (Sexton et al., 2012) but appear to be absent in A. thaliana (Feng et al., 2014) and were not previously observed in S. cerevisiae (Duan et al., 2010). Here we will adopt the more general “CID” nomenclature. As observed in multiple organisms, these interaction domains exhibit a nested architecture, with two strong short range domains often merging into a larger domain via somewhat weaker interactions. We consistently observe CIDs across 21 biological replicate samples (Tables S3-S4, Supplemental Figure S3) for S. cerevisiae including three separate “wild type” strain backgrounds (S288C, W303, and a S288C strain with the histone H3/H4-encoding genes relocated to a plasmid (Dai et al., 2008)), as well as in a somewhat distantly-related (last common ancestor ~150 mY) hemiascomycete yeast, K. lactis (manuscript in preparation).
We systematically identified boundaries between CIDs by searching for locations that are strongly depleted of crossing interactions relative to the density of such interactions in the region (Figures 2A-D, Supplemental Figures S3-S4, Methods). Boundary calls were consistent between replicates of wild-type yeast (Supplemental Figures S3D-E, H, Tables S3-S4), and were not an artifact of MNase digestion level (Supplemental Figures S3F-I, Tables S4-S5). Globally, boundaries separating compacted local domains from one another were strongly enriched for the nucleosome depleted regions (NDRs) that are a widespread feature (Hughes and Rando, 2014) of yeast promoters (Figures 2B and E and below). That said, it is clear that not all promoters or NDRs form boundaries – CIDs ranged from 0 to 8 genes in length, with 45% of CIDs encompassing two or more genes (Figure 2F). Interestingly, as CIDs in budding yeast typically encompass one to five genes, at ~2-10 kb they are 1-2 orders of magnitude shorter than mammalian TADs (~100 kb - 1 Mb) – the length of self-associating domains thus appears to be conserved when scaled by gene number, as opposed to sequence distance.
Figure 2. Properties of folding boundaries.

(A-D) Example of boundary identification. Data for a 15 kb locus, with arcs showing interactions between nucleosomes, colored as in Figure 1B. Interactions observed only once in the entire dataset have been removed for clarity. Gene annotations for this locus, and boundary calls shown in black arrows, are shown below panel (D). Emphasis on RPS26A shows both the overall lack of local Micro-C interactions, as well as the unusually strong boundary activity associated with this highly-transcribed gene. RNA-Seq data (B), nucleosome positioning data (C) and Sth1 ChIP-Seq enrichment (Lopez-Serra et al., 2014) (D) are also shown for this locus to emphasize the correlation between RSC-enriched promoters and boundary activity. (E) Boundaries between CIDs occur at promoters. For each nucleosome position relative to a gene, the fraction of boundary nucleosomes, or of all nucleosomes genome-wide, is shown on the y axis. As boundaries as defined here fall between adjacent nucleosomes, we show data here for the downstream boundary nucleosome, relative to underlying gene orientation – upstream nucleosomes are correspondingly enriched for −1 nucleosomes (and +N nucleosomes). (F) Length distribution of CIDs. Distribution of distances between boundary nucleosomes is plotted in blue using base pairs for the x axis, and in the inset using gene count as the scale. See also Supplemental Figures S3-S4.
Biochemical features of Micro-C boundaries
What biochemical aspects of a given nucleosome might play a role in boundary activity? Overall, boundary nucleosomes were enriched for the pairs of nucleosomes flanking nucleosome-depleted regions (NDRs) in yeast, and exhibited significant enrichment of a variety of histone marks found at the 5’ ends of genes (Weiner et al., 2015), including high levels of transcription-related marks such as H3K4me3 and H3K18ac (Figure 3A), and elevated rates of replication-independent H3 replacement (Dion et al., 2007). Not only were these enrichments significant relative to all nucleosomes in the genome, but for most histone modifications the enrichments observed were also highly significant when comparing boundary +1 nucleosomes only to other +1 nucleosomes (Supplemental Figure S5A). Consistent with this, strong boundaries were generally found upstream of more highly-transcribed genes than nonboundary promoters (Figure 3B, Tables S3-S4). Other features of strong boundaries included high levels of the RSC ATP-dependent chromatin remodeling complex, and high levels of the cohesin loading factor Scc2 (Lopez-Serra et al., 2014) (Figures 2A-D, Supplemental Figure S5B), and these factors were enriched at boundary NDRs relative to all other NDRs (Figures 3C-E).
Figure 3. Features of CID boundaries.

(A) Average histone modification levels are shown for all boundary nucleosomes (using both nucleosomes flanking a boundary). Histone modification data are from (Weiner et al., 2015), normalized to nucleosome occupancy, and expressed as log2 enrichment relative to all nucleosomes genome-wide. (B) Boundary activity at promoters is associated with elevated transcription rates. For each promoter, the transcription rate is defined as the Pol2 level (Kim et al., 2010) of the more highly-transcribed of the two adjacent genes, and cumulative plots show Pol2 enrichment values for nonboundary promoters, for all boundary promoters, and for the strongest half of boundary promoters. (C-E) Boundary nucleosome-depleted regions (NDRs) are associated with high levels of H3K18ac, RSC, and cohesin relative to all NDRs genome-wide. In each panel, all NDRs in the yeast genome were identified, and Micro-C interactions that cross the NDR were calculated. NDRs were sorted according to quintiles based on the abundance of NDR-spanning Micro-C reads – the first quintile encompasses the 1300 NDRs with the fewest NDR-spanning Micro-C ligation products, etc. – and ChIP-Seq data for the indicated factors was averaged for each quintile. See also Supplemental Figure S5.
These findings are consistent with previous reports (Dixon et al., 2012; Gheldof et al., 2006; Le et al., 2013; Nora et al., 2012) that highly active genes can act as boundaries between self-associating domains. Importantly, the increased resolution afforded by Micro-C localizes such boundaries specifically to active promoters in yeast, thus implicating a number of promoter-specific factors in chromosome folding.
Properties of chromosomal interaction domains
While domains of high local interactions are strongly correlated with gene structure, it is also apparent that genes vary significantly in the extent of such self-association. To identify regulatory and other correlates with gene compaction, we identified genes with significantly high or low levels of self-association (corrected for nucleosome occupancy and gene length – Supplemental Figures S6A-D, Table S6). Overall, gene compaction was anticorrelated (r = −0.56) with transcription rate, even when correcting for nucleosome occupancy (Figure 4A). The highly-transcribed ribosomal protein genes were associated with particularly open chromatin, not only exhibiting low levels of gene compaction but also commonly forming strong boundaries between CIDs (Figure 2A). Consistent with the anticorrelation between gene compaction and transcription rate, we found that gene compaction was positively correlated with the level of H2AS129ph – a mark of gene repression (Szilard et al., 2010) – associated with the gene, and was anticorrelated with active marks such as H3K4me3, H3K18ac, and others (Liu et al., 2005; Weiner et al., 2015) (Supplemental Figure S6E).
Figure 4. Gene-specific compaction is anticorrelated with transcription.

(A) Scatterplot comparison of gene compaction with transcription rate. X axis shows Pol2 ChIP data from (Kim et al., 2010), y axis shows gene compaction from this dataset based specifically on interactions beyond N/N+3, normalized for nucleosome occupancy and gene length (Supplemental Figures S6A-D). (B) Changes in transcription affect gene compaction. Micro-C was carried out for yeast subject to 30 minutes of 1.5 mM diamide, a sulfhydryl-reducing agent that alters transcription of ~20% of the yeast genome (Gasch et al., 2000). Here, Micro-C contact matrices for unstressed and diamide-stressed yeast show regions surrounding three ribosomal protein-encoding genes (RPGs), which are strongly repressed in response to diamide stress and which exhibit a dramatic increase in local compaction. (C) Systematic analysis of diamide-induced changes in chromosome folding. Here, gene compaction is scatterplotted for unstressed and diamide-stressed yeast, with points color-coded according to the corresponding mRNA abundance changes in diamide (smoothed by 20 nearest neighbors). (D) Global inhibition of transcription leads to increased compaction over normally highly-transcribed genes. Here, Pol2 abundance at t=0 is plotted (x axis) against the change in gene compaction in response to 45 minutes of treatment with the RNA polymerase inhibitor thiolutin. Red points show RPGs. See also Supplemental Figure S6.
To test the hypothesis that active transcription results in unfolding of genes, we carried out Micro-C in yeast responding to diamide stress, a stimulus which leads to transcriptional changes at ~20% of all yeast genes (Gasch et al., 2000). Consistent with the anticorrelation between transcription rate and gene compaction at steady-state, we observed unfolding of genes that were strongly upregulated by diamide stress, and the converse behavior at diamide-repressed genes (Figures 4B-C). The anticorrelation between transcription rate and chromosome compaction is therefore dynamic, and does not simply reflect disparate regulatory strategies used for transcription of TFIID-dominated “growth” genes and SAGA-dominated “stress” genes during active growth. To further test the hypothesis that transcription leads to unfolding of the chromatin associated with genes, we treated yeast with the RNA polymerase inhibitor thiolutin, finding that highly-transcribed genes in untreated cells – primarily ribosomal protein genes – became significantly (p < 6.4 × 10−55, t-test) more compact upon inhibition of RNA polymerase (Figure 4D).
Comparison of chromosome folding in various genetic backgrounds
Although transcription can clearly influence gene compaction, transcription rate only explains 31% of the variance in the Micro-C compaction signal, implying that the major influence over gene compaction is related to regulatory strategies or is gene-specific. We therefore asked whether compact genes shared any common biology. Comparison of gene compaction with data from 700 yeast deletion mutants (Kemmeren et al., 2014) revealed that unusually compact genes were derepressed in mutants lacking various histone deacetylases (including Cyc8/Tup1 and Sum1/Hst1), histone turnover machinery (such as Rtt109 and Asf1), or Mediator activity (Supplemental Figures S6F-G). Based on these results, we carried out Micro-C analysis of several mutants predicted to have strong effects on gene compaction, as well as mutants with plausible roles for gene compaction in the literature but which were not identified based on our analysis of wild-type gene compaction. We screened 24 mutants (including several histone mutants – see below) by Micro-C at relatively low sequencing depth, and chose 14 mutants to sequence deeper based either on widespread effects on chromosome compaction or on prior findings in the literature.
We first investigated the role of the “gene looping” factor Ssu72 on gene compaction, as the occurrence of domains of strongly self-associating nucleosomes over gene bodies is reminiscent of the gene loops in yeast reported by several groups (Ansari and Hampsey, 2005; O'Sullivan et al., 2004; Tan-Wong et al., 2012). However, for the vast majority of genes we do not observe preferential interaction between a gene's +1 nucleosome and its 3’ end nucleosome in Micro-C data, instead finding interactions throughout a gene body (Figures 1B and 2A), suggesting a “gene crumple” or globule rather than a “gene loop” structure (discussed in Supplemental Methods). Moreover, gene compaction as measured by Micro-C is anti-correlated with transcription rate, in contrast to reported gene loops. Nonetheless, to test the hypothesis that the CID structures observed using Micro-C might be somehow related to gene loops (with technical differences in the protocols revealing different views of the same structure), we performed Micro-C analysis of the ssu72-2 mutant that lacks detectable gene looping (Ansari and Hampsey, 2005; Tan-Wong et al., 2012). We find a moderate but significant decrease in global chromosome compaction, with a corresponding decrease in individual gene compaction, in the ssu72-2 mutant (Figure 5).
Figure 5. Modest effects of ssu72-2 on global gene compaction.

A) Micro-C was carried out for three replicate cultures of ssu72-2. Compaction scores for all genes are scatterplotted for wild-type and ssu72-2 mutants, as indicated. (B) Histogram of gene compaction scores for wild-type and ssu72-2 mutants, showing a subtle but significant (p < 1.2e-8, KS test) general loss of gene compaction in the mutant. (C) Two 20 kb × 20 kb matrixes showing wild type and ssu72-2 Micro-C data, as indicated. See also Supplemental Figure S6.
In addition to the mutant with a defective Pol2 CTD phosphatase Ssu72, several additional mutants exhibited widespread changes in internucleosomal interactions throughout the genome (Figure 6). Most notably, we find that genes become less compact, on average, in mutants affecting the Mediator complex, as well as in mutants lacking the H3K56 acetyltransferase Rtt109 (Figures 6B-D, Supplemental Figures S7A-B). In contrast, chromatin was globally more compact in temperature-sensitive mutants affecting the RSC complex and the cohesin loading factor Scc2 (Figures 6D-E). In contrast to these major mediators of chromosome folding, loss of many other chromatin regulators, such as the primary RNase H in yeast (Rnh201), lead to more subtle gene-specific defects in gene compaction (Figures 6A, D, E, Table S6).
Figure 6. Mutant effects on gene compaction.

(A-C) Scatterplots of occupancy-corrected gene compaction scores for wild type (x axis), and the various indicated mutants. Notable here are a relatively tight scatterplot for rnh201Δ (A), a more variable signal with a modest global loss of compaction for rtt109Δ (B), and a dramatic loss of gene compaction for med1Δ (C). (D) Histograms showing the distribution of changes in gene compaction for the indicated mutants or conditions. In each case, nucleosome occupancy-corrected gene compaction was calculated for every gene in the genome, and the difference between BY4741 and the indicated mutants is plotted on the x axis – negative values indicate decreased gene compaction in the mutant, positive values indicate increased gene compaction. (E) Global and gene-specific effects of chromatin mutants on gene compaction. For all mutants analyzed by Micro-C, gene compaction scores were calculated, and for all genes with at least a 2-fold change in compaction in one mutant, the difference between all mutants and the relevant wild-type is shown in a clustered heatmap. See also Supplemental Figure S7.
To visualize mutant effects on gene compaction on a gene-by-gene basis, for each gene we calculated the difference in normalized compaction score between a given mutant and the relevant wild-type. Clustering of this matrix (Figure 6E) revealed that a dominant signal in our dataset reflects increased compaction of normally highly-transcribed genes such as the ribosomal protein genes (RPGs) upon their repression due to Pol2 inhibition (thiolutin), diamide stress (diamide), or conditional inactivation of the essential RSC chromatin remodeler (sth1-2, rsc8-21). Chromosome folding effects resulting from inactivation of the cohesin-loader Scc2 were also correlated with those resulting from RSC inactivation, consistent with the strong correlations recently reported between the effects of these mutations both on mRNA abundance and on nucleosome positioning (Lopez-Serra et al., 2014). In contrast to the effects of transcriptional repression resulting in increased RPG compaction, mutations affecting Mediator, Rtt109, and the histone deacetylase Rpd3 resulted in decompaction of a variety of genes (Figures 6D-E). Importantly, although compaction of RPGs was observed in multiple conditions where these genes are repressed, most mutant effects on gene compaction could not be explained by transcriptional effects of the mutation, as for example the correlations between rtt109Δ, med1Δ, and rpd3Δ effects on gene compaction and mRNA abundance (Kemmeren et al., 2014) were 0.17, 0.03, and −0.006, respectively.
Systematic analysis of short-range nucleosomal interactions
Finally, we turn to short range aspects of chromosome folding. The dominant models for the 30 nm fiber are the “zig-zag” (Dorigo et al., 2004; Song et al., 2014) and solenoid models (Ghirlando and Felsenfeld, 2008), which differ in their periodicity – zig-zag models predict that nucleosomes N and N+2 (N+4, N+6, etc.) should be in spatial proximity, while interdigitated solenoid models typically have a periodicity of ~5-6 nucleosomes. We do find some support for the possibility that a common motif of individual tri- or tetra-nucleosomal zig-zags (Schalch et al., 2005; Song et al., 2014) may exist in vivo, as N/N+2 nucleosome pairs are nearly as abundant as N/N+1 nucleosome pairs genome-wide (Figure 1C), particularly when excluding ligation products with “in-in” read pairs (Supplemental Figure S1B). However, plotting the decay of nucleosome-nucleosome interactions as a function of distance in our Micro-C dataset reveals no evidence for long-range periodicity in internucleosomal interactions (Figure 1C and Supplemental Figure S1B). Our data therefore do not support a periodic repeating fiber, but are consistent with the idea of a tri or tetranucleosomal motif in chromatin fiber folding – in this model, the absence of high levels of N/N+4 and N/N+6 in Figure 1C could reflect either lack of extended zig zag stretches in vivo (eg a given stretch of 12 nucleosomes might only carry a single folded tetranucleosome in a given cell), or, more likely, a technical inability to connect nucleosomes at longer distances due to the use of the short-distance crosslinker formaldehyde (Grigoryev et al., 2009) (Discussion).
To further explore short-range structure in chromosome folding, we assayed chromatin folding in several histone mutants that alter internucleosomal interactions in vitro, as well as in unrelated histone mutants as controls. Most notably, as both H4K16 acetylation and histone N-terminal tails have been implicated in 30 nm fiber formation (Hizume et al., 2009; Shogren-Knaak et al., 2006), we carried out Micro-C in relevant mutants to dissect their roles in chromosome folding. As expected, we find that partial deletion of the H4 N-terminal tail leads to a strong loss of chromosome folding signal (Supplemental Figures 7B-C), consistent with a key role for histone tails in chromosome compaction (but see Supplemental Methods). In contrast, we find no global effects of the H4K16Q mutation on overall chromosome folding, although this is perhaps not surprising given that the majority of the budding yeast genome is euchromatic and is packaged into H4K16-acetylated histones. Finally, we also examined chromosome folding in H4R23A mutants, which do not influence tetranucleosome folding in vitro but alter stacking of adjacent tetranucleosomes (Song et al., 2014). Intriguingly, these mutants exhibited normal interactions up to the tetranucleosome scale but lost interactions beyond this scale (Supplemental Figure S7C), the length scale at which tetranucleosome packing effects would manifest themselves.
DISCUSSION
We describe here a method for nucleosome-resolution chromosome folding studies, providing genome-wide access to the length scale between 200 bp and ~4kb. We do not find evidence for a repeating 30 nm fiber structure in vivo, although the pattern of short-range interactions we observe is consistent with a tri- or tetranucleosome folding motif in eukaryotic chromatin. Instead, the primary level of organization in the yeast genome observed here is associated with gene structure, with domains of 1-5 genes forming compact gene crumples, or globules, rather than loops (Figure 7).
Figure 7. Nucleosome-resolution view of chromosome folding.
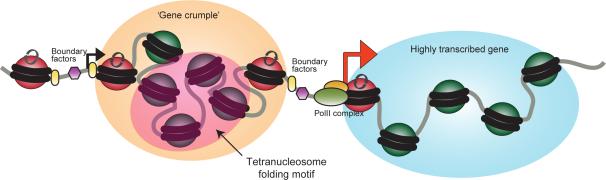
Cartoon showing a model for one relatively poorly-transcribed gene adjacent to a more open highly-transcribed gene.
Chromosomal interaction domains in yeast
Our data demonstrates that the self-associating domains observed in many other species are also present in budding yeast, and that this hierarchical folding holds even at the previously unobservable ~2-10 nucleosome scale. The relatively short length of yeast genes presumably explains the prior inability to observe CIDs in this organism (Duan et al., 2010), and suggests that Micro-C might reveal CID structures in organisms such as Arabidopsis where they have not been previously observed (Feng et al., 2014). Perhaps the most surprising aspect of our study is the finding that the typical length of CIDs tends to be conserved between species when scaled by gene number, rather than linear distance – yeast CIDs typically cover ~1-5 genes, or ~5 kb, while mammalian TADs also cover roughly the same number of genes, thus encompassing ~0.5 Mb. This disparity in length scale suggests that the primary determinant of chromosome folding may be the boundaries that separate compacted domains, rather than the internal structure of the domains themselves, as the detailed folding of the “beads on a string” within a given domain likely varies quite a bit between different organisms. In other words, we speculate that establishment of boundaries that separate chromosomal domains is the driver of chromosome folding behavior, with folding of the chromosome within each boundary-delimited domain not necessarily conforming to any regular secondary structure.
Prior Hi-C studies have localized boundaries between folding domains to several features of the underlying sequence, including binding sites for the insulator CTCF (Dixon et al., 2012; Phillips-Cremins et al., 2013), highly transcribed coding regions (Dixon et al., 2012; Le et al., 2013; Nora et al., 2012; Sexton et al., 2012), binding sites for cohesin (Mizuguchi et al., 2014; Phillips-Cremins et al., 2013), and sites of Mediator localization (Phillips-Cremins et al., 2013). In addition, insulator function in flies has been linked to regions of dynamic chromatin (Negre et al., 2010). Although S. cerevisiae does not appear to encode a CTCF-like regulator, other features of boundaries between compacted domains appear to be conserved, as boundaries in our dataset are enriched for active promoters and for regions associated with the cohesin loading complex (Figures 2-3). Moreover, the increased resolution afforded by Micro-C allows us to localize the boundary activity of highly-transcribed genes specifically to their promoters.
Mutant effects on chromosome compaction
To uncover functional roles for chromatin regulators in establishing chromatin domains in yeast, we analyzed a number of deletion and temperature-sensitive genes using Micro-C. In general, we noted that many of the features enriched at CID boundaries play functional roles in gene compaction, as we observe a general loosening of chromosome structure in med1Δ and rtt109Δ mutants. Conversely, sth1ts and scc2ts mutants shifted to the restrictive temperature exhibited increased gene compaction, presumably due to the similar effects of these mutants on global transcription (Lopez-Serra et al., 2014). The key role for Mediator in gene compaction in yeast described here is of great interest, as Mediator recruitment of cohesin has previously been shown to play a role in chromosome folding in murine ES cells (Kagey et al., 2010; Phillips-Cremins et al., 2013), suggesting that chromosome domain compaction may be a conserved consequence of Mediator action. More novel is the finding that Rtt109, a H3K56 acetyltransferase which enhances replication-independent histone turnover (Kaplan et al., 2008; Rufiange et al., 2007), has global (albeit more subtle) effects on chromosome compaction.
Taken together, our mutant analyses identify a number of factors that help compact genes in budding yeast, and emphasize the key role that promoters play in establishing the folding of the chromosome.
Insights into secondary structure in vivo
A key goal in development of Micro-C was to shed light on chromatin fiber folding, as the dominant models for regular 30 nm fiber structure – zig-zag and solenoid – make distinct predictions for periodicity in internucleosomal contacts. Here, we find no evidence for periodicity in short-range internucleosome interactions, consistent with the hypothesis that a regular 30 nm fiber may be uncommon in vivo (Dekker, 2008). However, despite the lack of periodicity in our dataset, we do find that N/N+1 and N/N+2 ligation products are present at similar abundance in vivo (Supplemental Figure S1B), broadly supporting two-start models for chromatin secondary structure. Indeed, EM studies of folded 12 nucleosome templates subject to limited formaldehyde crosslinking reported similar abundance of N+1 and N+2 crosslinking products, with relatively few interactions at N+4 or greater distances (Grigoryev et al., 2009). Thus, the absence of the excess of N+4 and N+6 products expected from a regular zig-zag fiber could potentially result from individual tri- or tetra-nucleosome folding motifs (Song et al., 2014) occurring sparsely, and could also result from a technical limitation in Micro-C – formaldehyde is a short distance crosslinker, and chromatin in 30 nm fiber might not present primary amine groups in close enough proximity to be ligated to one another. Suggesting the latter hypothesis, we find that the H4R23A mutant previously shown to affect tetranucleosome stacking, but not the tetranucleosome structure itself (Song et al., 2014), causes a subtle relaxation of chromatin by Micro-C (Supplemental Figures 7B-C).
Thus, whether the lack of periodicity in Micro-C data results from a technical inability to capture N/N+4 or N/N+6 interactions from a fully-folded fiber, or whether it reflects the sparse existence of tetranucleosomes in vivo which seldom stack with one another, remains to be tested (potentially via use of alternative crosslinkers, or examination of higher order multi-nucleosome ligation products). Technical benchmarking of Micro-C using defined 30 nm templates in vitro would be valuable (Grigoryev et al., 2009), although as the majority of such templates at present use repeats of the Widom601 sequence to ensure uniform nucleosome occupancy, sequencing-based assays cannot distinguish between nucleosome positions along such templates.
With such technical caveats noted, we do note that the lack of periodic Micro-C signal is consistent with the fact that regular 30 nm signatures are seldom observed in EM studies of intact or sectioned nuclei (McDowall et al., 1986; Nishino et al., 2012). Moreover, the massive differences in the length scales of CIDs between yeast and mammals are difficult to reconcile with a requirement for a regular form of secondary structure in chromosome folding.
Perspective
Taken together our data support the idea that eukaryotic chromosomes are thus subject to hierarchical “beads of a string” architecture, with the 10 nm nucleosome-linker-nucleosome fiber being the first level of beads on a string, and gene crumples separated by regions of high histone turnover being the next level of organization. These studies provide a high resolution view of the eukaryotic genome, and, given the powerful tools available in budding yeast, should provide fertile ground for future genetic interrogation of chromosome folding in vivo.
Materials and Methods
Chromatin digestion and end repair
. Yeast were grown to midlog phase in YPD media at 30 C, fixed with 3% formaldehyde for 15 min, and quenched with 125 mM glycine for 5 min. Cells were pelleted, spheroplasted with Zymolyase, and MNase-treated to yield >95% mononucleosomes (Liu et al., 2005). After stopping MNase, chromatin supernatant was concentrated in an Amicon 10K spin column and dephosphorylated using Antarctic phosphatase. Crosslinked chromatin was subject to T4 DNA polymerase with ATP to leave 5’ single-stranded termini, then biotinylated dsDNA was generated by supplementing with biotin-dCTP, biotin-dATP, dTTP and dGTP.
Proximity ligation
0.5 - 1 μg of crosslinked chromatin was diluted to 10 mL (0.05 – 0.1 μg/mL final) and treated with T4 DNA ligase. After heat inactivation, chromatin was concentrated to 250 μL in an Amicon 30k spin column, and treated with 100U exonuclease III for 5 min to eliminate biotinylated ends of unligated DNA. Proteinase K was then added and incubated for 65 C overnight. DNA was purified by PCI extraction and ethanol precipitation, treated with RNase A, and ~250-350 bp DNA was gel-purified.
Library preparation and sequencing
Purified DNA was treated with End-it, subject to A-tailing with Exo- Klenow, and ligated to Illumina adaptors. Adaptor-ligated DNA was purified with streptavidin beads to isolate ligated Micro-C products away from undigested dinucleosomal DNA. Streptavidin beads were then subject to ~12-15 cycles of PCR using Illumina paired-end primers. Amplified library was purified and subject to Illumina HiSeq paired end sequencing.
Sequence analysis and mapping
Paired 50 bp reads were extracted and mapped individually to the S. cerevisiae genome (sacCer3 genome build) with the bowtie2 tool using the following command line:
bowtie2 -x S288C_reference_sequence_20110203 -U <input fastq> -S output.sam -p 16 -a -–mm –-reorder
For a pair of reads mapping to more than one possible location, we selected the shortest interaction. We discarded repeat occurrences of the same fragment pair to avoid PCR artifacts, resulting in unique mappable fragments as the raw interaction data (Table S1). For some visualizations, fragments pairs were associated with one of the 66,360 nucleosomes in budding yeast, while raw fragment pairs were used for analyses such as bp-resolution interaction vs. distance plots (Supplemental Figure S1B) and boundary calls (Figures 2-3, Supplemental Figures S2-4). With the exceptions of Figure 1C and Supplemental Figure S1A, ligation products with IN-IN reads were discarded from all analyses and visualizations, as these include an excess of undigested dinucleosomes (Supplemental Figure S1B).
Normalization and genome wide interaction analysis
To deal with outliers due to repetitive sequences, we counted the number of interactions in the merged WT samples (using tiled 100bp regions). Regions with more than 10× interactions than the window average were excluded for further analyses. In total 1.3% of the genome was excluded, mostly within Chromosome 12 in the rDNA region, and in Ty elements. Interaction count matrices were normalized to the total number of unique mapped fragments. Correction for nucleosome occupancy, either by iterative row normalization or by normalizing to measured nucleosome occupancy, had minimal effects on Micro-C contact maps (not shown).
Detecting domain boundaries
To detect domain boundaries, we first define a local boundary score for genome position i as the number of interactions of distance 500-10,000 base-pairs that pass above position i (i.e. interaction between position i-d1 and i+d2, where 500<d1+d2<10,000) We then find local minima in this vector of counts as boundaries. The strength of the boundary is inversely proportional to the number of interactions crossing it (Supplemental Figures S3A-D).
NDR-centric analysis was carried out for all NDRs in yeast, with the number of NDR-crossing reads (excluding IN-IN reads and read pairs <500 bp apart) shown for all datasets in Table S4. For analyses in Figure 3 and Supplemental Figure S2H, the 219 NDRs with the most NDR-crossing reads were excluded, as they were primarily associated with rDNA repeats, subtelomeres, and Ty elements.
Compactness score
The raw compaction score, defined as the number of long range interaction fragments (>300bp) within a gene, is highly correlated with gene size and average nucleosome occupancy (Supplemental Figure S6A). As a proxy for nucleosome occupancy we use the number of short-range interaction (<300bp) over the gene, as these are mostly due to non-ligated mononucleosome fragments. This score internally normalizes for mutant and MNase digestion effects on nucleosome occupancy. To normalize for these two related measures (gene length and nucleosome occupancy) we used a k-nearest-neighbors smoothing with a Gaussian kernel to obtain the expected compactness score for each size and occupancy bin (Supplemental Figure S6B). We defined the compactness score of a gene as the log of the ratio between the actual value and the smoothed value. The resulting score is independent of both gene length and occupancy (Supplemental Figure S6C-D).
Supplementary Material
Acknowledgements
We thank members of the Rando and Friedman labs for comments on this manuscript, and we thank C. Boone for the generous gift of temperature-sensitive yeast strains. Work was supported in part by the NIH grant GM079205 to OJR and NF, HG003143 to JD, ERC grant “ChromatinSys” (340712) to NF, and Israeli Science Foundation I-CORE on “Chromatin and RNA in Gene Regulation” to NF. T-HSH is an HHMI international student research fellow.
Footnotes
Publisher's Disclaimer: This is a PDF file of an unedited manuscript that has been accepted for publication. As a service to our customers we are providing this early version of the manuscript. The manuscript will undergo copyediting, typesetting, and review of the resulting proof before it is published in its final citable form. Please note that during the production process errors may be discovered which could affect the content, and all legal disclaimers that apply to the journal pertain.
References
- Ansari A, Hampsey M. A role for the CPF 3′-end processing machinery in RNAP II-dependent gene looping. Genes & development. 2005;19:2969–2978. doi: 10.1101/gad.1362305. [DOI] [PMC free article] [PubMed] [Google Scholar]
- Collepardo-Guevara R, Schlick T. Chromatin fiber polymorphism triggered by variations of DNA linker lengths. Proceedings of the National Academy of Sciences of the United States of America. 2014;111:8061–8066. doi: 10.1073/pnas.1315872111. [DOI] [PMC free article] [PubMed] [Google Scholar]
- Dai J, Hyland EM, Yuan DS, Huang H, Bader JS, Boeke JD. Probing nucleosome function: a highly versatile library of synthetic histone H3 and H4 mutants. Cell. 2008;134:1066–1078. doi: 10.1016/j.cell.2008.07.019. [DOI] [PMC free article] [PubMed] [Google Scholar]
- Dekker J. Mapping in vivo chromatin interactions in yeast suggests an extended chromatin fiber with regional variation in compaction. The Journal of biological chemistry. 2008;283:34532–34540. doi: 10.1074/jbc.M806479200. [DOI] [PMC free article] [PubMed] [Google Scholar]
- Dekker J, Rippe K, Dekker M, Kleckner N. Capturing chromosome conformation. Science (New York, NY. 2002;295:1306–1311. doi: 10.1126/science.1067799. [DOI] [PubMed] [Google Scholar]
- Dion MF, Kaplan T, Kim M, Buratowski S, Friedman N, Rando OJ. Dynamics of replication-independent histone turnover in budding yeast. Science (New York, NY. 2007;315:1405–1408. doi: 10.1126/science.1134053. [DOI] [PubMed] [Google Scholar]
- Dixon JR, Selvaraj S, Yue F, Kim A, Li Y, Shen Y, Hu M, Liu JS, Ren B. Topological domains in mammalian genomes identified by analysis of chromatin interactions. Nature. 2012;485:376–380. doi: 10.1038/nature11082. [DOI] [PMC free article] [PubMed] [Google Scholar]
- Dorigo B, Schalch T, Kulangara A, Duda S, Schroeder RR, Richmond TJ. Nucleosome arrays reveal the two-start organization of the chromatin fiber. Science (New York, NY. 2004;306:1571–1573. doi: 10.1126/science.1103124. [DOI] [PubMed] [Google Scholar]
- Duan Z, Andronescu M, Schutz K, McIlwain S, Kim YJ, Lee C, Shendure J, Fields S, Blau CA, Noble WS. A three-dimensional model of the yeast genome. Nature. 2010;465:363–367. doi: 10.1038/nature08973. [DOI] [PMC free article] [PubMed] [Google Scholar]
- Feng S, Cokus SJ, Schubert V, Zhai J, Pellegrini M, Jacobsen SE. Genome-wide Hi-C Analyses in Wild-Type and Mutants Reveal High-Resolution Chromatin Interactions in Arabidopsis. Molecular cell. 2014;55:694–707. doi: 10.1016/j.molcel.2014.07.008. [DOI] [PMC free article] [PubMed] [Google Scholar]
- Fussner E, Ching RW, Bazett-Jones DP. Living without 30nm chromatin fibers. Trends in biochemical sciences. 2011;36:1–6. doi: 10.1016/j.tibs.2010.09.002. [DOI] [PubMed] [Google Scholar]
- Gasch AP, Spellman PT, Kao CM, Carmel-Harel O, Eisen MB, Storz G, Botstein D, Brown PO. Genomic expression programs in the response of yeast cells to environmental changes. Mol Biol Cell. 2000;11:4241–4257. doi: 10.1091/mbc.11.12.4241. [DOI] [PMC free article] [PubMed] [Google Scholar]
- Gheldof N, Tabuchi TM, Dekker J. The active FMR1 promoter is associated with a large domain of altered chromatin conformation with embedded local histone modifications. Proceedings of the National Academy of Sciences of the United States of America. 2006;103:12463–12468. doi: 10.1073/pnas.0605343103. [DOI] [PMC free article] [PubMed] [Google Scholar]
- Ghirlando R, Felsenfeld G. Hydrodynamic studies on defined heterochromatin fragments support a 30-nm fiber having six nucleosomes per turn. Journal of molecular biology. 2008;376:1417–1425. doi: 10.1016/j.jmb.2007.12.051. [DOI] [PMC free article] [PubMed] [Google Scholar]
- Grigoryev SA, Arya G, Correll S, Woodcock CL, Schlick T. Evidence for heteromorphic chromatin fibers from analysis of nucleosome interactions. Proceedings of the National Academy of Sciences of the United States of America. 2009;106:13317–13322. doi: 10.1073/pnas.0903280106. [DOI] [PMC free article] [PubMed] [Google Scholar]
- Grob S, Schmid MW, Grossniklaus U. Hi-C Analysis in Arabidopsis Identifies the KNOT, a Structure with Similarities to the flamenco Locus of Drosophila. Molecular cell. 2014;55:678–693. doi: 10.1016/j.molcel.2014.07.009. [DOI] [PubMed] [Google Scholar]
- Hizume K, Nakai T, Araki S, Prieto E, Yoshikawa K, Takeyasu K. Removal of histone tails from nucleosome dissects the physical mechanisms of salt-induced aggregation, linker histone H1-induced compaction, and 30-nm fiber formation of the nucleosome array. Ultramicroscopy. 2009;109:868–873. doi: 10.1016/j.ultramic.2009.03.014. [DOI] [PubMed] [Google Scholar]
- Hughes AL, Rando OJ. Mechanisms Underlying Nucleosome Positioning in vivo. Annual review of biophysics. 2014 doi: 10.1146/annurev-biophys-051013-023114. [DOI] [PubMed] [Google Scholar]
- Kagey MH, Newman JJ, Bilodeau S, Zhan Y, Orlando DA, van Berkum NL, Ebmeier CC, Goossens J, Rahl PB, Levine SS, et al. Mediator and cohesin connect gene expression and chromatin architecture. Nature. 2010;467:430–435. doi: 10.1038/nature09380. [DOI] [PMC free article] [PubMed] [Google Scholar]
- Kaplan T, Liu CL, Erkmann JA, Holik J, Grunstein M, Kaufman PD, Friedman N, Rando OJ. Cell cycle- and chaperone-mediated regulation of H3K56ac incorporation in yeast. PLoS genetics. 2008;4:e1000270. doi: 10.1371/journal.pgen.1000270. [DOI] [PMC free article] [PubMed] [Google Scholar]
- Kemmeren P, Sameith K, van de Pasch LA, Benschop JJ, Lenstra TL, Margaritis T, O'Duibhir E, Apweiler E, van Wageningen S, Ko CW, et al. Large-scale genetic perturbations reveal regulatory networks and an abundance of gene-specific repressors. Cell. 2014;157:740–752. doi: 10.1016/j.cell.2014.02.054. [DOI] [PubMed] [Google Scholar]
- Kim TS, Liu CL, Yassour M, Holik J, Friedman N, Buratowski S, Rando OJ. RNA polymerase mapping during stress responses reveals widespread nonproductive transcription in yeast. Genome biology. 2010;11:R75. doi: 10.1186/gb-2010-11-7-r75. [DOI] [PMC free article] [PubMed] [Google Scholar]
- Le TB, Imakaev MV, Mirny LA, Laub MT. High-resolution mapping of the spatial organization of a bacterial chromosome. Science (New York, NY. 2013;342:731–734. doi: 10.1126/science.1242059. [DOI] [PMC free article] [PubMed] [Google Scholar]
- Lieberman-Aiden E, van Berkum NL, Williams L, Imakaev M, Ragoczy T, Telling A, Amit I, Lajoie BR, Sabo PJ, Dorschner MO, et al. Comprehensive mapping of long-range interactions reveals folding principles of the human genome. Science (New York, NY. 2009;326:289–293. doi: 10.1126/science.1181369. [DOI] [PMC free article] [PubMed] [Google Scholar]
- Liu CL, Kaplan T, Kim M, Buratowski S, Schreiber SL, Friedman N, Rando OJ. Single-Nucleosome Mapping of Histone Modifications in S. cerevisiae. PLoS biology. 2005;3:e328. doi: 10.1371/journal.pbio.0030328. [DOI] [PMC free article] [PubMed] [Google Scholar]
- Lopez-Serra L, Kelly G, Patel H, Stewart A, Uhlmann F. The Scc2-Scc4 complex acts in sister chromatid cohesion and transcriptional regulation by maintaining nucleosome-free regions. Nature genetics. 2014;46:1147–1151. doi: 10.1038/ng.3080. [DOI] [PMC free article] [PubMed] [Google Scholar]
- Maeshima K, Imai R, Tamura S, Nozaki T. Chromatin as dynamic 10-nm fibers. Chromosoma. 2014;123:225–237. doi: 10.1007/s00412-014-0460-2. [DOI] [PMC free article] [PubMed] [Google Scholar]
- McDowall AW, Smith JM, Dubochet J. Cryo-electron microscopy of vitrified chromosomes in situ. The EMBO journal. 1986;5:1395–1402. doi: 10.1002/j.1460-2075.1986.tb04373.x. [DOI] [PMC free article] [PubMed] [Google Scholar]
- Mizuguchi T, Fudenberg G, Mehta S, Belton JM, Taneja N, Folco HD, FitzGerald P, Dekker J, Mirny L, Barrowman J, et al. Cohesin-dependent globules and heterochromatin shape 3D genome architecture in S. pombe. Nature. 2014 doi: 10.1038/nature13833. [DOI] [PMC free article] [PubMed] [Google Scholar]
- Negre N, Brown CD, Shah PK, Kheradpour P, Morrison CA, Henikoff JG, Feng X, Ahmad K, Russell S, White RA, et al. A comprehensive map of insulator elements for the Drosophila genome. PLoS genetics. 2010;6:e1000814. doi: 10.1371/journal.pgen.1000814. [DOI] [PMC free article] [PubMed] [Google Scholar]
- Nishino Y, Eltsov M, Joti Y, Ito K, Takata H, Takahashi Y, Hihara S, Frangakis AS, Imamoto N, Ishikawa T, et al. Human mitotic chromosomes consist predominantly of irregularly folded nucleosome fibres without a 30-nm chromatin structure. The EMBO journal. 2012;31:1644–1653. doi: 10.1038/emboj.2012.35. [DOI] [PMC free article] [PubMed] [Google Scholar]
- Nora EP, Lajoie BR, Schulz EG, Giorgetti L, Okamoto I, Servant N, Piolot T, van Berkum NL, Meisig J, Sedat J, et al. Spatial partitioning of the regulatory landscape of the X-inactivation centre. Nature. 2012;485:381–385. doi: 10.1038/nature11049. [DOI] [PMC free article] [PubMed] [Google Scholar]
- O'Sullivan JM, Tan-Wong SM, Morillon A, Lee B, Coles J, Mellor J, Proudfoot NJ. Gene loops juxtapose promoters and terminators in yeast. Nature genetics. 2004;36:1014–1018. doi: 10.1038/ng1411. [DOI] [PubMed] [Google Scholar]
- Phillips-Cremins JE, Sauria ME, Sanyal A, Gerasimova TI, Lajoie BR, Bell JS, Ong CT, Hookway TA, Guo C, Sun Y, et al. Architectural protein subclasses shape 3D organization of genomes during lineage commitment. Cell. 2013;153:1281–1295. doi: 10.1016/j.cell.2013.04.053. [DOI] [PMC free article] [PubMed] [Google Scholar]
- Pickersgill H, Kalverda B, de Wit E, Talhout W, Fornerod M, van Steensel B. Characterization of the Drosophila melanogaster genome at the nuclear lamina. Nature genetics. 2006;38:1005–1014. doi: 10.1038/ng1852. [DOI] [PubMed] [Google Scholar]
- Rando OJ. Global patterns of histone modifications. Curr Opin Genet Dev. 2007;17:94–99. doi: 10.1016/j.gde.2007.02.006. [DOI] [PubMed] [Google Scholar]
- Routh A, Sandin S, Rhodes D. Nucleosome repeat length and linker histone stoichiometry determine chromatin fiber structure. Proceedings of the National Academy of Sciences of the United States of America. 2008;105:8872–8877. doi: 10.1073/pnas.0802336105. [DOI] [PMC free article] [PubMed] [Google Scholar]
- Rufiange A, Jacques PE, Bhat W, Robert F, Nourani A. Genome-wide replication-independent histone H3 exchange occurs predominantly at promoters and implicates H3 K56 acetylation and Asf1. Molecular cell. 2007;27:393–405. doi: 10.1016/j.molcel.2007.07.011. [DOI] [PubMed] [Google Scholar]
- Sanyal A, Lajoie BR, Jain G, Dekker J. The long-range interaction landscape of gene promoters. Nature. 2012;489:109–113. doi: 10.1038/nature11279. [DOI] [PMC free article] [PubMed] [Google Scholar]
- Schalch T, Duda S, Sargent DF, Richmond TJ. X-ray structure of a tetranucleosome and its implications for the chromatin fibre. Nature. 2005;436:138–141. doi: 10.1038/nature03686. [DOI] [PubMed] [Google Scholar]
- Sexton T, Yaffe E, Kenigsberg E, Bantignies F, Leblanc B, Hoichman M, Parrinello H, Tanay A, Cavalli G. Three-dimensional folding and functional organization principles of the Drosophila genome. Cell. 2012;148:458–472. doi: 10.1016/j.cell.2012.01.010. [DOI] [PubMed] [Google Scholar]
- Shogren-Knaak M, Ishii H, Sun JM, Pazin MJ, Davie JR, Peterson CL. Histone H4-K16 acetylation controls chromatin structure and protein interactions. Science (New York, NY. 2006;311:844–847. doi: 10.1126/science.1124000. [DOI] [PubMed] [Google Scholar]
- Song F, Chen P, Sun D, Wang M, Dong L, Liang D, Xu RM, Zhu P, Li G. Cryo-EM study of the chromatin fiber reveals a double helix twisted by tetranucleosomal units. Science (New York, NY. 2014;344:376–380. doi: 10.1126/science.1251413. [DOI] [PubMed] [Google Scholar]
- Symmons O, Uslu VV, Tsujimura T, Ruf S, Nassari S, Schwarzer W, Ettwiller L, Spitz F. Functional and topological characteristics of mammalian regulatory domains. Genome research. 2014;24:390–400. doi: 10.1101/gr.163519.113. [DOI] [PMC free article] [PubMed] [Google Scholar]
- Szilard RK, Jacques PE, Laramee L, Cheng B, Galicia S, Bataille AR, Yeung M, Mendez M, Bergeron M, Robert F, et al. Systematic identification of fragile sites via genome-wide location analysis of gamma-H2AX. Nature structural & molecular biology. 2010;17:299–305. doi: 10.1038/nsmb.1754. [DOI] [PMC free article] [PubMed] [Google Scholar]
- Tan-Wong SM, Zaugg JB, Camblong J, Xu Z, Zhang DW, Mischo HE, Ansari AZ, Luscombe NM, Steinmetz LM, Proudfoot NJ. Gene loops enhance transcriptional directionality. Science (New York, NY. 2012;338:671–675. doi: 10.1126/science.1224350. [DOI] [PMC free article] [PubMed] [Google Scholar]
- Tremethick DJ. Higher-order structures of chromatin: the elusive 30 nm fiber. Cell. 2007;128:651–654. doi: 10.1016/j.cell.2007.02.008. [DOI] [PubMed] [Google Scholar]
- Weiner A, Hsieh TH, Appleboim A, Chen HV, Rahat A, Amit I, Rando OJ, Friedman N. High-Resolution Chromatin Dynamics during a Yeast Stress Response. Molecular cell. 2015 doi: 10.1016/j.molcel.2015.02.002. [DOI] [PMC free article] [PubMed] [Google Scholar]
- Weiner A, Hughes A, Yassour M, Rando OJ, Friedman N. High-resolution nucleosome mapping reveals transcription-dependent promoter packaging. Genome research. 2010;20:90–100. doi: 10.1101/gr.098509.109. [DOI] [PMC free article] [PubMed] [Google Scholar]
- Zhang Z, Pugh BF. High-resolution genome-wide mapping of the primary structure of chromatin. Cell. 2011;144:175–186. doi: 10.1016/j.cell.2011.01.003. [DOI] [PMC free article] [PubMed] [Google Scholar]
Associated Data
This section collects any data citations, data availability statements, or supplementary materials included in this article.