

Abstract
Individuals who are high in rejection sensitivity are vigilant toward social cues that signal rejection, and they exhibit attention biases towards information that confirms expectations of rejection. Little is known, however, about the neural correlates of rejection sensitivity. The present study examined whether rejection sensitivity is associated with individuals’ neural responses to rejection-relevant information. Female participants, classified as high or average in rejection sensitivity, completed a modified dot-probe task in which a neutral face was paired with either another neutral face or a gaze-averted (“rejecting”) face while EEG was collected and ERP components were computed. Behavioral results indicated that average rejection sensitive participants showed an attention bias away from rejecting faces, while high rejection sensitive participants were equally vigilant to neutral and rejecting faces. High rejection sensitivity was associated with ERP components signaling elevated attention and arousal to faces. These findings suggest that rejection sensitivity shapes behavioral and neurocognitive responses to faces.
Keywords: Rejection sensitivity, ERP, face processing
1. Introduction
Although everyone experiences social rejection at some point in their lives, individuals vary in the extent to which they are sensitive to potentially rejecting cues. Individuals who are high in rejection sensitivity (RS) “anxiously expect, readily perceive, and overreact” to cues of possible rejection from people in their social environment (p. 1327; Downey & Feldman, 1996). RS is a relatively stable characteristic and is hypothesized to develop in response to a history of painful rejections from significant caregivers (Downey & Feldman, 1996). High RS individuals draw on past experiences of rejection when making predictions about future experiences with relationship partners, expecting partners to reject them in times of need.
This history of rejection in close relationships shapes cognitive processing and contributes to biases in attention to possible experiences of rejection, expectations of rejection in relationships, and interpretations of ambiguous information as evidence of rejection. Indeed, a number of studies have found support for connections between RS and biases in these cognitive processes. For example, in an experimental study of interpersonal relationships among college students, Downey and Feldman (1996) found that high RS individuals were more likely than low RS individuals to perceive an ambiguous social event (i.e., a research study partner who, without explanation, no longer wants to continue in the study after meeting) as a sign of rejection. In other studies, RS has been linked to individual differences in attention to rejecting stimuli (e.g., Downey, Freitas, Michaelis, & Khouri, 1998; Levy, Ayduk, & Downey, 2001). For example, using an Emotional Stroop task paradigm, Berenson and colleagues (Berenson et al., 2009) found that RS was associated with disrupted attentional processes in the presence of words associated with social rejection. Interestingly, this attentional disruption was limited to trials with rejection words (e.g., ignored, disliked) and not trials with negative words that were unrelated to social rejection (e.g., cancer, disaster). In addition, Berenson et al. (2009) found that RS predicted attentional avoidance of angry faces in a visual probe task, again suggesting that RS disrupts social information processing in the presence of potential threat, particularly when the threat is rejection.
Little is known, however, about the neural correlates of RS. To date, only a handful of studies have examined the extent to which individuals differing in RS vary in their physiological responses to rejection-relevant information (e.g., Downey, Mougios, Ayduk, London, & Shoda, 2004). Downey and colleagues (Downey et al., 2004) examined connections between RS and the eyeblink startle response, an indicator of autonomic nervous system activation in response to threat. In this study, high and low RS individuals viewed a series of paintings that had been rated as depicting one of four themes, including acceptance or rejection (RS related), and positive or negative valence (non-RS related). Relative to low RS participants, high RS participants had a potentiated eyeblink startle response for pictures that were rated as high on the rejecting dimension, but they did not differ from low RS individuals in their startle responses during the positive, negative, or accepting picture trials. Further, in an fMRI study, Burklund, Eisenberger, and Lieberman (2007) found that, relative to low RS individuals, high RS individuals had greater activity in the dorsal anterior cingulate cortex in response to viewing facial expressions that portrayed disapproval – a facial expression that could signal impending rejection. Interestingly, these individual differences in brain activity were limited to disapproval faces, and not anger or disgust faces, suggesting that rejection, and not negativity more broadly, contributed to the changes in brain activation. The findings from these two studies suggest that RS is associated with physiological responses to cues of possible rejection, which is consistent with evidence that rejection sensitivity shapes cognitive biases to threatening stimuli.
Event-related potentials (ERPs) provide an opportunity to examine brain activity corresponding to cognitive and affective processes occurring in the context of social information processing about rejection cues. ERPs measure continuous processing, have excellent temporal resolution, and reflect responses to distinct events or experiences (see Luck, 2006). In addition, because ERPs are sensitive to the chronometry of cognitive and affective processing, the amplitudes of a number of ERP components illustrate changes in cognitive processing associated with emotional experiences (Vogel & Luck, 2000). ERPs are time-locked to distinct events and can “pinpoint the time at which attention begins to influence processing” (p. 192, Luck, 2006). To date, no study of RS has incorporated the use of ERP methodology.
The goal of the present study was to explore the cognitive and psychophysiological correlates associated with RS. Specifically, we examined whether individuals high in RS differed from non-RS individuals in the extent to which they exhibited increased attention (i.e., attention bias) toward rejecting faces. In addition, we examined whether this attentional difference would be accompanied by differential ERP amplitudes in components that reflect early attentional processing of emotional stimuli.
We chose to focus on three ERP components that reflect early and relatively automatic attentional processes (for a review, see Luck, 2006). The first component, P1, is a positive-going component elicited within the first 100 milliseconds of presentation of stimuli and largest at the occipital electrodes. Differences in P1 amplitudes reflect attentional and arousal differences in early-stage perceptual processing, rather than differences in complex cognitive processing (Luck, 2006). Thus, given evidence that high RS individuals exhibit attention biases for threatening stimuli (Berenson et al., 2009), we expected that increased attention to potentially threatening stimuli would be associated with greater P1 amplitude in the high RS group (relative to the average RS group). The second component, N1, is an early negative-going visual component appearing just after the P1 and also found at occipital sites. Greater amplitudes for this component have been linked to an ability to discriminate between stimuli (e.g., Mangun, 1995; Vogel & Luck, 2000). Given the N1’s role in attention, we hypothesized that these two groups would differ in their mean N1 amplitude. Lastly, we examined the P2 component, which is associated with sensitivity and hypervigilance toward threatening stimuli (Bar-Haim, Lamy, & Glickman, 2005). Because individuals who are high in RS are hypervigilant for signs of possible rejection, we hypothesized that P2 amplitude would differ as a function of RS.
2. Method
2.1 Participants
Thirty female young adult participants (Mage=19.9, SD = 2.7) participated in this study. In light of evidence that high RS women exhibit rejection-related cognitions and behaviors that differ from men (e.g., rumination, jealousy; Downey & Feldman, 1996), we focused on recruitment of females. University students who voluntarily enrolled in a participant database were pre-screened for RS using the Rejection Sensitivity Questionnaire (RSQ; Downey & Feldman, 1996). Individuals who scored in the top 20th percentile or in the 40 – 60th percentile were invited to participate and were identified as either high rejection sensitive (N = 16; MRSQ = 13.56, SD = 2.41) or average rejection sensitive (N = 14; MRSQ = 8.55, SD = .68), respectively. These two groups significantly differed in their RS, t(28) = −7.51, p < .001. Three participants from the average group were excluded from behavioral analyses due to problems successfully completing the task (e.g., inaccuracy and drowsiness), resulting in a sample of 27 participants for analysis of behavioral responses during the dot-probe task.
2.2 Measures
2.2.1 Rejection Sensitivity Questionnaire
As noted above, participants were pre-screened using the widely used RSQ (Downey & Feldman, 1996). The RSQ (α = .86) consists of 18 items describing social situations where rejection by another person is possible (e.g., “You approach a close friend to talk after doing or saying something that seriously upset him/her”). Following each hypothetical situation, participants are asked to rate (a) how concerned or anxious they would be about the situation and (b) how likely or unlikely they think the chances are of obtaining a positive outcome or acceptance by the person. Scores are generated by multiplying participants’ amount of concern by the reverse score of their expectations of acceptance for each item. Participant responses are averaged across the 18 situations, and possible scores range from 1 (low RS) to 36 (high RS) (scores over 18 are generally rare). As reported by Downey and Feldman (1996), this measure has excellent psychometric properties, including test-retest reliability and construct validity.
2.2.2. Dot-probe experimental stimuli
The face stimuli included photographs of 34 individuals (17 female) maintaining a neutral facial expression (with closed mouth) and both facing and looking forward (neutral; these images served as our control) or facing forward with eyes averted to the left or right (gaze-averted; see Figure 1). These stimuli were created for the present study because we predicted that gaze-averted faces would be a signal of potential rejection. In order to verify this hypothesis, 29 undergraduate students (who did not participate in the full study) completed the RSQ and rated how rejecting they viewed each face on a scale of 1 (not at all rejecting) to 7 (very rejecting). These students were blind to the hypothesis and did not know the individuals in the pictures. A repeated measures ANOVA with rejection sensitivity as a covariate revealed that averted gaze pictures were rated as more rejecting than neutral pictures, F(1, 27) = 24.4, p < .001, η2p= .48, and this effect did not differ as a function of participants’ rejection sensitivity, F(1, 27) = .57, p = .46.
Figure 1.

Sequence of trial presentation in the modified dot-probe paradigm.
Two faces were presented adjacent to each other on a 17″ monitor placed approximately 0.5 meters from the participant. All images were presented on a black background. A white fixation cross, 2.5cm × 2.5cm, was displayed in the center of the screen before the presentation of the faces. Within a trial, both faces were always of the same individual, but during gaze-averted trials, one neutral and one gaze-averted picture were presented together (50% of trials) such that gaze was always directed away from the center of the screen; during the neutral trials, both pictures were neutral faces. All face pictures were 11cm × 8cm. The two faces presented together were an equal distance from the center of the screen, with 11cm separating the two images. After face presentation, a probe appeared in the center of the location previously occupied by one of the faces. Probe arrows were oriented up or down and were 2cm × 1cm.
2.3 Procedure
Participants were given informed consent and were then able to relax while the experimenter prepared the electroencephalogram (EEG) cap. After cap placement, participants were given the task instructions and 20 practice trials in order to ensure they understood the task. Following the practice block, participants completed the dot-probe session, which consisted of 288 trials and was divided into two equal blocks of 144 trials. Figure 1 describes the sequence of events in each trial. A fixation cross was presented in the center of the screen for 500ms. The faces then appeared and remained on the screen for 500ms and were immediately replaced with a probe (an arrow) appearing directly behind one of the two faces. Participants were instructed to press either the left or right button on a button box (counterbalanced across participants) to indicate whether the arrow was pointing up or down as quickly and accurately as possible while also keeping their heads steady. The probe remained on the screen for 500ms. A blank screen then appeared and remained on the screen until the subject responded or for 1100ms if the participant did not respond. A random intertrial interval ranging from 900–1300ms was included so that ERPs from the previous trial did not confound ERPs on the subsequent trial. Participants’ accuracy and reaction times were recorded and event marks coinciding with the presentations of faces were synced with EEG collection.
We examined participants’ responses in order to detect inaccurate button presses and unusually fast or slow reaction times. We excluded trials from analysis if a participant responded incorrectly, in less than 200ms (anticipatory responses), or beyond 2SD above or below her mean reaction time. On average, participants completed 270 out of 288 trials correctly and within 2SD of their mean reaction time.
2.3.1 EEG collection
EEG was recorded throughout the task using a Lycra cap (Electro-Cap Corporation, Eaton, OH) with electrode placement consistent with the international 10–20 system. Recordings were made from 17 scalp locations: F3, F4, F7, F8, T7, T8, C3, C4, P3, P4, O1, O2, M1, M2, Fz, and Pz. Cz was used as a reference site and AFz served as ground during data collection. Eye movements and blinks were detected through the use of EOG electrodes placed above and below the subject’s left eye. Prior to data acquisition, a 50μV 10Hz signal was recorded at all channels for calibration. We ensured all impedances were below 10kΩ before data collection began. The EEG signal was amplified during testing using James Long Company (Caroga Lake, NY) custom bioamplifiers with a gain of 5000 and filtered using a 0.1Hz high-pass and 100Hz low-pass filter. Once amplified, the signal was digitized at 512 Hz using Snap-Master acquisition software (HEM Data Corporation, Southfield, MI).
2.3.2. Data reduction
The EEG Analysis system from James Long Company (Caroga Lake, NY) was used to process and analyze the data. First, EEG was re-referenced to an averaged mastoid montage. Epochs containing blink artifacts were automatically identified and regressed from the EEG. Motor and other artifacts in the EEG signal that exceeded ±150μV were automatically scored and were not included in further analyses. The data were then low-pass filtered at 30Hz. EEG was time-locked to face presentation onset. Averaged ERPs were then created using all trials that were included in the behavioral reaction time analyses (as described above). The data were divided into neutral and gaze-averted trials in order to create two distinct ERP waveforms for each subject. All ERPs were computed with respect to a 200ms baseline immediately preceding face onset. Windows for each component were set based on previous literature and inspection of the grand mean ERPs. Mean amplitude was computed for P1 (80 – 135ms) and N1 (115 – 160 ms) for sites O1 and O2 and P2 (175 – 295ms) for sites P3 and P4.
3. Results
3.1 Rejection Sensitivity and Behavioral Responses
3.1.2 Accuracy
We first assessed participants’ performance on the behavioral task by computing the percentage of correct trials. As expected, accuracy rates were consistently high and did not differ between groups, t(25) = 1.19, p = .25 (see Table 1). With the exception of one participant in the average RS group, whose accuracy was 80%, participants were near ceiling in their accuracy, with an average accuracy rate of 94.0% correct trials.
Table 1.
Participant Behavioral Data During Dot-Probe Task
| Group | RSQ Score | Accuracy | Reaction Time | Congruent Trials | Incongruent Trials |
|---|---|---|---|---|---|
| High RS | 13.6 | 93.3% | 541ms (31ms) | 540ms (31ms) | 543 (31ms) |
| Average RS | 8.4 | 95.7% | 652ms (37ms) | 656ms (38ms) | 648 (37ms) |
Note. Standard errors are in parentheses. RS = rejection-sensitive. RSQ = Rejection Sensitivity Questionnaire.
3.1.3 Reaction times and attention bias
Next, we examined the extent to which participants’ reaction times differed as a function of whether the probe was presented in the same location as the gaze-averted face (i.e., congruent trial) or in the same location as the gaze-neutral face (i.e., incongruent trial). For this analysis, we examined only the trials in which a gaze-averted face was present on the screen. Faster reaction times during congruent trials suggest that the participant was attending to the neutral face immediately prior to the presentation of the probe. In contrast, faster reaction times during incongruent trials suggest that the participant shifted their attention away from the gaze-averted face toward the probe. A repeated measures ANOVA with Trial Type (Congruent/Incongruent) as a within subjects factor and RS Group as a between subjects factor revealed a significant main effect of RS Group, qualified by a significant Trial Type × RS Group interaction (see Table 1). Specifically, across trials, high RS participants had faster reaction times than average RS participants, F(1, 25) = 5.27, p = .030, η2p= .17, and these two groups’ reaction times differed as a function of the trial type (congruent vs. incongruent trials), F(1, 25) = 5.02, p = .034, η2p= .17 (see Figure 2). Pairwise comparisons of the estimated marginal means were examined. In the average RS group, participants responded faster on incongruent trials than on congruent trials (Mdiff = 7.8ms, SE = 2.9, p = .043; see Table 1), suggesting that average RS participants had an attention bias away from the gaze-averted faces, whereas high RS participants did not differ in reaction time across trials (Mdiff = 2.9ms, SE = 3.9, p = .35).
Figure 2.

Participant group reaction times by trial type. Error bars represent standard errors.
3.2 Rejection Sensitivity and Neural Responses
One participant from the average RS group was excluded from ERP analyses due to problems with signal collection, resulting in a sample of 26 participants for analysis of neural responses during the task. Across analyses, no hemispheric differences emerged in participants’ mean ERP amplitudes, so we averaged participants’ ERPs across parallel sites (i.e., O1/O2 and P3/P4). Despite our use of varied intertrial intervals to minimize the impact of prior ERPs on subsequent trials, the ERP baselines have a negative-going slope that was consistent in both groups and across trial types.
We examined Group, Trial Type, and Group × Trial Type effects using repeated measures ANOVAs. We focused on whether the trials included one gaze-averted face (gaze-averted trials) or no gaze-averted faces (neutral trials) rather than probe-congruent vs. incongruent trials because of both the theoretical implications of potential group differences in viewing a gaze-averted face (vs. not) and the fact that the probe had not yet appeared on the screen at the time of face presentation, so that the trial could not be differentiated as a congruent or incongruent trial at the point of analysis.
3.2.1 P1 rejection sensitivity effects
We examined Group and Trial Type differences in participants’ P1 mean amplitude averaged across occipital sites (O1 and O2 between 80 – 135ms). A repeated measures ANOVA with Trial Type (Gaze Trial/Neutral Trial) as a within subjects factor and RS Group as a between subjects factor revealed a significant main effect of Group, F(1, 24) = 4.28, p = .049, η2p= .15 (See Figure 3). Across trials, high RS participants had larger P1 mean amplitudes (M = 2.07μV; SD = 3.99) compared to average RS participants (M = −.94μV; SD = 2.98). No main effect of Trial Type (F[1, 24] = .04, p = .85, η2p = .00) or Trial Type × Group interaction (F[1, 24] = .01, p = .93, η2p = .00) emerged.
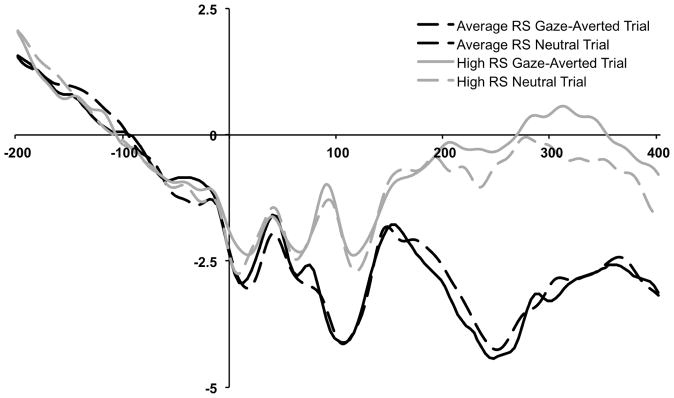
Figure 3.

Grand-averaged ERP waveforms by trial type (neutral, gaze-averted) and group (average rejection sensitive, high rejection sensitive) measured at occipital electrodes. P1 was measured between 80 – 135ms and N1 was measured between 115 – 160ms (both averaged across O1 and O2 electrodes).
3.2.2 N1 rejection sensitivity effects
We next examined differences in N1 mean amplitude averaged across occipital sites (O1 and O2 between 115 – 160ms). A repeated measures ANOVA with Trial Type (Gaze Trial/Neutral Trial) as a within subjects factor and RS Group as a between subjects factor revealed a significant main effect of Group, F(1, 24) = 4.72, p = .04, η2p= .16 (see Figure 3). Relative to the average RS group (M = −2.17μV; SD = 3.53), the high RS group had smaller mean N1 amplitudes (M = 1.48μV; SD = 4.55). No main effect of Trial type (F[1, 24] = .08, p = .78, η2p = .00) or Trial Type × Group interaction (F[1, 24] = .18, p = .68, η2p = .01) emerged.
3.2.3 P2 rejection sensitivity effects
Finally, we examined differences in mean amplitude for P2 (P3 and P4 sites; between 175 – 295ms). A repeated measures ANOVA with Trial Type (Gaze Trial/Neutral Trial) as a within subjects factor and RS Group as a between subjects factor revealed a significant main effect of Group, F(1, 24) = 6.04, p = .022, η2p= .20 (see Figure 4). Relative to the average RS group (M = −3.42μV; SD = 3.41), the high RS group had larger mean P2 amplitudes (M = −.37μV; SD = 2.92). No main effect of Trial type (F[1, 24] = 2.09, p = .16, η2p = .08) or Trial Type × Group interaction (F[1, 24] = .01, p = .91, η2p = .00) emerged.
Figure 4.
Grand-averaged ERP waveforms by trial type (neutral, gaze-averted) and group (average rejection sensitive, high rejection sensitive) measured at parietal electrodes. P2 was measured between 175 – 295ms averaged across P3 and P4 electrodes.
4. Discussion
In the present study, participants who were high in RS displayed hypervigilance toward all face images, evidenced by their faster reaction time to all stimuli and increased P2 amplitude. In contrast, participants with an average score in RS displayed a bias away from the rejecting faces and showed smaller P2 ERP amplitudes. The reaction time findings for average RS participants are consistent with studies reporting attention biases away from threatening stimuli (e.g., Bradley et al., 1997). On the other hand, the lack of attentional difference in high RS individuals between neutral and gaze-averted faces is different from the pattern reported by Berenson et al. (2009), who found that high RS participants showed an attention bias away from angry faces in a dot-probe task. It could be that differences in the types of face presentations – that is, gaze-averted versus emotional faces – contribute to the differences in participants’ attentional patterns across studies. Moreover, the extent to which individuals are expected to show a bias toward versus away from a threatening stimulus has been subject to some debate (Bradley et al., 1997; Williams, Watts, MacLeod, & Mathews, 1988). Some researchers have proposed that anxious individuals demonstrate an avoidance of threatening stimuli when given additional time to process the threat and an attention bias towards threatening stimuli when given only minimal time to process the threat. This avoidance of threat among individuals with average levels of RS may serve an emotion regulation function, reducing distress by minimizing exposure to the threat.
We also found that the two groups differed from each other in their mean amplitudes for several ERP components that reflect early attention processes. Notably, relative to average participants, high RS participants had larger mean P1 amplitudes, suggesting that these participants had an early attentional vigilance to the stimuli. These findings are consistent with the reaction time evidence described above, as high RS participants were faster than average RS participants on the task across (gaze-averted) trials. Based on previous work (Downey et al., 2004), we suspect that RS participants would be vigilant under conditions of social threat (e.g., to faces and images that are highly social and communicative by nature) but not in the context of non-social threat (e.g., snakes, spiders, and other non-threatening images).
Conversely, high RS participants had smaller occipital N1 amplitudes compared to average RS participants. Given evidence that N1 amplitudes are larger when participants discriminate between stimuli (Vogel & Luck, 2000), it is possible that average RS participants allocated more attentional resources to discriminating between the two faces on the screen, as evidenced by their differential reaction times to congruent versus incongruent trials. In contrast, if high RS participants viewed all faces as potentially threatening or rejecting, they might have spent less time trying to differentiate between the facial expressions. This notion is consistent with the lack of attentional bias found in the high RS group.
Lastly, high RS participants had a larger P2 component, relative to average RS participants. This finding is consistent with the notion that greater P2 amplitudes may represent a neural response to threat (e.g., Bar-Haim et al., 2005; Helfinstein, White, Bar-Haim, & Fox, 2008) and suggests that high RS participants were vigilant to the presence of threatening stimuli.
These results reveal individual differences in physiological processing of social cues (i.e., faces with varying expressions). High RS participants had faster reaction times than average RS participants across trial types, which suggests that these participants were more vigilant during the task. It may be that images of facial expressions serve to motivate attention for high RS individuals, and they do not differentially attend to the emotional valence of the cues. Importantly, our findings indicate that high RS individuals differ from average RS individuals at very early perceptual and attention stages of social information processing. Previous research suggested that RS contributed to negative interpretive biases when individuals were presented with ambiguous events (e.g., Downey & Feldman, 1996). Our findings build on this research by highlighting that differences in the processing of social cues emerge within the first tenth of a second after perceiving a social cue – even earlier than interpretational processing in the timeline of social information processing (Crick & Dodge, 1994). This speed of processing has implications for both future research on this topic and possible interventions.
Several remaining questions should be addressed in future research. This study was the first to use gaze-averted face stimuli with high RS individuals, and it will be important to consider other facial cues that may signal possible evidence of rejection (e.g., disgust, contempt facial expressions). Further, we restricted our study design to include only women who were average or high in RS. Given that sex differences exist in the expression of RS (e.g., Downey et al., 1998), research should consider how these behavioral and physiological processes unfold for men. Similarly, we decided to compare high versus average RS participants, rather than low RS individuals, as a conservative test of our hypotheses, and it will be interesting to examine the behavioral and physiological responses of individuals who are low in RS. Our sample size, while comparable to other ERP studies, was small, and future studies with larger samples may be better able to detect group and Trial Type × Group interaction effects. Finally, in the present sample, the ERP baseline has a negative-going slope, which was unexpected. Urbach and Kutas (2006) have noted that the use of a fixation cross prior to a reaction time event (regardless of staggering of timing) may elicit preparatory activity. Thus, baseline activity might indicate that participants were engaging in pre-trial information processing, rather than carryover processing from the previous trial. The fact that baselines did not differ across participant groups or trial types suggests that any activity during baseline had little to no impact on the event-related potentials of interest.
In summary, the current findings are important in that they provide novel evidence concerning the neural correlates of RS and pave the way for further examination of this topic. We encourage other researchers studying RS to utilize ERPs as a way of providing new insight into how individuals process social information.
Participants completed a modified dot-probe task with neutral and rejecting faces
Rejection sensitivity shaped participants’ behavioral responses to face stimuli
Average rejection sensitive females had attention bias away from rejecting faces
High rejection sensitive females exhibited larger P1 and P2 ERPs to rejecting faces
Rejection sensitivity alters individuals’ attention to socially rejecting stimuli
Footnotes
Publisher's Disclaimer: This is a PDF file of an unedited manuscript that has been accepted for publication. As a service to our customers we are providing this early version of the manuscript. The manuscript will undergo copyediting, typesetting, and review of the resulting proof before it is published in its final citable form. Please note that during the production process errors may be discovered which could affect the content, and all legal disclaimers that apply to the journal pertain.
References
- Bar-Haim Y, Lamy D, Glickman S. Attentional bias in anxiety: A behavioral and ERP study. Brain and Cognition. 2005;59:11–22. doi: 10.1016/j.bandc.2005.03.005. [DOI] [PubMed] [Google Scholar]
- Berenson KR, Gyurak A, Ayduk O, Downey G, Garner MJ, Mogg K, Pine DS. Rejection sensitivity and disruption of attention by social threat cues. Journal of Research in Personality. 2009;43:1064–1072. doi: 10.1016/j.jrp.2009.07.007. [DOI] [PMC free article] [PubMed] [Google Scholar]
- Burklund LJ, Eisenberger NI, Lieberman MD. The face of rejection: Rejection sensitivity moderates dorsal anterior cingulated activity to disapproving facial expressions. Social Neuroscience. 2007;2:238–253. doi: 10.1080/17470910701391711. [DOI] [PMC free article] [PubMed] [Google Scholar]
- Crick NR, Dodge KA. A review and reformulation of social information-processing mechanisms in children’s social adjustment. Psychological Bulletin. 1994;115:74–101. doi: 10.1037/0033-2909.115.1.74. [DOI] [Google Scholar]
- Downey G, Feldman SI. Implications of rejection sensitivity for intimate relationships. Journal of Personality and Social Psychology. 1996;70:1327–1343. doi: 10.1037/0022-3514.70.6.1327. [DOI] [PubMed] [Google Scholar]
- Downey G, Freitas AL, Michaelis B, Khouri H. The self-fulfilling prophecy in close relationships: Rejection sensitivity and rejection by romantic partners. Journal of Personality and Social Psychology. 1998;75:545–560. doi: 10.1037/0022-3514.75.2.545. [DOI] [PubMed] [Google Scholar]
- Downey G, Mougios V, Ayduk O, London BE, Shoda Y. Rejection sensitivity and the defensive motivational system: Insights from the startle response to rejection cues. Psychological Science. 2004;15:668–673. doi: 10.1111/j.0956-7976.2004.00738.x. [DOI] [PubMed] [Google Scholar]
- Helfinstein SM, White LK, Bar-Haim Y, Fox NA. Affective primes suppress attention bias to threat in socially anxious individuals. Behaviour Research and Therapy. 2008;46:799–810. doi: 10.1016/j.brat.2008.03.011. [DOI] [PMC free article] [PubMed] [Google Scholar]
- Levy SR, Ayduk O, Downey G. The role of rejection sensitivity in people’s relationships with significant others and valued social groups. In: Leary MR, editor. Interpersonal rejection. New York, NY: Oxford; 2001. pp. 251–289. [Google Scholar]
- Luck SJ. The operation of attention – millisecond by millisecond – over the first half second. In: Ogmen H, Breitmeyer BG, editors. The first half second: The microgenesis and temporal dynamics of unconscious and conscious visual processes. Cambridge, MA: MIT; 2006. pp. 187–206. [Google Scholar]
- Mangun GR. Neural mechanisms of visual selective attention. Psychophysiology. 1995;32:4–18. doi: 10.1111/j.1469-8986.1995.tb03400.x. [DOI] [PubMed] [Google Scholar]
- Urbach TP, Kutas M. Interpreting event-related brain potential (ERP) distributions: Implications of baseline potentials and variability with application to amplitude normalization by vector scaling. Biological Psychology. 2006;72:333–343. doi: 10.1016/j.biopsycho.2005.11.012. [DOI] [PubMed] [Google Scholar]
- Vogel EK, Luck SJ. The visual N1 component as an index of a discrimination process. Psychophysiology. 2000;37:190–203. doi: 10.1017/S0048577200981265. [DOI] [PubMed] [Google Scholar]