Abstract
Purpose
The present study is aimed at understanding how the interactions between sugar molecules and phosphate ions affect the glass transition temperature of their mixtures, and the implications for pharmaceutical formulations.
Methods
The glass transition temperature (Tg) and the α-relaxation temperature (Tα) of dehydrated trehalose/sodium phosphate mixtures (monobasic or dibasic) were determined by differential scanning calorimetry and dynamic mechanical analysis, respectively. Molecular dynamics simulations were also conducted to investigate the microscopic interactions between sugar molecules and phosphate ions. The hydrogen-bonding characteristics and the self-aggregation features of these mixtures were quantified and compared.
Results
Thermal analysis measurements demonstrated that the addition of NaH2PO4 decreased both the glass transition temperature and the α-relaxation temperature of the dehydrated trehalose/NaH2PO4 mixture compared to trehalose alone while both Tg and Tα were increased by adding Na2HPO4 to pure trehalose. The hydrogen-bonding interactions between trehalose and HPO42− were found to be stronger than both the trehalose-trehalose hydrogen bonds and those formed between trehalose and H2PO4−. The HPO42− ions also aggregated into smaller clusters than H2PO4− ions.
Conclusions
The trehalose/Na2HPO4 mixture yielded a higher Tg than pure trehalose because marginally self-aggregated HPO42− ions established a strengthened hydrogen-bonding network with trehalose molecules. In contrast H2PO4− ions served only as plasticizers, resulting in a lower Tg of the mixtures than trehalose alone, creating large-sized ionic pockets, weakening interactions, and disrupting the original hydrogen-bonding network amongst trehalose molecules.
Keywords: glass transition, trehalose, phosphate, hydrogen bond, molecular dynamics simulation
INTRODUCTION
Vitrification (also known as glass formation) is one of the most reliable approaches to achieve desirable food and pharmaceutical storage conditions, and the stabilization of liable biomaterials (1). Sugars are commonly used in these vitrification-based applications as stabilizing excipients or lyoprotectants. For instance, many pharmaceutical formulations possess a significant amorphous character, either as the intended outcome of the matrix used for freeze-drying or because of the large molecular size of the preserved ingredient (e.g., polymers and proteins) (2). Freeze-dried pharmaceutical formulations generally contain several solute components, such as the drug itself, pH buffers, bulking agents, and stabilizing excipients. Sugars are often added to protect the active ingredient against loss of biochemical activity and chemical degradation, often in combination with other components such as inorganic or organic salts and biopolymers. Sodium chloride (NaCl) and potassium chloride (KCl), for example, are two electrolyte additives commonly included in stabilizing media for the purpose of oncotic control. Phosphate salts are often used as pH buffers in many kinds of protein formulations (2).
The addition of salts or pH buffers, while important for maintaining a physiologic milieu, may cause various and, in some cases, undesirable effects on the thermophysical properties of the pharmaceutical matrix preserved in the amorphous state, such as a change in the glass transition temperature (Tg), which is one of the most valuable parameters for guiding biopreservation applications. For example, dehydrated lactose mixed with 10% (molar fraction) NaCl or KCl was reported to have a slightly lower Tg (Δ Tg =~5 °C) than pure lactose (3). Similarly, the addition of tris buffer (consisting of hydroxymethyl aminomethane, citric acid and fructose) to sucrose or trehalose caused a gradual decrease in the Tg of the sugar/tris buffer mixture with increasing concentration (4). In our previous work we showed that the Tg of anhydrous trehalose/choline dihydrogen phosphate mixtures varied in a non-monotonic manner with the mass fraction of trehalose, but, in general, adding choline dihydrogen phosphate decreased the Tg of the mixture compared to pure trehalose (5). Choline dihydrogen phosphate is member of a family of biocompatible organic salts that have been investigated recently for their protein stabilizing characteristics for Cytochrome c (6), lysozyme and interleukin-2 (7).
In contrast to these studies, the combinations of sugars with other ions were found to be superior to sugars alone in terms of increasing the glass transition temperature, which may benefit the stabilization of liable biomolecules (8). For example, it was reported that the mixture of lactose and calcium chloride (CaCl2) or magnesium chloride (MgCl2) (molar ratio: 9:1) increased the Tg by more than 10 °C compared to pure lactose. Miller et al. (9) reported that the Tg of freeze-dried trehalose/sodium tetraborate mixtures was considerably higher than trehalose alone, which could be responsible for the enhanced stabilization effects when preserving lactate dehydrogenase in trehalose/borax mixtures. Interestingly, it was observed that freeze-dried sugar/phosphate mixtures had different Tg behaviors when the pH values of their pre-lyophilized aqueous solutions were adjusted (8). For example, sucrose/phosphate mixtures (either sodium or potassium as cations) exhibited an increase in Tg of up to 40 °C when the pH was adjusted from 4 to 9 compared to pure sucrose. For trehalose, however, the addition of phosphate ions could increase the Tg only at pH values greater than 6.6. At lower pH values the Tg was decreased when phosphate was added to pure trehalose (8).
Multiple theories have been proposed in order to understand the glass transition characteristics of glass-forming mixtures, especially containing sugars. The Tg of various glass-forming mixtures was early predicted by assuming the ideal mixing of free volumes, which provided the theoretical foundation for the Fox, Gordon-Taylor and Couchman-Karasz relations (5, 10). But the validity of these Tg -predicting models and, further, the free volume theory has been challenged recently (5, 10, 11). For example, van der Sman (10) demonstrated that the glass transition temperature of a multitude of mixtures containing hydrogen-bonding compounds correlated strongly with the effective number of hydroxyl (-OH) groups per molecules (i.e., the number of -OH groups available for forming intermolecular hydrogen bonds), which is in agreement with topological constraint theory (12, 13) rather than the free volume theory. But deviations from van der Sman’s concept were found for anhydrous sugar/polymer and sugar/polyol mixtures, mainly due to non-ideal mixing or micro-heterogeneity, which is also a very common phenomenon observed for sugar/salt mixtures (5). Because of these complex and varied interactions between salts and sugars, none of the existing theories is capable of directly explaining the Tg behavior of sugar/phosphate mixtures.
Although it is known that the Tg behaviors of sugar/salt mixtures is related to the hydrogen-bonding network of the mixture (14, 15), it is still not well understood why the hydrogen-bonding interactions between sugar and certain ions can increase the Tg of the mixture while others cannot. The case of trehalose/phosphate mixtures provides a good example. Specifically, the pH-dependent Tg profile for trehalose and phosphate buffer is essentially related to the interactions between trehalose and the two predominant species (H2PO4− and HPO42−) of the phosphate ion within different pH ranges (8, 16), yet little is known about the molecular nature of these interactions. In addition to hydrogen-bonding, these Tg behaviors could involve other mechanisms such as micro-heterogeneity. The current study is aimed at elucidating some of these molecular characteristics. Differential scanning calorimetry (DSC) and dynamic mechanical analysis (DMA) were used to quantify the effects of adding sodium phosphate (monobasic and dibasic, respectively) to trehalose, with respect to the characteristic temperatures associated with the glass transition, namely, the glass transition temperature and the α-relaxation temperature (Tα). Molecular dynamics (MD) simulations were performed on the same compositions. The predominance of geometrically defined hydrogen bonds and ionic self-aggregation phenomenon were statistically analyzed in order to differentiate the hydrogen-bonding networks existing in these sugar/phosphate mixtures.
MATERIALS AND METHODS
Sample Preparation
High-purity α,α-trehalose dihydrate was purchased from Ferro Pfanstiehl Laboratories (Waukegan, IL). NaH2PO4 and Na2HPO4 were purchased from Sigma-Aldrich (St. Louis, MO). Aqueous trehalose/NaH2PO4 and trehalose/Na2HPO4 solutions, 20% (w/v), were prepared by adding appropriate masses of components to 18.2 MΩ·cm water, to achieve a molar ratio, R, of phosphate to trehalose of 0, 0.125, 0.296, 0.579 and 1. Measurements of pH were acquired using a Mettler-Toledo SevenMulti pH/conductivity meter (Columbus, OH). Amorphous trehalose/phosphate mixtures were obtained by freeze-drying 10 ml volumes of the solutions with a VirTis BenchTop lyophilizer (SP Scientific, Stone Ridge, NY). The freeze-dried samples were stored in a desiccator over P2O5 and immediately used as required to avoid potential phase separation in compositions of high R value.
Tg Determination
A Sensys Evo TG-DSC (Setaram, France) was used to determine the glass transition temperature of amorphous trehalose/phosphate mixtures. The last trace of water in the sample was removed by melting ~10 mg of lyophilized sample at 220 °C in an aluminum crucible on a hot plate and quenching the melt at ambient temperature (~22 °C) to achieve the glass (5). This temperature (220 °C) is above the melting point of crystalline trehalose-β (205 °C) (17) and below the decomposition temperature of trehalose (230 °C) (18). Three samples were prepared for each composition. Each quenched sample was immediately sealed and loaded into the DSC followed by a heating/cooling/heating protocol between 30 °C and 160 °C with a scanning rate of 10 °C/min. The mid-point of the step change of the heat capacity occurring in the second heating scan was defined as the Tg. An empty crucible was used as a reference and high-purity N2 was used as the purge gas.
Tg Determination
A DMA (Q800, TA Instrument, USA) was used to determine the α-relaxation temperature of the dehydrated samples. Each of the lyophilized trehalose/phosphate mixtures was contained within a stainless steel material pocket (Perkin-Elmer, Norwalk, CT) and melted on a 220 °C hot plate. The anhydrous glassy state was obtained by quenching the sample at ambient temperature and immediately subjecting it to a heating scan of 10 °C/min to 220 °C at an oscillation frequency of 1 Hz. The α-relaxation behavior is revealed by precise features in the temperature dependence of the viscoelastic properties such as a noticeable peak of E" during the glass transition. The temperature corresponding to the E" peak was identified as the Tα in this study. The DMA was calibrated in the single-cantilever mode at 1 Hz using a standard polycarbonate bar before experimentation. High-purity N2 was used as the purge gas.
Simulation Methods
The MD simulations in this study were conducted using a NAMD (19) simulation package. The all-atom CHARMM36 force fields for α,α-trehalose (20) and the modified TIP3P water model (21) were employed. The forcefield parameters for phosphate anions were developed by using the atom-typing toolset MATCH developed recently by Yesselman et al (22). 216 trehalose molecules were randomly mixed with 0, 27, 64, 125 or 216 H2PO4− or HPO42− anions (Na+ cations were added to maintain the electrical neutrality in the mixture), respectively. The corresponding molar ratio R of phosphate to trehalose was 0, 0.125, 0.296, 0.579 or 1. A 20 ns isothermal-isobaric equilibration was conducted at 550 K to achieve complete mixing of the trehalose/sodium phosphate melts. The simulation systems were then subjected to a temperature step decrease of 20 K for every 600 ps until 250 K. A temperature step increase of 20 K for every 600 ps was conducted subsequently until 550 K. Therefore, a cooling/heating rate of 3.125 × 10¹⁰ K/s was achieved, which is consistent with the rates used in other modeling efforts in the literature (23–26). Other simulation parameters are the same as those reported in the previous study (26, 27). A separate 5 ns equilibration was conducted at 530 K and 290 K, respectively, for each composition to demonstrate that the 600 ps step is long enough to achieve equilibration for hydrogen-bonding analysis. For comparison purposes, 20 ns equilibration and then 5 ns run for analysis at 480 K were also conducted for the sucrose/phosphate mixture with R=0.579.
Hydrogen-Bonding Analysis
Hydrogen bonds in the simulation systems were identified via the geometric criteria. A certain aggregate between two O atoms can be regarded as a hydrogen bond only if the distance between them does not exceed (values given in Table 1) and the angle O-H⋯O is greater than β (150° or 90° was used in this study). The position of the first minimum of the radial distribution function, g00(r), was selected as the cut-off distance, , (27). The utilization of a cut-off distance between the hydrogen atom and H-acceptor (i.e., O⋯H) was found to have a negligible effect on the results in this study.
Table 1.
The values of for characterizing hydrogen bonds involving different types of O atoms in phosphate (ph) anions.
| Hydrogen Bond (H-Donor - H-Acceptor) | |||||||
|---|---|---|---|---|---|---|---|
| Tre-Tre | Tre-HPO42− | HPO42−-Tre | Tre-H2PO4− | H2PO4−-Tre | ph-ph | ||
| 3.6 Å | 3.0 Å | 4.0 Å | 4.0 Å | 4.0 Å | 4.0 Å | ||
The dynamics of the hydrogen-bonding network in the mixture were studied by examining the lifetime of hydrogen bonds. The hydrogen bond time correlation function CHB(t) for the pairs i and j is defined as:
| (1) |
where hij(t) equals 1 if the O atom i is hydrogen bonded with O atom j at 0 and t and the bond has not been broken in the meantime for a period longer than t* (28). In this study t*=0.6 ps and the above equation produces the continuous hydrogen bond time correlation function CHBc(t). The hydrogen bond lifetime τHB can be obtained from the following equation: (28)
| (2) |
RESULTS AND DISCUSSION
Characteristic Temperatures Associated with Glass Transition Determined by DSC, DMA and MD Simulation
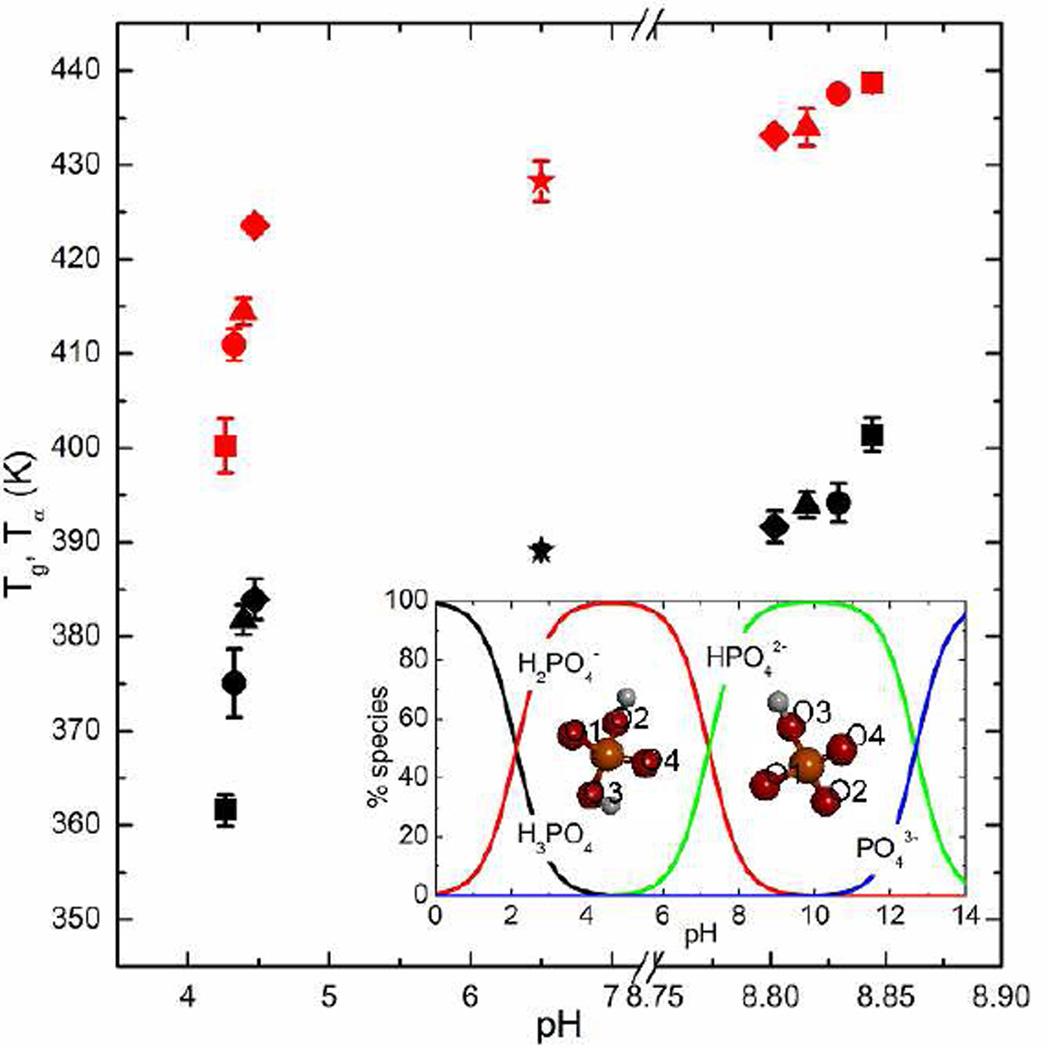
The pH values of the aqueous trehalose/sodium phosphate (Na2HPO4 or NaH2PO4) solutions (20%, w/v) prepared in this study are shown in Fig. 1. By adding Na2HPO4 into the aqueous trehalose solution, the resulting ternary solution had an average pH of around 8.802–8.844 as R rises from 0.125 to 1, compared to pH=6.500 for the 20% w/v aqueous trehalose solution. As a result of adding NaH2PO4 into the aqueous trehalose solution, the average pH value ranged from 4.474 (R=0.125) to 4.265 (R=1). The standard deviation of the pH measurement is less than 0.015. The phosphoric acid speciation (25 °C) is presented in the inset graph (16) with the indices for the oxygen atoms in these two anions, which illustrates that within the range of 8.802–8.844 the ion HPO42− dominates significantly while within the pH range of 4.265–4.474 the dominant phosphate species in the mixture is H2PO4−.
Fig. 1.
The glass transition temperature (black) and α-relaxation temperature (red) profiles as a function of pH of trehalose/sodium phosphate mixtures of various (Symbols star, diamond, triangle, circle and square represent =0, 0.125, 0.296, 0.579 and 1, respectively). The inset presents the phosphoric acid speciation diagram at 25 °C and the indices for oxygen atoms in dihydrogen phosphate and hydrogen phosphate anions.
Fig. 1 also illustrates the Tg and Tα profiles measured by DSC and DMA, respectively. It can be observed that by gradually adding Na2HPO4 until a 1:1 molar ratio is achieved, the glass transition temperature of the dehydrated trehalose/Na2HPO4 mixtures rises to 401.5 K (128.3 °C), compared to 389.1 K (115.9 °C) for trehalose alone. For the mixture of trehalose/NaH2PO4, the average value of Tg drops to 361.7 K (88.5 °C) at R=1, resulting in a nearly 30 K decrease in Tg. It was found in this study that the maximum increase (about 12 K) by adding Na2HPO4 is less than that of the decrease resulting from the addition of NaH2PO4. In the work by Ohtake et al. (8), the Tg of trehalose/phosphate mixtures of R=1 at pH=~9 was around 408.2 K (135 °C) and when pH=~4 the Tg was slightly above 373.2 K (100 °C). The moderate differences between the Tg values in this study and those reported in the literature could be attributed to the different thermal histories of the samples loaded into the DSC (i.e., freeze-drying in the literature and freeze-drying and melt-quenching in this study) and/or small overall composition differences due to preparation method. The Tα profile yields a similar phenomenon: a 12.4 K increase in Tα by adding Na2HPO4 from R=0 to R=1 and a 28.1 K decrease when adding NaH2PO4 to trehalose with R rising from 0 to 1. It should be noted that Tg and Tα should not be considered fully equivalent since the sample is subjected to stresses of a different physical nature (e.g., temperature change in DSC and shearing or compression in DMA) (28). Values that are more closely correlated between methods can be obtained by adjusting the heating rate and oscillation frequency of DMA, but this type of systematic study of scanning rates and frequencies was not of interest for the current study.
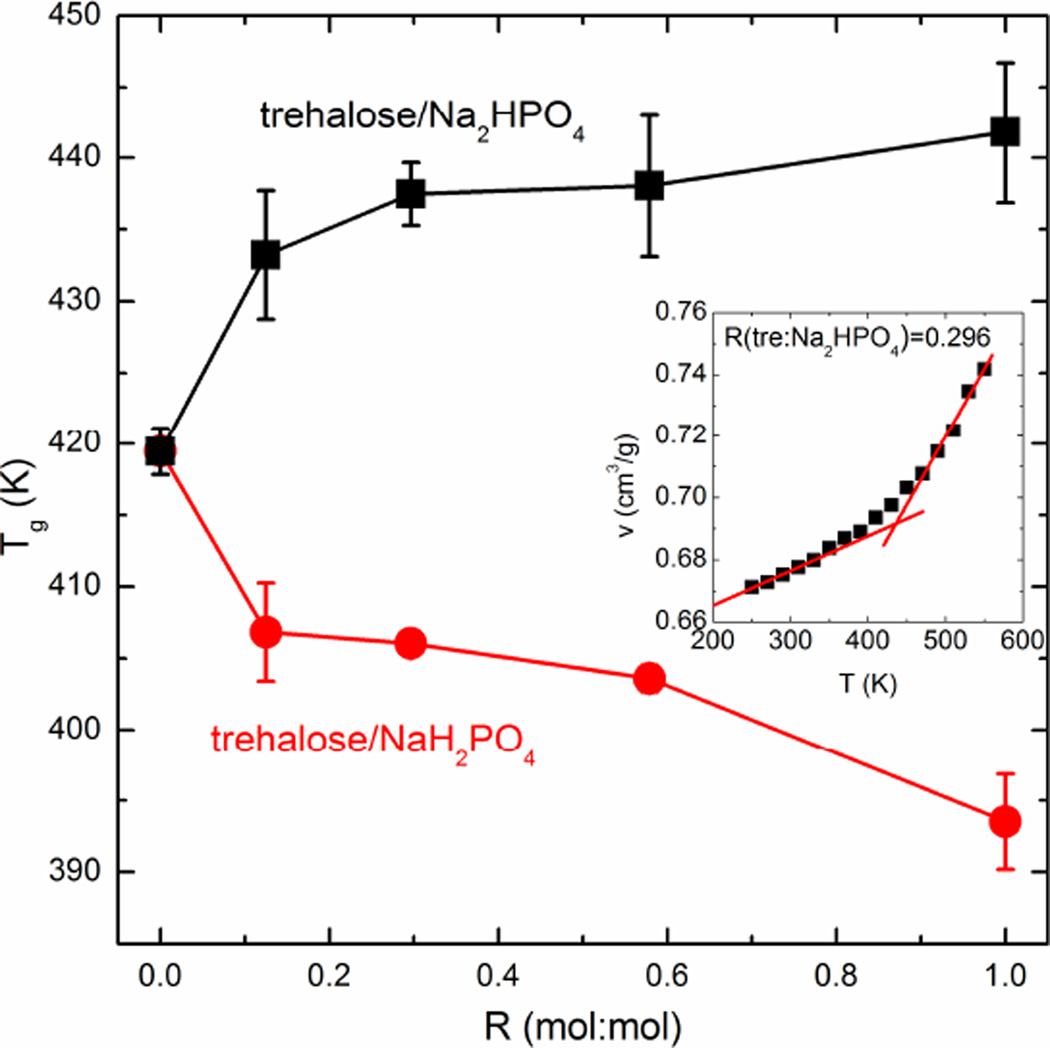
The MD simulations captured the main features of the Tg behavior detected by DSC and DMA. Fig. 2 displays the Tg profile obtained from the MD simulation results as a function of R. The Tg was determined using the specific volume (v) profile as a function of T generated by the simulation during the cooling and heating simulation protocols. As represented in the inset of Fig. 2, two linear fits were obtained for both the lower and higher regions of temperature, resulting in an intersection point that represents the glass transition temperature. The v values shown in Fig.2 were the average of v at the same temperature in the cooling and heating scans since the v profiles were essentially identical. Three to five data points from each region were used to obtain the linear best-fits, which allowed us to statistically calculate the mean value and standard deviation for Tg. In Fig.2, the Tg of the final mixture decreased with the addition of NaH2PO4 into pure trehalose. Based on the simulation prediction, however, the addition of Na2HPO4 did not result in a statistically significant increase in Tg, even though the mean value increased slightly. Although the absolute Tg values were not exactly reproduced by our MD simulation, the effects on Tg of adding different phosphate species and the change of Tg by increasing the added phosphate ions given by the simulation were very consistent with both DSC and DMA measurements. This being the case, the MD simulation should be able to probe the molecular origin of the Tg behavior of the trehalose/phosphate mixtures.
Fig. 2.
The Tg-R profile of trehalose/sodium phosphate mixtures predicted based on the specific volume profile obtained by the MD simulation
Distinguishable Difference in Hydrogen-Bonding Characteristics between Trehalose/HPO42− and Trehalose/H2PO4−
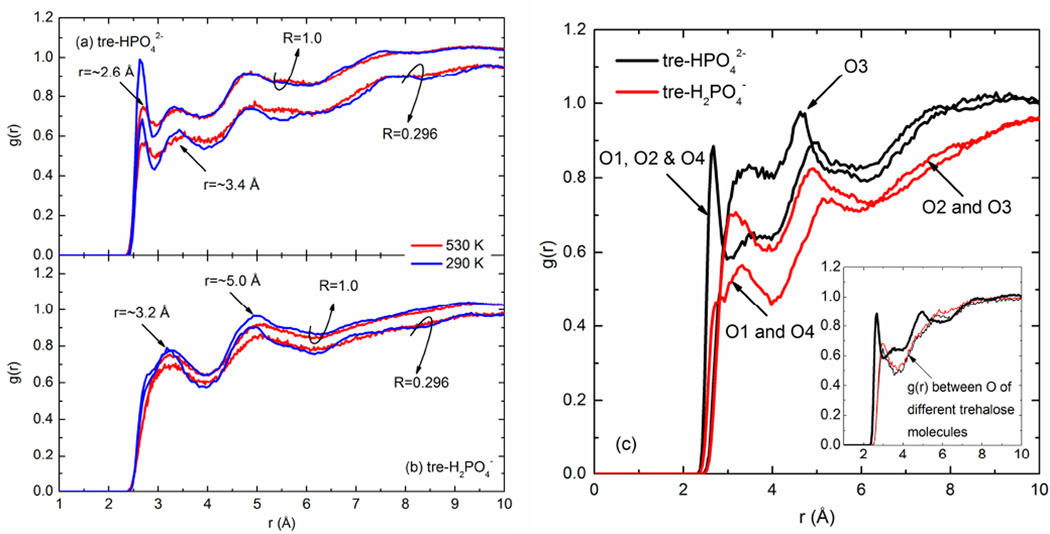
It was found that the hydrogen-bonding-related analysis based on the 600 ps simulation at 530 or 290 K was not statistically different from the corresponding analysis based on the 5 ns simulation at the same temperature, which indicated that the simulation system had achieved equilibrium within the 600 ps step. Figs. 3(a) and (b) show the radial distribution functions g(r) of Otre-Oph at 530 and 290 K, respectively, in the trehalose/sodium phosphate mixtures. Otre represents the oxygen atoms in a trehalose molecule and Oph the O atoms in either HPO42− or H2PO4− anions. The temperatures 530 K and 290 K were chosen to be representative of the liquid and glassy states, respectively. As shown in Figs. 3(a) and (b), it is clear that the interactions between O atoms in trehalose and HPO42− are closer and stronger than those interactions between O atoms in trehalose and H2PO4−. A sharp g(r) peak for O pairs between trehalose and HPO42− firstly appears at around 2.6 Å, compared to a broad first peak at ~3.2 Å for O pairs between trehalose and H2PO4−. Note that the r positions for these g(r) peaks vary marginally with molar ratios and temperatures. Multiple g(r) peaks were observed in Figs. 3(a) and (b), largely related to different types of O atoms in the phosphate anions involved (e.g., O1, O2 and O4 in HPO42− with no H atoms bonded, compared to O3 covalent-bonded to one H atom). To illustrate these differences, Fig. 3(c) presents the g(r) profiles for different types of O atoms in the phosphate anions interacting with Otre, taking the composition R=0.579 at 530 K as an example. It can be observed that the first peak in Fig. 3(a) corresponds to the interactions between the O atoms in trehalose and the O atoms in HPO42− that are not covalent-bonded to H (i.e., O1, O2 and O4). The pairs between O in trehalose and O3 in HPO42− have less distinguishable peaks, most of which are at r>3 Å, compared to the pairs Otre-O1/O2/O4. It is notable that the first peak for the pair Otre-O1/O2/O4 (in HPO42−) exists at an even closer position than the first peak for the Otre-Otre pairs (at 3 Å as shown in the inset of Fig. 3(c)). With regard to H2PO4−, the peak positions for both the Otre-O1/O4 pairs and Otre-O2/O3 pairs generally agree with one another, presenting a relatively broad peak appearing firstly at ~3.2 Å. The results shown in Fig. 3 can in part demonstrate the topological proximity of the interactions between HPO42− ions and trehalose molecules.
Fig. 3.
The radial distribution functions of O pairs between trehalose molecules and (a) hydrogen phosphate or (b) dihydrogen phosphate anions and (c) g(r) breakdown based on various types of oxygen atoms in the mixture (R=0.579) at 530 K, where R is the molar ratio of trehalose to phosphate. The g(r) between oxygen atoms of different trehalose molecules was overlaid on that of Otre-O1/O2/O4 (in HPO42−) in the inset.
Furthermore, different values of (corresponding to the positions of the first minima of g(r)) are useful for characterizing the various hydrogen bonds that exist in the trehalose/sodium phosphate mixtures, as explained in Table 1. Unless otherwise indicated, β=90° was used in this study since the value of β was found to mainly affect the absolute number of hydrogen bonds rather than the comparisons between different compositions as discussed later.
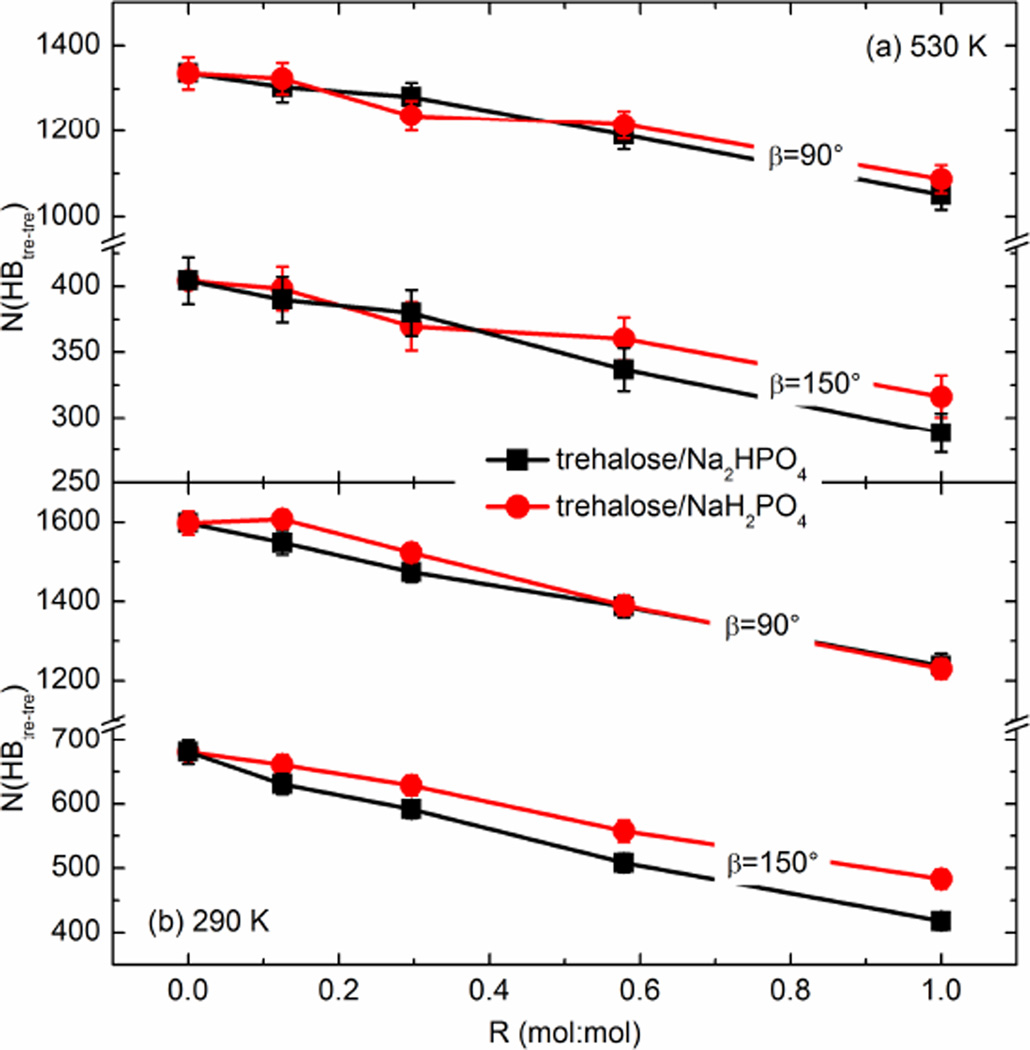
Fig. 4 shows the average number of hydrogen bonds formed among trehalose molecules in the mixtures of various R at 530 K and 290 K. As expected, the hydrogen bonds between trehalose molecules were reduced upon adding either Na2HPO4 or NaH2PO4. This is mainly because the phosphate anions were able to interact with hosting molecules (i.e., trehalose), leading to an inevitable disruption of the hydrogen-bonding network originally existing in pure trehalose. Because the hydrogen bonds were determined geometrically in this study (different values of were used), the increase in tre-phosphate hydrogen bonds with the rising R (shown in Fig. 5) and the decrease in tre-tre hydrogen bonds (shown in Fig. 4) can only be compared in a qualitative, not an absolute sense. At 530 K, for instance, the average number of tre-tre hydrogen bonds decreased from 1336.1 in the pure trehalose to 1050.2 when the molar ratio of Na2HPO4 to trehalose reached 1 (in the case of β=90°). Similarly, when adding NaH2PO4 at 530 K, N (HBtre–tre) decreased gradually to 1086.9 (R=1.0). By restraining the linearity of hydrogen bonds under investigation (i.e., using β=150°), the numbers of hydrogen bonds geometrically identified were substantially and systematically smaller than the results given by using β=90°, but the variation of N (HBtre–tre) with the changing molar ratio was conserved. At a given temperature, the differences in N (HBtre–tre) between the trehalose/Na2HPO4 and trehalose/NaH2PO4 mixtures were not statistically significant in almost all cases. Therefore, in terms of N (HBtre–tre), the hydrogen-bonding network among trehalose molecules was disrupted quantitatively similarly by adding Na2HPO4 or NaH2PO4. The tre-tre hydrogen-bonding quantity was enhanced in the glassy state compared to the liquid state, which was also found to be true in the case of hydrogen bonds between trehalose and phosphate ions (see Fig. 5). Such differences are mainly due to the fact that in the amorphous matrix the mobility of molecules and ions is significantly retarded and the arrangement of the matrix becomes more compact, which can increase the number of hydrogen bonds in the glassy state.
Fig. 4.
The total number of hydrogen bonds formed among trehalose molecules in the trehalose/sodium phosphate mixtures. (a) 530 K and (b) 290 K
Fig. 5.
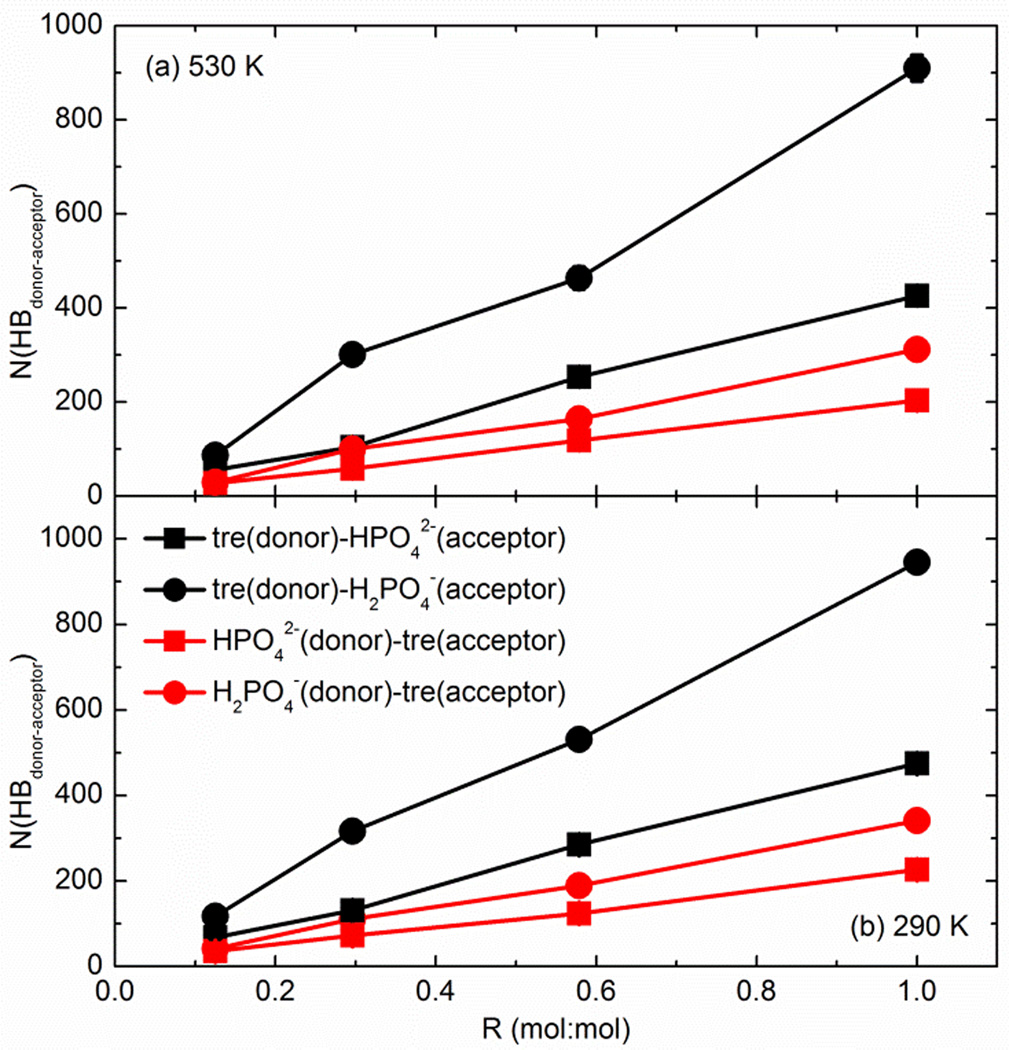
The total number of hydrogen bonds formed between trehalose molecules and phosphate ions in the trehalose/sodium phosphate mixtures. (a) 530 K and (b) 290 K
Accompanying the similar interruption of Na2HPO4 or NaH2PO4 to the hydrogen-bonding network among trehalose molecules, we found that, at the same temperature and molar ratio, the number of hydrogen bonds between trehalose and H2PO4− was systematically higher than those between trehalose and HPO42−, particularly at larger R values, as illustrated in Fig. 5. Specifically, for R=1 the value of (=910.1) is 113.6% larger than (=426.1) at 530 K and the relative difference is still 99.4% when the glassy state was achieved. The phenomenon was similar for hydrogen bonds formed between phosphate as H-donor and trehalose as H-acceptor. It should be noted that trehalose molecules interacting with phosphate anions via hydrogen bonds are much more likely to act as the H-donor rather than H-acceptor, which implies that the mainstay of the interacting network between trehalose and phosphate consists of the hydrogen bonds of tre-HPO42−/H2PO4− with trehalose molecules donating the H atoms. This is in part because the trehalose molecule has significantly more -OH groups available for donating H than its phosphate counterparts.
Table 2 explains the hydrogen-bonding characteristics of phosphate anions. It is noteworthy that the number of hydrogen bonds formed among dihydrogen phosphate anions is substantially higher than those among hydrogen phosphate anions. This is partly because H2PO4− has one more H than HPO42− which can increase the probability of forming H-bonds between different H2PO4− ions. However, the relative lack of H-donors in HPO42− ions could contribute to the very low number of hydrogen bonds among HPO42− ions. It is tempting to simply attribute the quantitative difference to the one extra H atom in H2PO4−, but given that the difference is in an order of magnitude in the liquid state and even two orders of magnitude in the glassy state, other contributing factors should be taken into account, such as the self-aggregation or micro-heterogeneity, which will be discussed in the next subsection.
Table 2.
Number (Mean±SD) of H-bonds formed between phosphate ions in the trehalose/phosphate mixtures at 290 K and 530 K, respectively. (β=150°)
| R | 290K | 530K | ||
|---|---|---|---|---|
| HPO42−-HPO42− | H2PO4−-H2PO4− | HPO42−-HPO42 | H2PO4−-H2PO4− | |
| 0.125 | 0.04±0.20 | 4.24±1.62 | 0.69±0.79 | 5.16±2.17 |
| 0.296 | 0.71±0.81 | 14.00±2.93 | 1.22±1.04 | 12.69±3.19 |
| 0.579 | 1.43±1.08 | 34.50±4.68 | 1.54±1.25 | 28.83±4.90 |
| 1.0 | 0.93±0.89 | 53.88±5.72 | 2.59±1.54 | 45.87±6.46 |
Given the Tg behaviors obtained by the experimental measurements, and the data presented thus far, it is still puzzling that the Tg of the trehalose-based mixture increased upon the addition of HPO42− but decreased by the addition of H2PO4−, especially given that the hydrogen-bonding network among trehalose molecules was similarly disrupted by both ions, and H2PO4− ions formed more hydrogen bonds with trehalose than HPO42− did. One of the key factors that should be taken into consideration to elucidate this phenomenon is the strength of the hydrogen bonds, which has been implicitly discussed in the previous g(r) analysis.
We statistically calculated the average distances between the H-donor (D) and the H-acceptor (A) O atoms and between the H-acceptor and the H atom, as explained in Table 3. It can be observed that the average D⋯A distance between trehalose and HPO42− (2.744 Å at 530 K and 2.727 Å at 290 K) is quite smaller than those between trehalose and H2PO4− (3.305 Å at 530 K and 3.271 Å at 290 K) and among trehalose molecules (3.146 Å at 530 K and 3.098 Å at 290 K). It is worth noting that the value 3.098 Å at 290 K is close to the FTIR estimation of D⋯A distances for glassy sugars including sucrose and trehalose (29). The comparisons are the same in terms of the average H⋯A distances. It is also evident that the hydrogen bond distance in the liquid state is always longer than those in the glassy state in the same conditions, which denotes the decrease in the hydrogen bonding strength with the rising temperature (29). For geometrically defined hydrogen bonds, a closer interaction between the donor and acceptor can give rise to a stronger hydrogen bond (30, 31). It has been shown that the kinetic, potential and dissociation energies decreased exponentially with the increasing hydrogen bond length (i.e., D⋯A and H⋯A) (32). In other words, the original hydrogen bonds among trehalose molecules were replaced by the stronger trehalose-HPO42− hydrogen bonds upon the addition of hydrogen phosphate but were replaced by weaker trehalose-H2PO4− hydrogen bonds in the mixture of trehalose/sodium dihydrogen phosphate. We also statistically calculated the D⋯A and H⋯A distances in the aqueous trehalose solution investigated in our previous work (26). The results show that the D⋯A and H⋯A distances for tre-water H-bonds are 2.9±0.2 Å and 2.0±0.2 Å, respectively, are close to those for tre-tre H-bonds (3.0±0.2 Å and 2.0±0.2 Å, respectively). It is clear that water, as a well-known plasticizer, has interactions with trehalose geometrically similar to tre-tre hydrogen bonds, which is similar to the case for trehalose/NaH2PO4 mixtures. These results were obtained by analyzing the simulation data of a 79.6 wt% trehalose/water mixture at 350 K (26).
Table 3.
Geometric characteristics of hydrogen bonds formed among various molecules and ions in the trehalose/phosphate mixture with R=0.579 at 530 K and 290 K, respectively (Mean±SEM).
| H-bond | r (Å) at 530 K | r (Å) at 290 K | ||
|---|---|---|---|---|
| D…A | H…A | D…A | H…A | |
| Tre-HPO42− | 2.744±0.003 | 1.914±0.006 | 2.727±0.003 | 1.871±0.005 |
| Tre-H2PO4− | 3.305±0.009 | 2.683±0.012 | 3.27±0.007 | 2.634±0.009 |
| Tre-Tre | 3.146±0.006 | 2.476±0.009 | 3.098±0.002 | 2.395±0.004 |
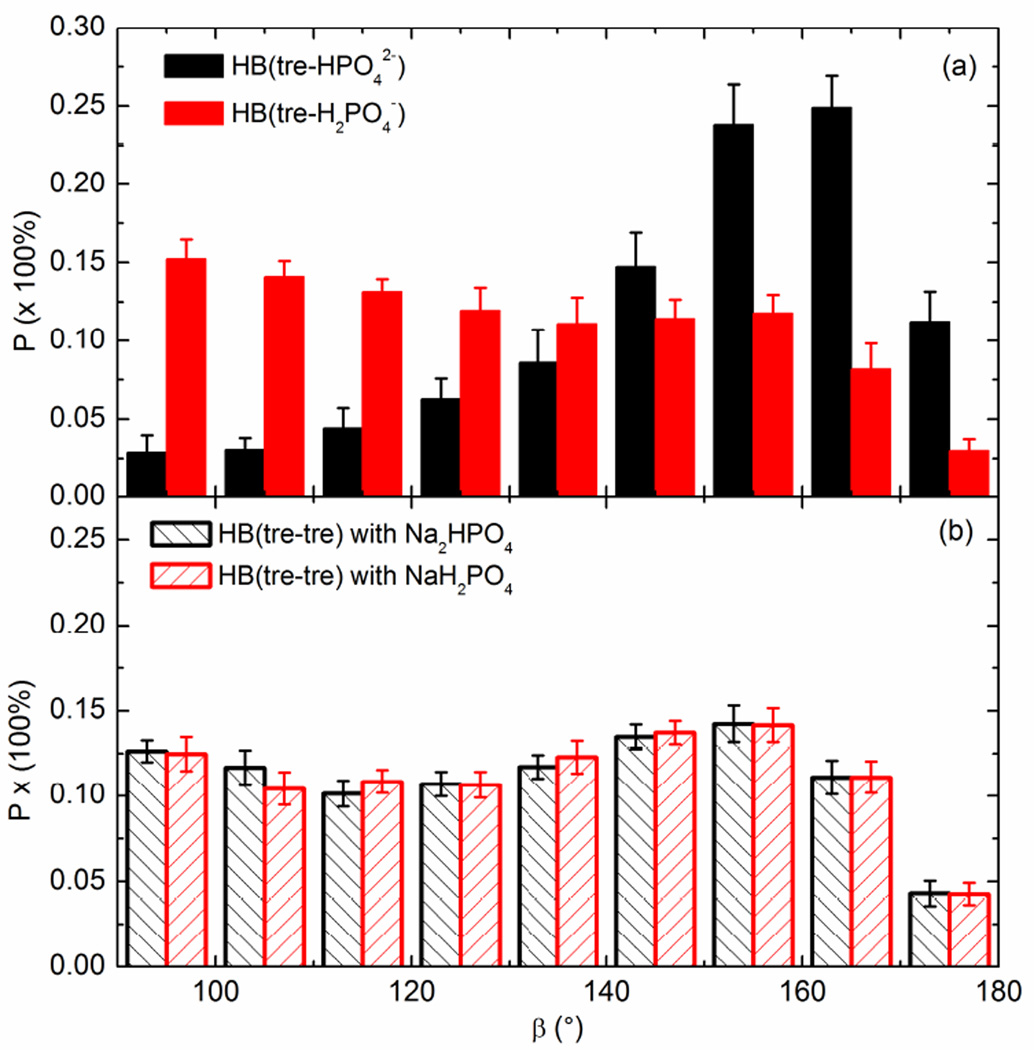
In addition to the hydrogen bond length, it is also well known that the linearity of the hydrogen bond is an indicator of its strength, i.e., the larger the angle D-H⋯A, the stronger the hydrogen bond (30). In general it is known that linear networks of hydrogen bonds can increase the dipole moment of the hydrogen bond and lead to stronger hydrogen bonds, whereas the hydrogen bond energy will be lost upon deviation from linearity, even though a rigorous quantitative relationship is still somewhat elusive (33, 34). Fig. 6 displays the angular preference of the angle D-H⋯A for hydrogen bonds formed between trehalose and phosphate ions and among trehalose molecules. It is clear from Fig. 6(a) that the linear-like angle D-H⋯A (> 140°) for tre-HPO42− (nearly 75%) is statistically favored over bent ones. In contrast, no preferred angle for tre-H2PO4− interactions can be found, but the distribution is skewed towards non-linear bond angles. There appear to be two statistically preferred angles for tre-tre hydrogen bonds: 95° and 155° (t-test, P<0.05 compared to other angles). We suggest that the 95° preference is mainly caused by the proximity of -OH groups that are located near the -OH groups engaged in forming linear tre-tre hydrogen bonds. In any case, the hydrogen bonds formed between trehalose and HPO42− are significantly more linear than others, which implies a higher strength of these hydrogen bonds.
Fig. 6.
The angular preference of the angle D-H⋯A for hydrogen bonds formed (a) between trehalose and phosphate and (b) among trehalose molecules in the mixture (R=0.579) at 530 K
The hydrogen bond lifetime τHB could also be useful to evaluate the strength of the hydrogen bond since the longer time a specific type of hydrogen bond can exist, the more difficult it is to interrupt the hydrogen bond by atomic motions. As shown in Table 4, a systematic variation of τHB with the concentration is not obvious. However, direct comparisons between ion species can be made at given compositions and temperatures. At 310 K, the τHB is averaged to be 6.721 ps for tre-HPO42− hydrogen bonds but it is only 3.925 ps for the tre-H2PO4− ones. It is evident that hydrogen bonds between trehalose and HPO42− ions exist for a longer period of time, which could support our previous evaluation on the relative hydrogen bond strength. Other have found that in aqueous electrolyte solutions, the more basic the anion, the stronger the hydrogen-bonding between water and anions, resulting in a higher Tg of the solution (35). In our case, basic HPO42− anions were found to form stronger hydrogen bonds with trehalose molecules than the acidic H2PO4− ions.
Table 4.
The hydrogen bond lifetime τHB of hydrogen bonds between trehalose and phosphate at 310 and 510 K, respectively. (β=150°)
| R | τHB (ps) at 310 K | τHB (ps) at 510 K | ||
|---|---|---|---|---|
| Tre-HPO42− | Tre-H2PO4− | Tre-HPO442− | Tre-H2PO4− | |
| 0.125 | 5.920 | 3.678 | 1.586 | 1.018 |
| 0.296 | 6.742 | 3.198 | 1.631 | 1.003 |
| 0.579 | 6.819 | 4.225 | 1.573 | 0.966 |
| 1.0 | 6.601 | 4.351 | 1.531 | 1.044 |
In addition, the hydrogen bond lifetime τHB was calculated for each temperature of the cooling/heating simulations (550-250 K). The temperature dependence of τHB was found to follow the Arrhenius relation τHB=τ0exp(EA/(RT)) (36, 37), where R is the gas constant, 0.008314 kJ/mol/K and EA is known as the activation energy, which is the energy needed to break a hydrogen bond by librational (translational) motion (36, 37). For the trehalose/Na2HPO4 mixture (R=0.579), the EA of trehalose-HPO42− hydrogen bonds was determined to be 8.49±0.08 kJ/mol, compared to 6.17±0.36 kJ/mol for trehalose-H2PO4− in the trehalose/NaH2PO4 mixture (R=0.579). The EA of trehalose-trehalose hydrogen bonds in pure trehalose was found to be 7.63±0.05 kJ/mol. As in the case of hydrogen bond lifetime, the activation energy did not show significant variation with the molar ratio. Therefore, the activation energy comparison demonstrates that the descending order of the hydrogen-bonding strength is trehalose-HPO42−, trehalose-trehalose, and trehalose-H2PO4−.
Self-Aggregation Gives Rise to the Ionic Pockets in the Trehalose-Hosting Matrix
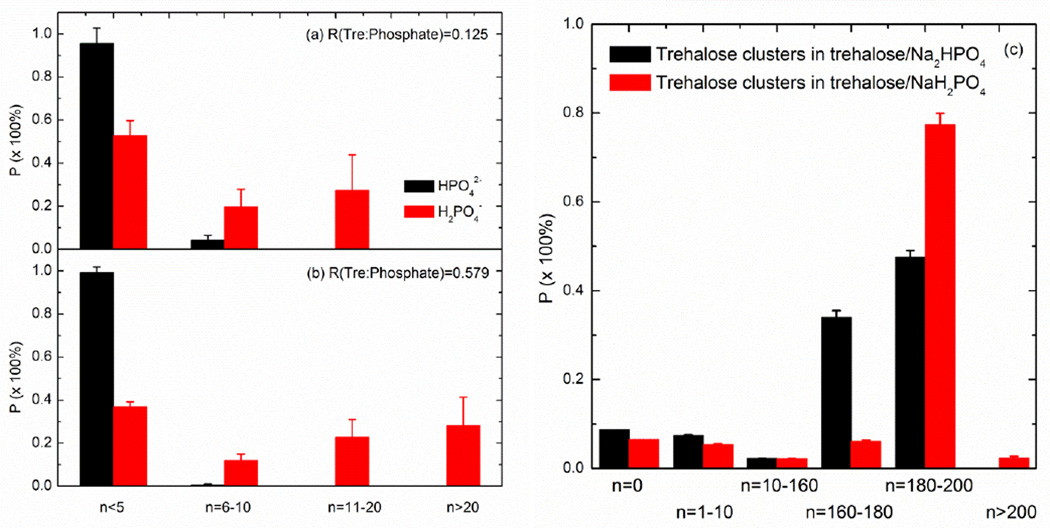
Many mixtures cannot be homogenous on the microscopic scale but consist of clusters (also known as self-aggregates) of component molecules or ions of various sizes. Figs. 7(a) and (b) illustrate the self-aggregation preference of phosphate anions at 530 K with R=0.125 and R=0.579, respectively. The vast majority (95.7% for R=0.125 and 99.4% for R=0.579) of the total HPO42− anions formed a self-aggregate consisting of no more than 5 anions. In contrast, a significant portion of H2PO4− anions can associate with each other in larger self-aggregates with n>10 (27.4% for R=0.125 and 51.1% for R=0.579). This is mainly because the interactions between trehalose molecules and H2PO4− ions are not energetically favored over trehalose-trehalose hydrogen bonds. As a result, H2PO4− ions would prefer to self-aggregate and interact with trehalose molecules only at the H2PO4− cluster/trehalose interface. Even if the linearity of the hydrogen bonds is restrained by using β=150°, the comparison does not change between dihydrogen and hydrogen phosphate (data not shown).
Fig. 7.
The self-aggeregate preference of phosphate ions in the trehalose/phosphate mixtures. (a) R=0.125, (b) R=0.579 and (c) self-aggregate preference of trehalose molecules in the mixture of R=1
Fig. 7(c) presents the self-aggregation preference of trehalose molecules in a R=1 mixture. The bigger clusters formed by dihydrogen phosphate ions may exclude the trehalose molecules, thus forcing them to form bigger clusters compared to the addition of hydrogen phosphate. Note that β=150° was employed simply because 90° did not produce the necessary resolution of : and allowed the predominance of giant (n=~216) self-aggregates of trehalose. With regards to the self-aggregation preference of trehalose molecules when mixed with different numbers of phosphate anions, the addition of phosphate ions decreases the probability of forming relatively large-sized self-aggregates of trehalose (n>200).
Reinforcing the Hydrogen Bond/Ionic Pocket-Controlled Tg Behavior with Sucrose-Related Evidence
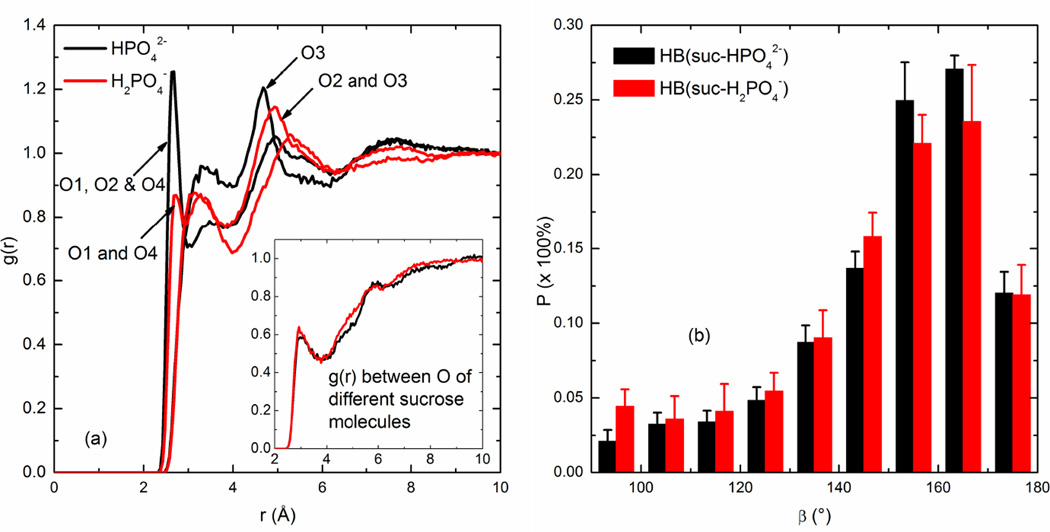
Fig. 8 demonstrates that the g(r) and hydrogen bond linearity analysis for sucrose/phosphate mixtures reinforces our above findings. Firstly, a clear peak for the O pairs between dihydrogen phosphate and sucrose appears at the almost exact same position as the first peak for O pairs between hydrogen phosphate and sucrose. Also both the first peak positions are closer than that for the sucrose-sucrose interactions, as seen in the inset of Fig. 8(a). Secondly, both the hydrogen bonds formed between dihydrogen or hydrogen phosphate and sucrose are similarly linear as demonstrated in Fig. 8(b). Therefore, in the case of either dihydrogen or hydrogen phosphate, the hydrogen-bonding network can be strengthened by their addition and consequently the Tg of the final composition may increase. Moreover, considering the peak height and the slight difference in the top end of the angular distribution, adding hydrogen phosphate may result in a larger increase in the Tg compared with dihydrogen phosphate since the hydrogen bonds formed between hydrogen phosphate and sucrose are observed to be slightly stronger than those between dihydrogen phosphate and sucrose. These findings related to sucrose and phosphate interactions agree well with the experimental results presented in Ohtake et al.’s study (8). They observed that as the pH rose from 3 to 9 (i.e., the solution transitioned from HPO42−-dominant to H2PO4−-dominant), the Tg of sucrose/sodium phosphate mixtures was found to increase from slightly below 70 °C to above 100 °C for R=1 and the Tg of the mixtures was always higher than sucrose alone at any ratio and pH value (8).
Fig. 8.
(a) The radial distribution function of oxygen pairs between sucrose and phosphate and (b) the angular preference for their hydrogen bonds in the mixture of R=0.579 at 480 K
It was also observed from these simulations that the clustering phenomena in sucrose/phosphate mixtures were not significantly different between phosphate ions. The average probability of hydrogen phosphate ions to form clusters with a size of no more than 5 was 99.1%, close to the value of 93.4% for dihydrogen phosphate. Only 6.4% of the dihydrogen phosphate ions can form self-aggregates with n between 6 and 10. On the whole, both hydrogen phosphate and dihydrogen phosphate contributed to a similar network with its sucrose hosting matrix.
CONCLUSIONS
In this study, DSC and DMA measurements demonstrated that the addition of NaH2PO4 systematically decreases both the glass transition temperature and the α-relaxation temperature of the trehalose/NaH2PO4 mixture. On the other hand, both the Tg and Tα are increased by adding Na2HPO4 into pure trehalose. Molecular dynamics simulations were conducted to clarify the mechanisms contributing to the distinctively different glass transition behaviors involving dihydrogen phosphate and hydrogen phosphate. Trehalose molecules and HPO42− anions formed stronger hydrogen bonds in terms of closer distances between O atoms and preferred linearity while a weaker hydrogen-bonding network was formed between trehalose and H2PO4− anions. The geometrical difference is found to be consistent with the hydrogen bond lifetime comparison. Moreover, HPO42− ions preferred to form self-aggregates involving no more than five ions. In contrast a large portion of H2PO4− anions preferred to self-aggregate by involving more than 10 anions in the clusters.
These results suggest that upon addition of HPO42− to trehalose, the hydrogen-bonding network in the whole complex, which is scattered by small-sized self-aggregates of HPO42−, can be improved by strong molecule-anion hydrogen bonds. However, when adding H2PO4−, the hydrogen-bonding network is impaired by weak molecule-anion hydrogen bonds and the complex is pocketed by large-sized ionic clusters. By comparison, the addition of H2PO4− to sucrose can act in a similar manner as adding HPO42− to sucrose, contributing to a higher Tg compared to sucrose alone, due to a weaker network in the pure phase. In conclusion, ions that can slightly self-aggregate, minimize micro-heterogeneity in the mixture, and replace the original hydrogen bonds among the hosting molecules such as trehalose with stronger interactions, will act as a glass strengthener, resulting in a higher Tg. Those ions that highly self-aggregate with each other, deteriorating the micro-homogeneity, and impairing the original hydrogen bonds between the hosting molecules can only decrease the Tg, and thus act as plasticizers. These mechanisms provide insights into the future design and preparation of pharmaceutical compositions with desirable glassy state properties.
ACKNOWLEDGEMENTS
This study was supported by grant #5RO1GM101796 from the National Institutes of Health. DMA and DSC measurements were performed at the Materials Characterization Laboratory (MCL), a user research facility supported in part by the Energy Production and Infrastructure Center (EPIC) at the University of North Carolina at Charlotte.
REFERENCES
- 1.Franks F. Scientific and technological aspects of aqueous glasses. Biophys Chem. 2003;105:251–261. doi: 10.1016/s0301-4622(03)00074-7. [DOI] [PubMed] [Google Scholar]
- 2.Levine H. Amorphous food and pharmaceutical systems. Cambridge: Royal Society of Chemistry; 2002. [Google Scholar]
- 3.Elmonsef Omarand A, Roos YH. Glass transition and crystallization behaviour of freeze-dried lactose–salt mixtures. LWT-Food Sci Technol. 2007;40:536–543. [Google Scholar]
- 4.Reis J, Sitaula R, Bhowmick S. Water activity and glass transition temperatures of disaccharide based buffers for desiccation preservation of biologics. J Biomed Sci Eng. 2009;2:594–605. [Google Scholar]
- 5.Weng L, Vijayaraghavan R, MacFarlane DR, Elliott GD. Application of the Kwei equation to model the Tg behavior of binary blends of sugars and salts. Cryobiology. 2013;68:155–158. doi: 10.1016/j.cryobiol.2013.12.005. [DOI] [PMC free article] [PubMed] [Google Scholar]
- 6.Fujita K, Forsyth M, MacFarlane DR, Reid RW, Elliott GD. Unexpected improvement in stability and utility of cytochrome c by solution in biocompatible ionic liquids. Biotechnol Bioeng. 2006;94:1209–1213. doi: 10.1002/bit.20928. [DOI] [PubMed] [Google Scholar]
- 7.Weaver KD, Kim HJ, Sun J, MacFarlane DR, Elliott GD. Cyto-toxicity and biocompatibility of a family of choline phosphate ionic liquids designed for pharmaceutical applications. Green Chem. 2010;12:507–513. [Google Scholar]
- 8.Ohtake S, Schebor C, Palecek SP, de Pablo JJ. Effect of pH, counter ion, and phosphate concentration on the glass transition temperature of freeze-dried sugar-phosphate mixtures. Pharm Res. 2004;21:1615–1621. doi: 10.1023/b:pham.0000041456.19377.87. [DOI] [PubMed] [Google Scholar]
- 9.Miller DP, Anderson RE, de Pablo JJ. Stabilization of lactate dehydrogenase following freeze-thawing and vacuum-drying in the presence of trehalose and borate. Pharm Res. 1998;15:1215–1221. doi: 10.1023/a:1011987707515. [DOI] [PubMed] [Google Scholar]
- 10.Van der Sman RG. Predictions of Glass Transition Temperature for Hydrogen Bonding Biomaterials. J Phys Chem B. 2013;117:16303–16313. doi: 10.1021/jp408184u. [DOI] [PubMed] [Google Scholar]
- 11.Van der Smanand R, Meinders M. Moisture diffusivity in food materials. Food Chem. 2013;138:1265–1274. doi: 10.1016/j.foodchem.2012.10.062. [DOI] [PubMed] [Google Scholar]
- 12.Nakanishiand M, Nozaki R. Model of the cooperative rearranging region for polyhydric alcohols. Phys Rev E. 2011;84:011503. doi: 10.1103/PhysRevE.84.011503. [DOI] [PubMed] [Google Scholar]
- 13.Nakanishiand M, Nozaki R. Systematic study of the glass transition in polyhydric alcohols. Phys Rev E. 2011;83:051503. doi: 10.1103/PhysRevE.83.051503. [DOI] [PubMed] [Google Scholar]
- 14.Angell C, Sare J, Sare E. Glass transition temperatures for simple molecular liquids and their binary solutions. J Phys Chem. 1978;82:2622–2629. [Google Scholar]
- 15.Taylorand LS, Zografi G. Sugar–polymer hydrogen bond interactions in lyophilized amorphous mixtures. J Pharm Sci. 1998;87:1615–1621. doi: 10.1021/js9800174. [DOI] [PubMed] [Google Scholar]
- 16.Harrisonand RM, De Mora SJ. Introductory chemistry for the environmental sciences. Cambridge University Press; 1996. [Google Scholar]
- 17.Sussichand F, Cesàro A. Trehalose amorphization and recrystallization. Carbohydr Res. 2008;343:2667–2674. doi: 10.1016/j.carres.2008.08.008. [DOI] [PubMed] [Google Scholar]
- 18.Seo JA, Oh J, Kim HK, Hwang YH, Yang YS, Kim SJ. Study of Glass Transition Temperatures in Sugar Mixtures. J Korean Phys Soc. 2005;46:606–609. [Google Scholar]
- 19.Phillips JC, Braun R, Wang W, Gumbart J, Tajkhorshid E, Villa E, Chipot C, Skeel RD, Kale L, Schulten K. Scalable molecular dynamics with NAMD. J Comput Chem. 2005;26:1781–1802. doi: 10.1002/jcc.20289. [DOI] [PMC free article] [PubMed] [Google Scholar]
- 20.Guvench O, Hatcher E, Venable RM, Pastor RW, MacKerell AD., Jr CHARMM additive all-atom force field for glycosidic linkages between hexopyranoses. J Chem Theory Comput. 2009;5:2353–2370. doi: 10.1021/ct900242e. [DOI] [PMC free article] [PubMed] [Google Scholar]
- 21.Neria E, Fischer S, Karplus M. Simulation of activation free energies in molecular systems. J Chem Phys. 1996;105:1902. [Google Scholar]
- 22.Yesselman JD, Price DJ, Knight JL, Brooks CL. MATCH: An atom-typing toolset for molecular mechanics force fields. J Comput Chem. 2012;33:189–202. doi: 10.1002/jcc.21963. [DOI] [PMC free article] [PubMed] [Google Scholar]
- 23.Caffarenaand ER, Grigera JR. Hydration of glucose in the rubbery and glassy states studied by molecular dynamics simulation. Carbohydr Res. 1999;315:63–69. [Google Scholar]
- 24.Yoshioka S, Aso Y, Kojima S. Prediction of glass transition temperature of freeze-dried formulations by molecular dynamics simulation. Pharm Res. 2003;20:873–878. doi: 10.1023/a:1023831102203. [DOI] [PubMed] [Google Scholar]
- 25.Giovambattista N, Angell CA, Sciortino F, Stanley HE. Glass-transition temperature of water: A simulation study. Phys Rev Lett. 2004;93:047801. doi: 10.1103/PhysRevLett.93.047801. [DOI] [PubMed] [Google Scholar]
- 26.Wengand L, Elliott GD. Dynamic and thermodynamic characteristics associated with the glass transition of amorphous trehalose-water mixtures. Phys Chem Chem Phys. 2014;16:11555–11565. doi: 10.1039/c3cp55418j. [DOI] [PMC free article] [PubMed] [Google Scholar]
- 27.Weng L, Chen C, Zuo J, Li W. Molecular dynamics study of effects of temperature and concentration on hydrogen-bond abilities of ethylene glycol and glycerol: implications for cryopreservation. J Phys Chem A. 2011;115:4729–4737. doi: 10.1021/jp111162w. [DOI] [PubMed] [Google Scholar]
- 28.Skarmoutsos I, Guardia E, Samios J. Hydrogen bond, electron donor-acceptor dimer, and residence dynamics in supercritical CO-ethanol mixtures and the effect of hydrogen bonding on single reorientational and translational dynamics: A molecular dynamics simulation study. J Chem Phys. 2010;133:014504. doi: 10.1063/1.3449142. [DOI] [PubMed] [Google Scholar]
- 29.Wolkers WF, Oldenhof H, Alberda M, Hoekstra FA. A Fourier transform infrared microspectroscopy study of sugar glasses: application to anhydrobiotic higher plant cells. Biochim Biophys Acta, Gen Subj. 1998;1379:83–96. doi: 10.1016/s0304-4165(97)00085-8. [DOI] [PubMed] [Google Scholar]
- 30.Steiner T. The hydrogen bond in the solid state. Angew Chem, Int Ed. 2002;41:48–76. doi: 10.1002/1521-3773(20020104)41:1<48::aid-anie48>3.0.co;2-u. [DOI] [PubMed] [Google Scholar]
- 31.Crowe LM. Lessons from nature: the role of sugars in anhydrobiosis. Comp Biochem Physiol Part A Mol Integr Physiol. 2002;131:505–513. doi: 10.1016/s1095-6433(01)00503-7. [DOI] [PubMed] [Google Scholar]
- 32.Espinosa E, Molins E, Lecomte C. Hydrogen bond strengths revealed by topological analyses of experimentally observed electron densities. Chem Phys Lett. 1998;285:170–173. [Google Scholar]
- 33.Lodish H, Berk A, Zipursky S. Molecular Cell Biology. 2000 [Google Scholar]
- 34.Hasegawaand M, Noda H. Distribution of hydrogen bond angles in molecular crystals. Nature. 1975;254:212. [Google Scholar]
- 35.Angell C. Liquid fragility and the glass transition in water and aqueous solutions. Chem Rev. 2002;102:2627–2650. doi: 10.1021/cr000689q. [DOI] [PubMed] [Google Scholar]
- 36.Harvey JA, Basak D, Venkataraman D, Auerbach SM. Simulating hydrogen-bond clustering and phase behaviour of imidazole oligomers. Mol Phys. 2012;110:957–966. [Google Scholar]
- 37.Han S, Kumar P, Stanley HE. Hydrogen-bond dynamics of water in a quasi-two-dimensional hydrophobic nanopore slit. Phys Rev E. 2009;79:041202. doi: 10.1103/PhysRevE.79.041202. [DOI] [PubMed] [Google Scholar]


