

Summary
mtDNA mutagenesis in somatic stem cells leads to their dysfunction and to progeria in mouse. The mechanism was proposed to involve modification of reactive oxygen species (ROS)/redox signaling. We studied the effect of mtDNA mutagenesis on reprogramming and stemness of pluripotent stem cells (PSCs) and show that PSCs select against specific mtDNA mutations, mimicking germline and promoting mtDNA integrity despite their glycolytic metabolism. Furthermore, mtDNA mutagenesis is associated with an increase in mitochondrial H2O2, reduced PSC reprogramming efficiency, and self-renewal. Mitochondria-targeted ubiquinone, MitoQ, and N-acetyl-L-cysteine efficiently rescued these defects, indicating that both reprogramming efficiency and stemness are modified by mitochondrial ROS. The redox sensitivity, however, rendered PSCs and especially neural stem cells sensitive to MitoQ toxicity. Our results imply that stem cell compartment warrants special attention when the safety of new antioxidants is assessed and point to an essential role for mitochondrial redox signaling in maintaining normal stem cell function.
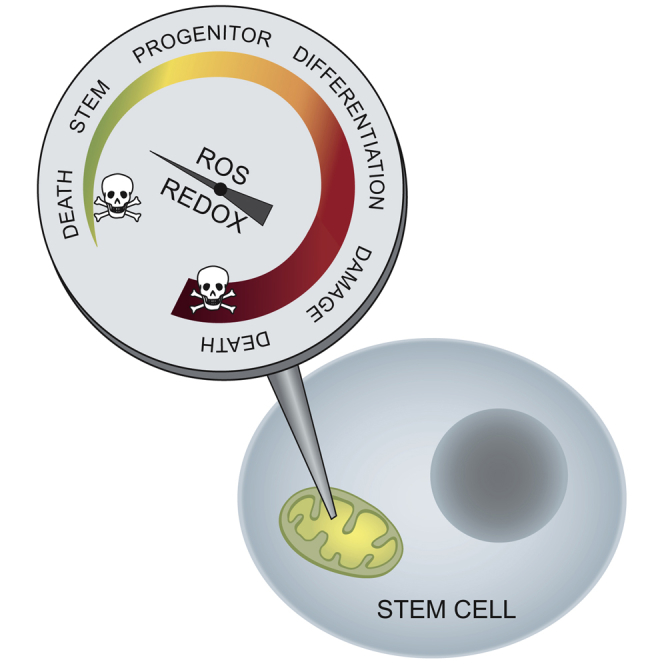
Graphical Abstract
Highlights
-
•
mtDNA mutagenesis affects reprogramming and stemness through redox signaling
-
•
Altered redox signaling can be pharmacologically rescued by NAC or MitoQ
-
•
Stem cells are sensitive to mitochondria-targeted ubiquinone toxicity
-
•
Pluripotent stem cells show active selection against mtDNA mutations
Hämäläinen et al. show that stem cell homeostasis and reprogramming efficiency are sensitive to mitochondrial mutagenesis and mitochondria-derived oxygen radicals, which decrease stemness. The stem cell sensitivity to redox signaling also makes them sensitive targets for antioxidants, which, if targeted to mitochondria, show dose-dependent benefits or toxicity.
Introduction
Genomic integrity is crucial for stem cells, to enable tissue maintenance. Mutations affecting nuclear genomic DNA repair lead to somatic stem cell (SSC) dysfunction and premature aging: mouse models with genomic DNA repair defects show progeroid phenotypes (Barlow et al., 1996; de Boer et al., 2002; Gu et al., 1997). mtDNA integrity is also required for proper stem cell function: “mtDNA mutator” mice, which accumulate random mtDNA mutations in all tissues, including SSCs, develop progeria, with gray hair, alopecia, osteoporosis, general wasting, anemia, reduced fertility, and shortened lifespan (Ameur et al., 2011; Kujoth et al., 2005; Trifunovic et al., 2004). These mice have a progressive dysfunction of hematopoietic, neural, and intestinal progenitor cells, starting early during embryogenesis (Ahlqvist et al., 2012; Chen et al., 2009; Fox et al., 2012; Norddahl et al., 2011); however, the first progeric symptom of these mice, anemia, manifests only after 6 months of age. The embryonal SSC defect can be rescued by treatment with N-acetyl-L-cysteine (NAC) (Ahlqvist et al., 2012), suggesting a redox component in the pathology. These data show that hematopoietic and neural progenitors are sensitive to mtDNA mutagenesis and dysfunction, but the mechanisms remain unclear.
Somatic stem/progenitor cell metabolism mostly relies on glycolytic activity, and mitochondrial respiration typically gradually increases upon differentiation (Suda et al., 2011). However, mitochondria are present and active in stem cells even though their contribution to the cellular ATP demand is minor (Zhang et al., 2011). This downregulation of mitochondrial ATP production may leave the mitochondria under conditions of high proton-motive force and a reduced respiratory chain (RC), which favors mitochondrial reactive oxygen species (ROS) production (Chouchani et al., 2014; Murphy, 2009). ROS are potent signaling molecules; for example, they are known to drive HPCs to proliferate and to contribute to erythroid differentiation (Suda et al., 2011). The consequences of primary mitochondrial dysfunction for SSC and progenitor compartments are, however, poorly understood. In mtDNA mutator mice, random amino acid changes accumulate in RC complexes, including complexes CI and CIII—the major producers of mitochondrial ROS. Changes in ROS levels have been found in some tissues in aged mutators (Logan et al., 2014), but little signs of oxidative damage were apparent (Kolesar et al., 2014; Trifunovic et al., 2005), indirectly suggesting that modified ROS signaling, not oxidative stress, mediate SSC dysfunction and progeria in mutator mice.
We report here that mtDNA mutagenesis increases mitochondrial H2O2 in pluripotent stem cells (PSCs) in vitro, resulting in modification of reprogramming, pluripotency, and stem cell homeostasis. We show that both induced PSCs (iPSCs) and SSCs are especially sensitive to ROS and also to antioxidants NAC and mitochondria-targeted ubiquinone (MitoQ), which both improved stem cell function. However, MitoQ also showed dose-dependent toxicity specific for neural stem cells (NSCs) and iPSCs. These data indicate that long-term treatment trials in animal models, with special focus on the stem cell compartment, are warranted when assessing safety of new antioxidants.
Results
Antioxidants NAC and MitoQ Rescue Reprogramming Defect Associated with mtDNA Mutagenesis
Mouse embryonic fibroblast (MEF) cultures were established from E13.5–14.5 mutator and WT embryos, subsets of which were supplemented with NAC or MitoQ during the whole embryogenesis and post-harvest in vitro culture. The different genotypes showed no difference in proliferation, clonality, viability, or transfection efficiency, and the antioxidant treatments had no effect on these (Figure S1). However, when reprogramming the MEFs to pluripotency, ∼10-fold more colonies arose from the WTs than from mutator MEFs (Figure 1A). The decreased reprogramming efficiency of mutators was significantly improved by the two antioxidants with different mechanisms of action: NAC increases cellular glutathione and consequently redox-buffer capacity of the cell, whereas MitoQ, a modified ubiquinone, is targeted to accumulate within mitochondria (Kelso et al., 2001). NAC increased the number of mutator colonies 4-fold, and the effect of MitoQ was 10-fold, the latter rescuing the efficiency to WT level. Neither of the antioxidants had a significant effect on the reprogramming of WT MEFs (Figure 1A). Culture and reprogramming in 4% oxygen improved reprogramming efficiency similarly for both genotypes (Figure 1B).
Figure 1.

Mitochondrial ROS Reduce Reprogramming Efficiency and Stemness of iPSCs, Ameliorated by Antioxidants NAC and MitoQ
(A) Reprogramming efficiency. Numbers indicate the amount of alkaline phosphatase (AP)-positive colonies on day 14 after induction. WT versus Mut: p < 0.0001; Mut NAC (0.1 mM): p < 0.0001; Mut MitoQ (100 nM): p < 0.0001.
(B) Reprogramming in low oxygen (4%). Fold increase: WT: 2.9 ± 0.23; Mut: 3.0 ± 0.39.
(C) Intra-mitochondrial production of H2O2. The iPSCs were fed MitoB, which reacts with H2O2 and forms MitoP. Mass spectrometric analysis of MitoP and MitoB, expressed as ratio of MitoP/MitoB, represents mitochondrial H2O2 levels; p = 0.0265.
(D) Clonality of mutator and WT iPSCs. Figure shows AP-stained plates 7 days after clonal plating. The scale bars represent 10 mm.
(E) Quantification of the colonies from (D). ∗∗∗p < 0.0001.
(F) SSEA-1 expression analyzed by FACS. FACS plots of untreated cells (left) and MitoQ-treated WT cells (10 nM, right) are shown. Yellow shading indicates SSEA1-negative population.
(G) Quantification of the SSEA1-negative cells from the FACS plots. WT versus Mut: p = 0.0029; WT 100 nM MitoQ: p < 0.0001.
(H) Apoptosis (annexin V staining and FACS analysis) in iPSCs with and without antioxidant treatment.
Data represent one (B and C), two (A, E, G, and H), or four (A and E untreated cells) independent experiments and are represented as mean ± SEM. See also Figure S1 for characterization of MEFs and iPSCs.
To directly assess whether mtDNA mutagenesis affected mitochondrial ROS production in iPSCs, we utilized a mitochondria-targeted probe MitoB: arylboronic acid conjugated to triphenylphosphonium ion (TPP) (Cochemé et al., 2012). The lipophilic TPP mediates rapid uptake of MitoB into cells and accumulation in mitochondria, where MitoB reacts with H2O2 and forms a phenol-derivative MitoP. MitoP/MitoB ratio can be measured by ratiometric mass spectrometry and reflects the mitochondrial H2O2 level (Cochemé et al., 2012). Mutator iPSCs showed an increase in the MitoP/MitoB ratio, consistent with an increase in mitochondrial H2O2 (Figure 1C).
Neither mtDNA mutagenesis nor antioxidant treatment affected expression of the pluripotency markers in the established iPSC lines (Figures S1F and S1G). The tet-inducible-promoter-driven reprogramming transgenes were silenced in all the clones analyzed (Figure S1H), and early passage iPSC clones exhibited normal karyotypes (Figure S1I). Upon suspension culture and withdrawal of LIF (leukemia inhibitory factor), all tested clones produced embryoid bodies (WT: n = 6; Mut: n = 6), and when injected into nude mice, all tested clones (WT: n = 3; Mut: n = 6) generated teratomas with cell types from all three germ layers present in them (Figure S1J). These results imply that mtDNA mutagenesis increases mitochondrial H2O2 and that mitochondrial ROS inhibit nuclear reprogramming, which can be rescued by antioxidants.
Mitochondrial Antioxidant MitoQ: Low Concentrations Improve whereas Moderate Concentrations Impair Self-Renewal of PSCs
Clonal capacity, i.e., ability of a single stem cell to generate a new stem cell clone, is considered a measure of stemness. The clonality of mutator iPSCs was decreased to one-fourth of WTs. This self-renewal defect was partially rescued by NAC (100 μM) and low concentration of MitoQ (10 nM). NAC treatment had no significant effect on WT cells (Figures 1D and 1E). However, 100 nM MitoQ—the concentration successfully used during MEF reprogramming—instead of improving mutators, had a detrimental effect on WT clonality (Figures 1D and 1E), whereas NAC even in 10-fold concentration (1 mM) improved self-renewal of mutator iPSCs and showed no adverse effects on WTs (Figures 1D and 1E). These results indicate that MitoQ has a narrow therapeutic window and can be harmful to stem cells at higher concentrations.
The self-renewal ability was reflected in the embryonic stem cell marker SSEA1 (stage-specific embryonic antigen-1) expression: a significantly larger population of SSEA1-negative cells existed in mutator iPSCs. MitoQ treatment dose dependently increased the proportion of SSEA1-negative cells, as a possible sign of impaired stemness of the iPSC (Figures 1F and 1G). This was not associated with increased cell death (Figure 1H).
Our results show that mtDNA mutagenesis reduces iPSC clonal ability, a measure of stemness. NAC rescues this defect without apparent toxicity. Mitochondria-targeted MitoQ also effectively rescues the defect at low concentrations but is deleterious for iPSC self-renewal with concentrations that improved fibroblast reprogramming.
Mutator iPSCs Show a ROS-Independent Growth Defect
Mutator MEFs showed no difference to WT growth (Figures S1A and S1B), but the mutator iPSCs manifested a severe growth defect, with doubling times around 24 hr for mutators and 16 hr for WT cells (Figures 2A and 2B). Also, mutator embryoid bodies (EBs) grew slowly (Figure 2C). The proportion of proliferating cells was similar between mutator and WT cultures when analyzed by BrdU incorporation and FACS (Figure 2D), and apoptosis was not increased (annexin V and propidium iodide staining; FACS analysis; Figure 2E). NAC or MitoQ had no effect on the slow growth. These results indicate that mtDNA mutagenesis delays stem cell growth by a redox-independent manner without inducing cell death.
Figure 2.

Severe Non-redox-Linked Growth Defect but No Increase in Apoptosis in Mutator iPSCs
(A) Growth of mutator and WT iPSCs. Appearance of clones in phase-contrast microscopy is shown on the left. The scale bars represent 200 μm. Number of cells is shown on the right.
(B) Doubling time of mutator and WT iPSCs with and without antioxidant treatments. WT versus Mut: p < 0.0001.
(C) Growth of embryoid bodies during early stages of differentiation. The scale bars represent 200 μm.
(D) Proliferating cells (BrdU incorporation; FACS analysis).
(E) Apoptosis assay (annexin V and PI staining and FACS analysis).
Data represent one (C), two (D and E), or three (B) independent experiments and are represented as mean ± SEM.
Differential Response of Somatic Progenitor Cells to Antioxidants
The adverse effect of MitoQ on iPSCs at a relatively low concentration range prompted us to investigate the effect of MitoQ in vivo to somatic progenitor cells. We extracted NSCs from the brain and hematopoietic progenitors (HPCs) from the liver of E14.5–15.5 embryos treated either with MitoQ (0.75 mg/ml) or as control an equivalent dose of lipophilic decyl-TPP (dTPP) without ubiquinone (0.48 mg/ml). These cell types previously showed either an abnormal differentiation pattern (HPCs) or a self-renewal defect (NSCs) in mutators, which was rescued by NAC (Ahlqvist et al., 2012). MitoQ, but not dTPP, rescued the abnormal proportions of embryonal HPCs in mutator embryos, replicating our previous results with NAC (Figures 3A and 3B). However, neurospheres extracted from the same MitoQ-treated embryos showed abnormal morphology (Figure 3C) and an increase in apoptosis (Figure 3D). These were not found in dTPP-treated embryos. Consequently, we were not able to establish stable neurosphere cultures from the MitoQ-treated embryos. Concentration-dependent toxicity was also evident when previously untreated neurosphere cultures were subjected to MitoQ in vitro: 10 nM MitoQ maintained normal self-renewal and viability, whereas already 50 nM MitoQ induced apoptosis (Figures 3C and 3D) and reduced the proportion of self-renewing cells (Figure 3E). NAC treatment was not toxic to NSCs even at a high concentration (Figures 3C–3E). Neuronal cells differentiated from NCSs (mixed cultures of Tuj-1+ neurons and GFAP+ astrocytes with increasing mtDNA copy number indicating mitochondrial maturation; Figure S2) tolerated higher concentrations of MitoQ (Figure 3F). However, MitoQ was still toxic to immature neuronal cultures at 250 nM—a concentration that did not induce cell death in MEFs or iPSCs (Figures 3F, 3G, and 1H). MEFs tolerated antioxidants extremely well, as neither 1 μM MitoQ nor 2 mM NAC induced apoptosis in MEFs (Figure 3G). These results show that antioxidants have cell-type-specific effects and suggest that mitochondria-targeted MitoQ can be toxic to specific cell types with NSCs being especially vulnerable.
Figure 3.

Contrary Effects of MitoQ in Somatic Stem Cells In Vivo and In Vitro
(A) Beneficial effect of MitoQ in HSCs extracted from E13.5 embryos in vivo. The bars represent the amount of basophilic erythroblasts (CD71+Ter119+) in fetal liver. WT versus Mut: p = 0.0034; Mut MitoQ: p = 0.0025.
(B) The amount of the more-mature orthochromatophilic erythroblasts (Ter119+ CD71low). WT versus Mut: p = 0.0010; Mut MitoQ: p = 0.0085.
(C) Neurospheres extracted from the same embryos. The mothers were drinking either water or water spiked with 1 mg/ml NAC, 0.75 mg/ml MitoQ, or 0.48 mg/ml dTPP throughout the pregnancies, and the initial cultures were either supplemented with 100 μM NAC, 50 nM MitoQ, or left untreated. Untreated NSC cultures were later subjected to MitoQ. The scale bars represent 50 μm.
(D) Apoptosis (annexin V staining and FACS analysis) in the NSC cultures with and without antioxidant treatment. In vivo MitoQ treatment: p < 0.0001; in vitro 10 nM versus 50 nM MitoQ: p < 0.0001.
(E) Self-renewing cells in untreated and antioxidant-treated NSC cultures. 10 nM versus 50 nM MitoQ: p = 0.0067.
(F) Apoptosis in differentiated neurons. 50 nM versus 250 nM MitoQ: p = 0.05.
(G) Apoptosis in MEFs.
Data represent one (A and B) or two (D–G) independent experiments and are represented as mean ± SEM. See also Figure S2 for characterization of the differentiated neuronal cultures.
Mutator iPSCs Show a Combined RC Defect and Are Highly Glycolytic
In western blot analysis, mutator iPSCs showed a severe decrease of complex IV (cytochrome c oxidase [COX]) protein amount (Figure 4A), and complexes I and III (CI and CIII) were moderately decreased, indicating a combined RC defect (Figures 4A and 4B). The antioxidant treatments increased these protein amounts about 2-fold, rescuing the amounts of CI (NAC-treated) and CIII (MitoQ-treated) and inducing COX to ∼20% of WT mean (Figure 4B). A histochemical COX activity assay indicated low activity in mutators compared to WT cells (Figure 4C). These results showed that antioxidants can improve RC protein amounts in stem cells with mtDNA mutations, implying active ROS regulation of RC protein levels.
Figure 4.

Mutator iPSCs Manifest a Severe Combined Respiratory Chain Deficiency and Are Extremely Glycolytic
(A) Analysis of respiratory chain complexes by western blot.
(B) Quantification of western analysis. Complex I (NDUFA9): p = 0.0113; complex II (70 kD), complex III (UQCRC2): p < 0.0001; complex IV (COX1): p < 0.0001; complexV (ATP5A). In the treated cells, CI (NAC; p = 0.000648), CIII (MitoQ; p = 0.00381), and CIV (NAC/MitoQ; p < 0.0001) levels were increased. The protein amounts were normalized against TOM20, a mitochondrial outer membrane protein.
(C) Cytochrome c oxidase (COX) activity staining (brown). The scale bars represent 200 μm.
(D) Oxygen consumption rate (OCR) in Mito stress test. Basal and maximal respiration and ATP production: p < 0.0001.
(E) Extracellular acidification rate (ECAR) of the culture media representing glycolytic activity. Without glucose: p = 0.0457; with glucose: p = 0.000552; glycolytic reserve: p < 0.0001.
(F) Cell respiration (OCR) against glycolysis (ECAR) WT versus Mut and mutator treatments: p < 0.0001.
(G) OCR in the antioxidant-treated mutator cells. Basal respiration and ATP production in NAC: p < 0.0001; maximal respiration and spare capacity in MitoQ: p < 0.0001.
Data represent two (treated) or three (untreated) independent experiments and are represented as mean ± SEM. See also Figure S3 for glucose dependence and fibroblast data.
We further analyzed the cellular metabolism, both cell respiration and glycolysis, by Seahorse XFe analyzer. Mutator iPSCs showed low cellular respiration (Figure 4D), and when kept in ample glucose, they used their maximal glycolytic capacity (Figure 4E), whereas WT cells utilized both respiration and glycolysis (Figures 4D and 4E). When cell respiration (oxygen consumption rate [OCR]) was calculated against glycolytic activity (extracellular acidification rate [ECAR]), mutators showed a strong shift toward glycolytic metabolism (Figure 4F). Both antioxidant treatments increased respiration in mutator iPSCs and normalized the OCR/ECAR ratio (Figures 4F and 4G) but had no significant effect on WT cells. In mutator MEFs, glycolytic activity was also slightly increased, although basal respiration remained at WT level (Figures S3A–S3C). The strong dependence of the mutator cells on glycolytic metabolism was further supported by their complete dependence on glucose: a clear reduction in growth was evident in mutators when reducing glucose concentration to one-third of the original (4.5 g/l), and complete withdrawal of glucose almost completely arrested their growth (Figure S3D). WT cells showed a growth defect only upon complete withdrawal of glucose (Figure S3D). Mutator growth was also inhibited by non-fermentable carbon source, galactose, which well supported WT cell growth (Figure S3D). Both WT and mutator cells responded to glucose addition by decreasing respiration and increasing glycolytic activity, but mutators induced anaerobic glycolysis more than WT cells (Figures S3E and S3F).
These data show that the combined RC defect in mutator iPSCs is partially ROS dependent and rescued by antioxidants. The metabolism of mutator iPSCs strongly favors glycolysis, whereas the antioxidant treatments switch it to the more-typical iPSC mode, using both respiration and glycolysis. These data point to a role for ROS in stem cell metabolic shift, requiring a delicate balance of oxidative phosphorylation and anaerobic glycolytic activity.
iPSCs Show Selection against mtDNA Mutations
To clarify whether mtDNA mutation loads and profiles could contribute to the observed iPSC findings, we used next-generation sequencing and sequenced the whole mitochondrial genome of the parental MEFs and iPSCs of early and late passages. We further differentiated the iPSCs to fibroblast-like cells (secondary fibroblasts) and analyzed their mutation frequencies. Three to six clones were sequenced per group, and the average coverage per group was 11,250 (Table S1; NCBI SRA database; project SRP056999). Both mutator and WT mtDNA showed similar sequencing coverage throughout mtDNA (Figure 5A), indicating absence of large-scale mtDNA deletions in mutator cells.
Figure 5.

Mutator Cells Show Increased mtDNA Point Mutations, which Are Selected against during iPSC Culture
(A) Sequence coverage for the mtDNA samples across the mtDNA molecule.
(B) Number of variable sites (variation frequency per position >1%). WT versus Mut; fibroblasts (Fb): p = 0.0615; iPSC early: p = 0.0022; iPSC late: p = 0.0013; iPSC-derived fibroblasts (2′Fb): 0.0026. Reprogramming (Fb versus iPSC early); Mut: p = 0.0021. iPSC culture (early versus late); WT: 0.038. Differentiation (late versus 2′Fb; paired t test of three clones): p = 0.0020.
(C) Distribution of variation in iPSCs between different regions in mtDNA (percentage of positions showing variation >1%). WT RC protein-coding genes: p = 0.035.
Data represent one independent experiment and are represented as mean ± SEM. See also Table S1 for coverage data.
Mutation frequencies were calculated per every nucleotide position, and positions showing variation in >1% of all mtDNA copies were considered variable (Figure 5B). Mutators showed an increase in variable mtDNA sites in all cell types, and this became increasingly pronounced the longer the cells were kept in culture (Figure 2B), consistent with constant mutagenesis. The mutation loads in the fibroblasts were partially due to maternal inheritance from the heterozygote females, similar between mutator and WT cells, because littermates were used as WT controls. To minimize maternal contribution, we maintain mutators through male mice and use only one generation of young heterozygous females to produce the study groups.
mtDNA mutation load increased during reprogramming in both mutators and WTs, whereas, during iPSC culture, variable sites decreased in WT and also in mutator cells (Figure 5B), despite continuous mutagenesis. Upon differentiation of iPSCs to secondary fibroblasts, variable sites in mutators increased again, evident already after 2 weeks of differentiation (Figure 5B). These results suggest a negative selection pressure against mtDNA mutations in iPSCs.
To identify whether the selection during iPSC culture was random, we analyzed how different types of mutations behaved. In WT cells, mutations affecting the RC protein-coding genes showed significant negative selection and rRNA gene variants showed a similar tendency, whereas mutations affecting tRNA genes were not selected against (Figure 5C). In mutator cells, similar tendencies were seen, but the pattern did not reach significance, likely due to the strong background from the constant random generation of new mutations.
These data demonstrate that iPSCs show strong functional selection against mtDNA mutations in genes encoding the RC complex subunits, with little selection pressure directed toward tRNA mutations.
Discussion
ROS is a collective term for highly reactive molecules generated upon incomplete reduction of oxygen. They are mostly known for causing oxidative damage but are increasingly recognized to also function as important intracellular signaling molecules (Hamanaka and Chandel, 2010; Suda et al., 2011). This signaling has been suggested to operate through covalent modifications in the target proteins or through specific sensors able to detect and directly respond to intracellular changes through redox-based mechanisms (D’Autréaux and Toledano, 2007; Nathan, 2003). The physiological ROS signals, not associated with oxidative damage, are especially important for stem cell functions, promoting progenitor cell proliferation (Le Belle et al., 2011; Suda et al., 2011). mtDNA mutator mice manifest a severe early onset SSC dysfunction, explaining the progeroid phenotype of these mice (Ahlqvist et al., 2012; Chen et al., 2009; Norddahl et al., 2011). We show here that iPSC reprogramming and PSC self-renewal—stemness—are sensitive to subtle changes in ROS signaling, originating from mtDNA mutagenesis. Two different antioxidants, NAC and MitoQ, efficiently rescued the reprogramming and self-renewal defects in mutator PSCs, indicating that reprogramming to stem cells, as well as stem cells themselves, are sensitive to antioxidants. The mechanisms of action are different for NAC and MitoQ. NAC increases cellular glutathione pool and enhances processing of H2O2 in the cytosol, whereas MitoQ acts upstream, probably by sequestering or preventing superoxide production within mitochondria, before it forms H2O2.
Intense research aims to find factors important for reprogramming efficiency. Vitamin C, a cofactor with both antioxidant and pro-oxidant properties, was found to improve reprogramming efficiency (Esteban et al., 2010), raising the question whether ROS contribute to reprogramming. However, Vitamin C has a multitude of different functions, with a potential role in histone demethylation as well as DNA repair (Mandl et al., 2009), and therefore, the role of ROS in reprogramming remained open (Qi et al., 2015)—partially also due to lack of reliable methods to detect subtle changes in ROS levels. We demonstrate here, utilizing a mitochondria-targeted H2O2 reactive probe and ratiometric mass spectrometry (Cochemé et al., 2011, 2012), that mtDNA mutagenesis induces a subtle increase in mitochondrial H2O2, the rescue of which by MitoQ completely restores the reprogramming defect, whereas NAC rescued the defect partially. These data strongly suggest that mitochondria-derived H2O2 inhibits reprogramming efficiency. These antioxidants did not, however, improve WT reprogramming efficiency, suggesting that downregulation of mitochondrial respiration together with endogenous cellular ROS scavengers were sufficient to minimize H2O2 production upon reprogramming. The antioxidants did not ameliorate the growth defect of the mutator iPSCs or EBs, which was similar to that previously reported in mutator NSCs (Ahlqvist et al., 2012). This growth defect may be contributed by various anabolic functions of mitochondria beyond ATP production, but not by ROS signaling, indicating separate signaling for growth and stemness in iPSCs.
Our results indicate that the importance of ROS signaling in stem cells makes these cells also sensitive to antioxidants, with potential dose-dependent toxicity. MitoQ significantly impaired self-renewal of WT iPSCs at concentrations that were well tolerated by fibroblasts or differentiated neuronal cells, as well as the cells undergoing reprogramming, suggesting that the cellular metabolism of the latter is still partially fibroblast-like. In mouse embryos in vivo, doses improving mutator HPC phenotypes severely compromised NSC viability, raising the question of MitoQ safety for NSCs. MitoQ comprises ubiquinone, the antioxidant moiety of coenzyme-Q10, covalently linked to lipophilic TPP cation, which enables MitoQ to cross membranes efficiently and to accumulate several-hundred-fold within mitochondria in response to the organelle’s membrane potential (Murphy and Smith, 2007). Different tissues have been reported to accumulate MitoQ with different efficiencies (Rodriguez-Cuenca et al., 2010), making dose control for a specific cell type, or its mitochondria, difficult. A range of literature reports MitoQ treatment effects in many kinds of pathologies, in rodent models and also in human trials, with no reported in vivo toxicity in rodents following 4- or 5-month administration or in humans following 1 year’s administration (Smith and Murphy, 2010). For example, MitoQ delayed progression of cardiac damage and various types of neurodegenerative symptoms, including ALS and Alzheimer’s disease, in animal models (Manczak et al., 2010; Miquel et al., 2014; Yancey et al., 2015). However, a human trial for Parkinson’s disease found no effect of MitoQ for progression of the disease (Snow et al., 2010). No previous data exist on the effects of MitoQ on stem cells. Our results show that the therapeutic window of MitoQ for stem cells is narrow. In contrast, high concentrations of NAC did not show toxicity, which suggests to a specific feature for MitoQ and potentially for other mitochondria-accumulating antioxidants. TPP alone did not induce toxicity in NSCs in vivo, indicating that the high concentrations of TPP cations in mitochondria, which may lead to non-specific disruption of mitochondrial function (Murphy and Smith, 2007), did not explain the toxicity of MitoQ to NCSs. Our results show that special attention should be paid to antioxidant and redox effects on the stem cell compartment, especially when developing mitochondria-targeted antioxidants.
We found that mutator iPSCs actively downregulated mitochondrial respiration and showed a combined RC deficiency, which did not severely compromise their highly glycolytic energy metabolism or viability in high-glucose growth conditions. The enforced glycolysis was specific for mutator iPSC, and both MitoQ and NAC restored the metabolism to the bivalent WT mode, typical for mouse PSCs (Zhou et al., 2012). These data indicate that, even upon RC dysfunction and mtDNA mutagenesis, the metabolic shift to glycolysis and RC deficiency were partially reversible and mediated by ROS signaling. We propose that a glycolytic shift in stem cells exists as a protective response to maintain sensitivity to ROS signals.
The antioxidant rescue of RC protein amounts, restoring complex I and complex III to WT level, suggest that the major ROS producers of RC may be actively degraded as a response to mitochondrial mutagenesis. Complex I deficiency is a common finding in several mitochondrial disorders (Kirby et al., 1999), and recent evidence suggests that CI deficiency in disease can also be a physiological response to metabolic insult. In patients with mtDNA maintenance disorders, also including PolG defects, the degree of CI deficiency in the brain did not correlate with the severity—or even presence—of the brain manifestations (Palin et al., 2013). Furthermore, in iPSC-derived neurons carrying a pathological mitochondrial tRNA mutation, CI was enriched in autophagosomes prior to development of CI deficiency (Hämäläinen et al., 2013). The current findings support this degradation to be active, mediated by ROS, and partially rescued by antioxidant treatment.
mtDNA mutations accumulating in iPSCs could contribute to their metabolic phenotypes. The reprogramming process itself can contribute to mutation rates: nuclear genomic mutations arise during reprogramming and are selected against during subsequent culture (Hussein et al., 2011). iPSCs have also been reported to carry mtDNA mutations (Prigione et al., 2011). Whether these arise during reprogramming or represent changes that were present at low frequency in the parental cells and whether they are selected against during iPSC culture is unknown. We found that both mutator and WT cells showed an increase in mtDNA mutation load during reprogramming, suggesting that, similarly to nuclear DNA, also mtDNA mutations arise during the reprogramming process. However, whereas the mtDNA mutation loads were consistently higher in mutator cells than in WT cells, no specific mutations were present at high enough frequencies to account for the different characteristics between WT and mutator cells. The high proliferation rate of PSCs makes them particularly prone to generate mitochondrial mutations by replication errors. However, during in vitro culture, the WT iPSCs were able to eliminate most of their mtDNA mutations and the mutation loads did not increase during mutator iPSC culture either. This was unexpected, as the exonuclease-defective mtDNA polymerase should frequently generate new mutations. These results point to a strong purifying selection against mtDNA mutations in iPSCs. Such selection has been described to occur in oocyte development of mutator mice, with rapid elimination of especially the non-synonymous changes in the protein-coding mitochondrial genes in the so-called mtDNA bottleneck (Stewart et al., 2008). Indeed, iPSCs showed a similar preference to select against protein-coding gene mutations and to a lesser extent also against rRNA gene variants. Consistently, previous reports of human iPSCs generated from patients with mtDNA mutations showed that both mitochondrial tRNA and protein-coding gene mutations survived through reprogramming, but only tRNA mutations maintained stable heteroplasmy, whereas RC protein-coding gene mutation was purged upon iPSC culture (Folmes et al., 2013; Hämäläinen et al., 2013). These results suggest that the purifying selection of germ cells could be a general feature of stem cells.
In conclusion, we demonstrate that mtDNA mutations can reduce reprogramming efficiency of somatic cells and lead to stemness defects via ROS-mediated signaling. Antioxidants can cure these defects, and mitochondrial-targeted MitoQ was very effective in rescue but also showed toxic effects. Antioxidants are common dietary supplements worldwide. Little is, however, known of their cell-type-specific effects. Our data indicate that a therapeutic dose may vary considerably between cell types: a dose that may rescue pathology in one tissue may severely challenge function in another. An effect on NSC pool may remain undetected for years. Our data implicate the need of dose-effect studies of antioxidants on SSC pools to establish their safety as nutritional supplements or therapeutic agents—especially in the case of antioxidants accumulating into mitochondria.
Experimental Procedures
Establishment of Fibroblast Cultures
All animal experimentation was approved by the Ethical Review Board of Finland. Mice with a knockin inactivating mutation (D257A) in the exonuclease domain of DNA polymerase gamma (Kujoth et al., 2005) were used. For antioxidant supplementation, the mice were given either NAC (1 mg/ml; Sigma-Aldrich), MitoQ (0.75 mg/ml; provided by M.P.M.) or lipophilic dTPP without ubiquinone bound to cyclodextrin (0.48 mg/ml; equivalent to 0.75 mg/ml MitoQ) in the drinking water of the females throughout pregnancy. Fibroblasts were extracted from treated and non-treated E13.5–14.5 embryos using standard protocol. For in vitro culture, the medium was supplemented with either 100 μM NAC or 10–250 nM MitoQ throughout all experiments unless otherwise stated.
Characterization of Fibroblasts
To analyze growth of the fibroblasts, the cells were grown in Cell-IQ live-cell-imaging incubator. Growth curves were generated using Cell-IQ Analyzer software (CM Technologies). To assess the transfection efficiency, a piggybac transposon-based GFP plasmid was electroporated together with the pCyL43 transposase using the same setting as for the reprogramming plasmids. Stably transfected cells were analyzed by FACS for the proportion of GFP-positive cells 1 week later. For the clonality assays, the cells were plated on clonal dilutions and the number of colonies was counted 2 weeks later.
Generation and Culture of iPSCs
iPSCs were generated using transposon-mediated gene transfer (Woltjen et al., 2009, 2011). The transfections were done using Neon electroporator (Invitrogen; one pulse; 30 mS; 1,300 V) with 5 μg of DNA and 5 × 10⁵ cells per electroporation. The culture media was supplemented with 1 μg/ml of doxycycline on the next day. For reprogramming in different oxygen tensions, the electroporations were split on two separate plates: one cultured in 4% O2 (Biospherix ExVivo chamber) whereas the other in normal room air of around 20% O2. To assess the reprogramming efficiency, plates were stained on day 14 for alkaline phosphatase (AP) activity (Vector Red Alkaline Phosphate substrate kit). For clonality assays, cells were plated on day 0 on clonal dilutions and stained on day 7. The number of AP-positive clones was counted using ImageJ 1.44o software (NIH).
The screening for transgene silencing was done by lacZ staining (Woltjen et al., 2009, 2011), and karyotyping was done commercially (Chrombios). The iPSC growth curves were done by plating 2 × 10⁴ cells per well and counting the cell number on 4 consecutive days.
PCR and RT-PCR
DNA was purified from cells by phenol-chloroform extraction, and total RNA was purified using Trizol reagent (Invitrogen). Reverse transcription was performed using MMLV-RTase and random hexamers (Promega). Quantitative RT-PCR was performed using the CFX96 platform (Bio-Rad) and Dynamo Flash SYBRgreen qPCR kit (Thermo Scientific). All qPCR assays were performed twice and in triplicates. Relative gene expression levels were normalized against β-actin.
In Vitro Differentiation
EBs were generated by hanging drop method. The iPSCs were trypsinized to single cells, and drops of media with 200 cells/drop were hung on petri dish covers for 3 days, after which the EBs were cultured in suspension culture for an additional week and LIF was withdrawn from the EB culture medium. Secondary fibroblasts were generated by withdrawing LIF from the culture medium and inducing differentiation with 1 μM retinoic acid for 6 days. After this, the cells were passaged and cultured for 8 additional days in fibroblast media. At this point, all cells were flat and no cells with ESC-like morphology were present in the cultures.
Teratoma Formation
For teratoma formation, about 2 × 10⁵ iPSCs were injected intratesticularly into NMRI nude mice (Scanbur). After 6 weeks, tumors were collected, fixed overnight in 4% paraformaldehyde (PFA), embedded in paraffin, and stained with H&E. The experimental animal welfare committee of the District Government of Southern Finland approved the animal experiments.
Immunofluorescence and FACS
For immunofluorescence, cells were fixed with 4% PFA. SSEA1, FACS analyses were done on live cells. Primary antibodies were against SSEA1 (IF: 1:250, ab16285, Abcam; FACS: 1:100, 90230, Millipore), Nanog (1:250; ab80892; Abcam), Tuj-1 (1:500; Nordic BioSite), and GFAP (1:1,000; Chemicon). Nuclei were stained with DAPI. Flow cytometry was run using BD Accuri C6 Flow Cytometer and analyzed using the Accuri C6 Analysis software.
BrdU Incorporation and Apoptosis Assays
To determine the proliferation rate, iPSCs were incubated in 10 μM BrdU (BD PharMingen) for 15 min, fixed with ethanol, denatured with 1 M HCl, and permeabilized using 0.5% Triton X-100. Cells were stained using monoclonal anti-BrdU antibody (1:4; Becton Dickinson). Cells were run using BD Accuri C6 Flow Cytometer and analyzed using the Accuri C6 Analysis software.
Apoptosis was analyzed by Annexin V-FITCH Apoptosis Detection kit (BD PharMingen) according to the manufacturer’s instructions.
MitoP/MitoB Mass Spectrometry for ROS Measurement
A mitochondria-targeted ratiometric mass spectrometry probe MitoB was used to measure hydrogen peroxide in the mitochondrial matrix as published earlier (Cochemé et al., 2011, 2012). Briefly, the cells were incubated with 5 μM MitoB together with 50 U/ml catalase for 6 hr, after which media was collected, snap frozen, and processed for mass spectrometry.
SSC Analysis
Isolation and analysis of NSCs and HSCs were performed as previously described (Ahlqvist et al., 2012; Piltti et al., 2006).
Analysis of the RC Complexes by Western Blot
Primary antibodies were against COX1 (1:500; M404; Mitosciences), CI-NDUFA9 (1:2,000; ab14713; Abcam), CII-70kD (1:10,000; MS204; Mitosciences), CIII-UQCRC2 (1:2,500; ab14745; Abcam), CV-a (1:1,000; MS507; Mitosciences), b-Actin (1:2,000; SC1616; Santa Cruz Biotechnology), and TOM20 (1:500; SC11415; Santa Cruz Biotechnology). Western blot analysis was done from total protein lysates according to standard protocol.
COX Activity
IPSCs were grown on gelatin in chamber glasses and washed three times with PBS + Mg + Ca. The cells were incubated in preincubation medium (10% sucrose and 0.03% cobalt chloride in 50 mM Tris-HCl [pH 7.6]) for 15 min at RT. Cells were washed with sodium phosphate + sucrose, followed by incubation with cytochrome C, DAB hydrochloride, and catalase at + 37°C for 1 hr. After that, cells were washed and forwarded to microscopy.
Metabolism Assays
Cell metabolism was analyzed by Seahorse XFe96 extracellular flux platform using the XF Cell Mito Stress test and XF Glycolysis Stress Test kits (Seahorse Bioscience). Data were normalized against total protein amounts per well (analyzed by Bradford assay) and analyzed using Wave2.0 software (Seahorse Bioscience).
Next-Generation Sequencing
Genomic DNA concentrations were measured with Qubit BR dsDNA kit (Life Technologies). mtDNA was amplified from the genomic DNA using REPLI-g Mitochondrial DNA Kit (QIAGEN). After enrichment, the amplified mtDNA samples were processed to Illumina-sequencing-compatible libraries with Nextera DNA sample preparation kit (Illumina). The mtDNA concentrations were measured with Qubit dsDNA kit for Nextera tagmentation reaction. The reaction volume in Nextera tagmentation and amplification steps was 20 μl, and after both steps, the libraries were purified with EdgeBio Performa V3 96-Well Short Plate (Edge BioSystems). After amplification, the libraries were incubated with 4 μl of EdgeBio SOPE Resin and purified with EdgeBio Performa plates. After purification, the samples with different index tags were pooled together (2 μl each) and concentrated with DNA Clean & Concentrator-5 (Zymo Research). The sequencing-ready libraries were quantitated with Agilent 2100 Bioanalyzer High Sensitivity kit (Agilent). The libraries were sequenced in Illumina HiSeq system.
Statistical Analysis
Statistical analysis was performed when each group had at least three samples with unpaired t test (GraphPad Prism software). p < 0.05 was considered significant; ∗p < 0.05; ∗∗p < 0.005; ∗∗∗p < 0.0005. All results are presented as mean ± SEM.
Author Contributions
A.S. and R.H.H. designed the study, analyzed the data, and wrote the manuscript. R.H.H. and K.J.A. performed experiments. P.E. and M.L. performed next-gen sequencing and primary data analysis. T.O. performed teratoma assays, and A.L. and M.P.M. performed MS analysis and analyzed the data. All coauthors edited the manuscript.
Acknowledgments
We thank H. Koivumäki, T. Manninen, A. Muranen, A. Harju, and M. Innilä for technical assistance. T. Prolla is thanked for providing the mouse strain and A. Nagy for the reprogramming plasmids. S. Williams is thanked for advice on analyzing the NGS data. This work was supported by the Academy of Finland, the Sigrid Juselius Foundation, the Jane and Aatos Erkko Foundation, the University of Helsinki, The European Research Council, and the Medical Research Council (UK). M.P.M. is a member of the SAB and owns shares in Antipodean Pharmaceuticals, which is commercializing MitoQ.
Published: May 28, 2015
Footnotes
This is an open access article under the CC BY-NC-ND license (http://creativecommons.org/licenses/by-nc-nd/4.0/).
Supplemental Information includes three figures and one table and can be found with this article online at http://dx.doi.org/10.1016/j.celrep.2015.05.009.
Accession Numbers
The accession number for the mtDNA sequences reported in this paper is from the SRA Database: SRP056999.
Supplemental Information
References
- Ahlqvist K.J., Hämäläinen R.H., Yatsuga S., Uutela M., Terzioglu M., Götz A., Forsström S., Salven P., Angers-Loustau A., Kopra O.H. Somatic progenitor cell vulnerability to mitochondrial DNA mutagenesis underlies progeroid phenotypes in Polg mutator mice. Cell Metab. 2012;15:100–109. doi: 10.1016/j.cmet.2011.11.012. [DOI] [PubMed] [Google Scholar]
- Ameur A., Stewart J.B., Freyer C., Hagström E., Ingman M., Larsson N.G., Gyllensten U. Ultra-deep sequencing of mouse mitochondrial DNA: mutational patterns and their origins. PLoS Genet. 2011;7:e1002028. doi: 10.1371/journal.pgen.1002028. [DOI] [PMC free article] [PubMed] [Google Scholar]
- Barlow C., Hirotsune S., Paylor R., Liyanage M., Eckhaus M., Collins F., Shiloh Y., Crawley J.N., Ried T., Tagle D., Wynshaw-Boris A. Atm-deficient mice: a paradigm of ataxia telangiectasia. Cell. 1996;86:159–171. doi: 10.1016/s0092-8674(00)80086-0. [DOI] [PubMed] [Google Scholar]
- Chen M.L., Logan T.D., Hochberg M.L., Shelat S.G., Yu X., Wilding G.E., Tan W., Kujoth G.C., Prolla T.A., Selak M.A. Erythroid dysplasia, megaloblastic anemia, and impaired lymphopoiesis arising from mitochondrial dysfunction. Blood. 2009;114:4045–4053. doi: 10.1182/blood-2008-08-169474. [DOI] [PMC free article] [PubMed] [Google Scholar]
- Chouchani E.T., Pell V.R., Gaude E., Aksentijević D., Sundier S.Y., Robb E.L., Logan A., Nadtochiy S.M., Ord E.N., Smith A.C. Ischaemic accumulation of succinate controls reperfusion injury through mitochondrial ROS. Nature. 2014;515:431–435. doi: 10.1038/nature13909. [DOI] [PMC free article] [PubMed] [Google Scholar]
- Cochemé H.M., Quin C., McQuaker S.J., Cabreiro F., Logan A., Prime T.A., Abakumova I., Patel J.V., Fearnley I.M., James A.M. Measurement of H2O2 within living Drosophila during aging using a ratiometric mass spectrometry probe targeted to the mitochondrial matrix. Cell Metab. 2011;13:340–350. doi: 10.1016/j.cmet.2011.02.003. [DOI] [PMC free article] [PubMed] [Google Scholar]
- Cochemé H.M., Logan A., Prime T.A., Abakumova I., Quin C., McQuaker S.J., Patel J.V., Fearnley I.M., James A.M., Porteous C.M. Using the mitochondria-targeted ratiometric mass spectrometry probe MitoB to measure H2O2 in living Drosophila. Nat. Protoc. 2012;7:946–958. doi: 10.1038/nprot.2012.035. [DOI] [PubMed] [Google Scholar]
- D’Autréaux B., Toledano M.B. ROS as signalling molecules: mechanisms that generate specificity in ROS homeostasis. Nat. Rev. Mol. Cell Biol. 2007;8:813–824. doi: 10.1038/nrm2256. [DOI] [PubMed] [Google Scholar]
- de Boer J., Andressoo J.O., de Wit J., Huijmans J., Beems R.B., van Steeg H., Weeda G., van der Horst G.T., van Leeuwen W., Themmen A.P. Premature aging in mice deficient in DNA repair and transcription. Science. 2002;296:1276–1279. doi: 10.1126/science.1070174. [DOI] [PubMed] [Google Scholar]
- Esteban M.A., Wang T., Qin B., Yang J., Qin D., Cai J., Li W., Weng Z., Chen J., Ni S. Vitamin C enhances the generation of mouse and human induced pluripotent stem cells. Cell Stem Cell. 2010;6:71–79. doi: 10.1016/j.stem.2009.12.001. [DOI] [PubMed] [Google Scholar]
- Folmes C.D., Martinez-Fernandez A., Perales-Clemente E., Li X., McDonald A., Oglesbee D., Hrstka S.C., Perez-Terzic C., Terzic A., Nelson T.J. Disease-causing mitochondrial heteroplasmy segregated within induced pluripotent stem cell clones derived from a patient with MELAS. Stem Cells. 2013;31:1298–1308. doi: 10.1002/stem.1389. [DOI] [PMC free article] [PubMed] [Google Scholar]
- Fox R.G., Magness S., Kujoth G.C., Prolla T.A., Maeda N. Mitochondrial DNA polymerase editing mutation, PolgD257A, disturbs stem-progenitor cell cycling in the small intestine and restricts excess fat absorption. Am. J. Physiol. Gastrointest. Liver Physiol. 2012;302:G914–G924. doi: 10.1152/ajpgi.00402.2011. [DOI] [PMC free article] [PubMed] [Google Scholar]
- Gu Y., Seidl K.J., Rathbun G.A., Zhu C., Manis J.P., van der Stoep N., Davidson L., Cheng H.L., Sekiguchi J.M., Frank K. Growth retardation and leaky SCID phenotype of Ku70-deficient mice. Immunity. 1997;7:653–665. doi: 10.1016/s1074-7613(00)80386-6. [DOI] [PubMed] [Google Scholar]
- Hämäläinen R.H., Manninen T., Koivumäki H., Kislin M., Otonkoski T., Suomalainen A. Tissue- and cell-type-specific manifestations of heteroplasmic mtDNA 3243A>G mutation in human induced pluripotent stem cell-derived disease model. Proc. Natl. Acad. Sci. USA. 2013;110:E3622–E3630. doi: 10.1073/pnas.1311660110. [DOI] [PMC free article] [PubMed] [Google Scholar]
- Hamanaka R.B., Chandel N.S. Mitochondrial reactive oxygen species regulate cellular signaling and dictate biological outcomes. Trends Biochem. Sci. 2010;35:505–513. doi: 10.1016/j.tibs.2010.04.002. [DOI] [PMC free article] [PubMed] [Google Scholar]
- Hussein S.M., Batada N.N., Vuoristo S., Ching R.W., Autio R., Närvä E., Ng S., Sourour M., Hämäläinen R., Olsson C. Copy number variation and selection during reprogramming to pluripotency. Nature. 2011;471:58–62. doi: 10.1038/nature09871. [DOI] [PubMed] [Google Scholar]
- Kelso G.F., Porteous C.M., Coulter C.V., Hughes G., Porteous W.K., Ledgerwood E.C., Smith R.A., Murphy M.P. Selective targeting of a redox-active ubiquinone to mitochondria within cells: antioxidant and antiapoptotic properties. J. Biol. Chem. 2001;276:4588–4596. doi: 10.1074/jbc.M009093200. [DOI] [PubMed] [Google Scholar]
- Kirby D.M., Crawford M., Cleary M.A., Dahl H.H., Dennett X., Thorburn D.R. Respiratory chain complex I deficiency: an underdiagnosed energy generation disorder. Neurology. 1999;52:1255–1264. doi: 10.1212/wnl.52.6.1255. [DOI] [PubMed] [Google Scholar]
- Kolesar J.E., Safdar A., Abadi A., MacNeil L.G., Crane J.D., Tarnopolsky M.A., Kaufman B.A. Defects in mitochondrial DNA replication and oxidative damage in muscle of mtDNA mutator mice. Free Radic. Biol. Med. 2014;75:241–251. doi: 10.1016/j.freeradbiomed.2014.07.038. [DOI] [PubMed] [Google Scholar]
- Kujoth G.C., Hiona A., Pugh T.D., Someya S., Panzer K., Wohlgemuth S.E., Hofer T., Seo A.Y., Sullivan R., Jobling W.A. Mitochondrial DNA mutations, oxidative stress, and apoptosis in mammalian aging. Science. 2005;309:481–484. doi: 10.1126/science.1112125. [DOI] [PubMed] [Google Scholar]
- Le Belle J.E., Orozco N.M., Paucar A.A., Saxe J.P., Mottahedeh J., Pyle A.D., Wu H., Kornblum H.I. Proliferative neural stem cells have high endogenous ROS levels that regulate self-renewal and neurogenesis in a PI3K/Akt-dependant manner. Cell Stem Cell. 2011;8:59–71. doi: 10.1016/j.stem.2010.11.028. [DOI] [PMC free article] [PubMed] [Google Scholar]
- Logan A., Shabalina I.G., Prime T.A., Rogatti S., Kalinovich A.V., Hartley R.C., Budd R.C., Cannon B., Murphy M.P. In vivo levels of mitochondrial hydrogen peroxide increase with age in mtDNA mutator mice. Aging Cell. 2014;13:765–768. doi: 10.1111/acel.12212. [DOI] [PMC free article] [PubMed] [Google Scholar]
- Manczak M., Mao P., Calkins M.J., Cornea A., Reddy A.P., Murphy M.P., Szeto H.H., Park B., Reddy P.H. Mitochondria-targeted antioxidants protect against amyloid-beta toxicity in Alzheimer’s disease neurons. J. Alzheimers Dis. 2010;20(Suppl 2):S609–S631. doi: 10.3233/JAD-2010-100564. [DOI] [PMC free article] [PubMed] [Google Scholar]
- Mandl J., Szarka A., Bánhegyi G. Vitamin C: update on physiology and pharmacology. Br. J. Pharmacol. 2009;157:1097–1110. doi: 10.1111/j.1476-5381.2009.00282.x. [DOI] [PMC free article] [PubMed] [Google Scholar]
- Miquel E., Cassina A., Martínez-Palma L., Souza J.M., Bolatto C., Rodríguez-Bottero S., Logan A., Smith R.A., Murphy M.P., Barbeito L. Neuroprotective effects of the mitochondria-targeted antioxidant MitoQ in a model of inherited amyotrophic lateral sclerosis. Free Radic. Biol. Med. 2014;70:204–213. doi: 10.1016/j.freeradbiomed.2014.02.019. [DOI] [PubMed] [Google Scholar]
- Murphy M.P. How mitochondria produce reactive oxygen species. Biochem. J. 2009;417:1–13. doi: 10.1042/BJ20081386. [DOI] [PMC free article] [PubMed] [Google Scholar]
- Murphy M.P., Smith R.A. Targeting antioxidants to mitochondria by conjugation to lipophilic cations. Annu. Rev. Pharmacol. Toxicol. 2007;47:629–656. doi: 10.1146/annurev.pharmtox.47.120505.105110. [DOI] [PubMed] [Google Scholar]
- Nathan C. Specificity of a third kind: reactive oxygen and nitrogen intermediates in cell signaling. J. Clin. Invest. 2003;111:769–778. doi: 10.1172/JCI18174. [DOI] [PMC free article] [PubMed] [Google Scholar]
- Norddahl G.L., Pronk C.J., Wahlestedt M., Sten G., Nygren J.M., Ugale A., Sigvardsson M., Bryder D. Accumulating mitochondrial DNA mutations drive premature hematopoietic aging phenotypes distinct from physiological stem cell aging. Cell Stem Cell. 2011;8:499–510. doi: 10.1016/j.stem.2011.03.009. [DOI] [PubMed] [Google Scholar]
- Palin E.J., Paetau A., Suomalainen A. Mesencephalic complex I deficiency does not correlate with parkinsonism in mitochondrial DNA maintenance disorders. Brain. 2013;136:2379–2392. doi: 10.1093/brain/awt160. [DOI] [PubMed] [Google Scholar]
- Piltti K., Kerosuo L., Hakanen J., Eriksson M., Angers-Loustau A., Leppä S., Salminen M., Sariola H., Wartiovaara K. E6/E7 oncogenes increase and tumor suppressors decrease the proportion of self-renewing neural progenitor cells. Oncogene. 2006;25:4880–4889. doi: 10.1038/sj.onc.1209492. [DOI] [PubMed] [Google Scholar]
- Prigione A., Lichtner B., Kuhl H., Struys E.A., Wamelink M., Lehrach H., Ralser M., Timmermann B., Adjaye J. Human induced pluripotent stem cells harbor homoplasmic and heteroplasmic mitochondrial DNA mutations while maintaining human embryonic stem cell-like metabolic reprogramming. Stem Cells. 2011;29:1338–1348. doi: 10.1002/stem.683. [DOI] [PubMed] [Google Scholar]
- Qi S., Fang Z., Wang D., Menendez P., Yao K., Ji J. Concise review: induced pluripotency by defined factors: prey of oxidative stress. Stem Cells. 2015;33:1371–1376. doi: 10.1002/stem.1946. [DOI] [PubMed] [Google Scholar]
- Rodriguez-Cuenca S., Cochemé H.M., Logan A., Abakumova I., Prime T.A., Rose C., Vidal-Puig A., Smith A.C., Rubinsztein D.C., Fearnley I.M. Consequences of long-term oral administration of the mitochondria-targeted antioxidant MitoQ to wild-type mice. Free Radic. Biol. Med. 2010;48:161–172. doi: 10.1016/j.freeradbiomed.2009.10.039. [DOI] [PubMed] [Google Scholar]
- Smith R.A., Murphy M.P. Animal and human studies with the mitochondria-targeted antioxidant MitoQ. Ann. N Y Acad. Sci. 2010;1201:96–103. doi: 10.1111/j.1749-6632.2010.05627.x. [DOI] [PubMed] [Google Scholar]
- Snow B.J., Rolfe F.L., Lockhart M.M., Frampton C.M., O’Sullivan J.D., Fung V., Smith R.A., Murphy M.P., Taylor K.M. A double-blind, placebo-controlled study to assess the mitochondria-targeted antioxidant MitoQ as a disease-modifying therapy in Parkinson’s disease. Mov. Disord. 2010;25:1670–1674. doi: 10.1002/mds.23148. [DOI] [PubMed] [Google Scholar]
- Stewart J.B., Freyer C., Elson J.L., Wredenberg A., Cansu Z., Trifunovic A., Larsson N.G. Strong purifying selection in transmission of mammalian mitochondrial DNA. PLoS Biol. 2008;6:e10. doi: 10.1371/journal.pbio.0060010. [DOI] [PMC free article] [PubMed] [Google Scholar]
- Suda T., Takubo K., Semenza G.L. Metabolic regulation of hematopoietic stem cells in the hypoxic niche. Cell Stem Cell. 2011;9:298–310. doi: 10.1016/j.stem.2011.09.010. [DOI] [PubMed] [Google Scholar]
- Trifunovic A., Wredenberg A., Falkenberg M., Spelbrink J.N., Rovio A.T., Bruder C.E., Bohlooly-Y M., Gidlöf S., Oldfors A., Wibom R. Premature ageing in mice expressing defective mitochondrial DNA polymerase. Nature. 2004;429:417–423. doi: 10.1038/nature02517. [DOI] [PubMed] [Google Scholar]
- Trifunovic A., Hansson A., Wredenberg A., Rovio A.T., Dufour E., Khvorostov I., Spelbrink J.N., Wibom R., Jacobs H.T., Larsson N.G. Somatic mtDNA mutations cause aging phenotypes without affecting reactive oxygen species production. Proc. Natl. Acad. Sci. USA. 2005;102:17993–17998. doi: 10.1073/pnas.0508886102. [DOI] [PMC free article] [PubMed] [Google Scholar]
- Woltjen K., Michael I.P., Mohseni P., Desai R., Mileikovsky M., Hämäläinen R., Cowling R., Wang W., Liu P., Gertsenstein M. piggyBac transposition reprograms fibroblasts to induced pluripotent stem cells. Nature. 2009;458:766–770. doi: 10.1038/nature07863. [DOI] [PMC free article] [PubMed] [Google Scholar]
- Woltjen K., Hämäläinen R., Kibschull M., Mileikovsky M., Nagy A. Transgene-free production of pluripotent stem cells using piggyBac transposons. Methods Mol. Biol. 2011;767:87–103. doi: 10.1007/978-1-61779-201-4_7. [DOI] [PubMed] [Google Scholar]
- Yancey D.M., Guichard J.L., Ahmed M.I., Zhou L., Murphy M.P., Johnson M.S., Benavides G.A., Collawn J., Darley-Usmar V., Dell’Italia L.J. Cardiomyocyte mitochondrial oxidative stress and cytoskeletal breakdown in the heart with a primary volume overload. Am. J. Physiol. Heart Circ. Physiol. 2015;308:H651–H663. doi: 10.1152/ajpheart.00638.2014. [DOI] [PMC free article] [PubMed] [Google Scholar]
- Zhang J., Khvorostov I., Hong J.S., Oktay Y., Vergnes L., Nuebel E., Wahjudi P.N., Setoguchi K., Wang G., Do A. UCP2 regulates energy metabolism and differentiation potential of human pluripotent stem cells. EMBO J. 2011;30:4860–4873. doi: 10.1038/emboj.2011.401. [DOI] [PMC free article] [PubMed] [Google Scholar]
- Zhou W., Choi M., Margineantu D., Margaretha L., Hesson J., Cavanaugh C., Blau C.A., Horwitz M.S., Hockenbery D., Ware C., Ruohola-Baker H. HIF1α induced switch from bivalent to exclusively glycolytic metabolism during ESC-to-EpiSC/hESC transition. EMBO J. 2012;31:2103–2116. doi: 10.1038/emboj.2012.71. [DOI] [PMC free article] [PubMed] [Google Scholar]
Associated Data
This section collects any data citations, data availability statements, or supplementary materials included in this article.