Abstract
Normal glucose regulation is achieved by having adequate insulin secretion and effective glucose uptake/disposal. Excess lipids in peripheral tissues: skeletal muscle, liver and adipose tissue may attenuate insulin signaling through the protein kinase B (AKt/PKB) pathway and upregulate protein tyrosine phosphatase 1B (PTP1B), a negative regulator of insulin signaling. We studied accumulation of lipid metabolites [triglycerides (TAGs), diglycerides (DAGs)] and ceramides in relation to insulin signaling and expression and phosphorylation of PTP1B by preincubating rat skeletal muscle cells (L6 myotubes) with 3 saturated and 3 unsaturated free fatty acids (FFAs) (200uM). Cells were also evaluated in the presence of wortmannin an inhibitor of Phosphatidylinositol 3-kinases and thus AKt (0–100nM). Unsaturated FFAs increased DAGs, TAGs and PTP1B expression significantly but, cells remained insulin sensitive as assessed by robust AKt and PTP1B phosphorylation at Serine (Ser) 50, Ser 398 and Tyrosine (Tyr) 152. Saturated palmitic and stearic acids increased ceramides, upregulated PTP1B and had AKt and PTP1B phosphorylation at Ser 50 impaired. With increasing palmitic acid dose (0–200 uM), we show a significant positive correlation between phosphorylation levels of AKt and of PTP1B at Ser 50 (R2=0.84; P<0.05). The same was observed with increasing wortmannin dose (R2=0.73; P<0.05). Only FFAs that increased ceramides caused impairment of AKt and PTP1B phosphorylation at Ser 50. PTP1B overexpression in presence of excess lipids may not directly cause insulin resistance unless it is accompanied by decreased PTP1B phosphorylation. A clear relationship between PTP1B phosphorylation levels at Ser 50 and its negative effect on insulin signaling is shown.
Keywords: Ceramides, Triglycerides, Diglycerides, Insulin signaling, AKt, PTP1B
INTRODUCTION
Insulin resistance, a state in which peripheral tissues demonstrate a diminished reponse to the glucose-lowering properties of insulin, plays a central role in the development of type 2 diabetes mellitus. Because increased plasma free fatty acids (FFAs) levels are observed in this condition, it is thought that the molecular mechanisms of insulin resistance are adversely affected by increased lipid flux [1]. Animal models with gene deletions in pathways of fatty acid synthesis and storage show increased metabolic rate, reduced intramuscular lipid storage and improved insulin action when challenged with a high lipid load [2]. It is therefore postulated that the accumulation of excess lipids in promotes insulin resistance through pathways associated with fatty acid synthesis, metabolism and storage.
Skeletal muscle accounts for the majority of insulin-stimulated glucose utilization and is a key tissue for development of insulin resistance. Exposure of skeletal muscle to excess lipids increases reactive oxygen species (ROS) production, impairs FFA oxidation, and decreases PGC-1 expression, a protein that induces expression of oxidative enzymes and mitochondrial biogenesis [3]. Impaired mitochondrial uptake and oxidative stress have been suggested as major contributors to the development or maintenance of lipid-induced insulin resistance in skeletal muscle [2, 3, 4]. Previous studies have shown that palmitic acid impairs insulin signaling through the AKt/PKB pathway [5, 6]. Recent work from our laboratory has characterized the inhibitory effects of palmitic acid on insulin sensitivity and overexpression of PTP1B, a phosphatase that impairs insulin signaling by dephosphorylating the insulin receptor and post-insulin receptor substrates such as Insulin receptor substrate 1 (IRS-1) [7]. We also recently demonstrated that novel compounds that enhance insulin sensitivity in the presence of increased lipid content result in not only enhanced Akt-1 and -2 phosphorylation, but enhanced PTP1B phosphorylation [7]. Although saturated FFAs have been implicated in the development of insulin resistance, some mono and poly unsaturated fatty acids appear to either have no adverse effects or positively enhance insulin action [8]. Many in vivo studies on animals have reported contradictory studies with respect to unsaturated fatty acids partly because dietary fat is administered to animals as a mixture of several FFAs, hence effect of specific fatty acids is not clear in such scenarios.
Both in vitro and in vivo, excess lipid supply leads to partitioning of long-chain acyl-CoAs toward the synthesis and accumulation of fatty acid-derived lipid signaling intermediates DAGs, TAGs and ceramides. These metabolites have been associated with attenuating insulin-signaling pathways and, consequently, decreased responses to the hormone [5, 6, 7, 9, 10, 11]. Several authors have shown that reduced oxidative capacity is related to intracellular accumulation of these metabolites [3, 10, 12, 13]. Many of these mechanisms involving fatty acid derived metabolites have been demonstrated in situations in which lipid accumulation or obesity already exists. Direct effects of specific FFAs on lipid metabolites generated in skeletal muscle cells and relevant mechanisms are still not fully elucidated. Most studies on the effect of FFAs have utilized palmitic acid (16:0). Therefore the effect of other common dietary FFAs on generation of lipid metabolites and overall effect on insulin signaling is not clear. The role of specific metabolites is also not clear.
We hypothesized that both AKt phosphorylation and PTP1B over expression may be influenced by FFA type. This in turn may be linked to the type and quantity of fatty acid derived metabolites generated by the different fatty acids i.e DAGs, TAGs and ceramides. This hypothesis was addressed herein to assess lipid-induced metabolic dysfunction in a skeletal muscle cell culture model. The effects of six selected saturated and unsaturated FFAs on insulin response are investigated in rat skeletal muscle cells (L6). We examine insulin response in parallel with lipid metabolites accumulation and expression of protein tyrosine phosphatase 1B (PTP1B), a protein that attenuates the insulin signaling pathway. We discuss the interaction between lipid metabolite accumulation and insulin action. We also further explore the effect of PTP1B phosphorylation by Akt and how this affects insulin signaling using a varying dose of palmitic acid and wortmainin, an AKt inhibitor. Treatment with all FFAs resulted in an upregulation of PTP1B expression both at transcription and protein levels. However results show that PTP1B has a negative effect on insulin sensitivity only when phosphorylation atSer 50 is reduced. The phosphorylation levels of PTP1B at Ser 50 and Akt are positively correlated.
RESEARCH DESIGN AND METHODS
Materials
Standards and Reagents
FFAs studied were: unsaturated palmitoleic acid (16:1) and oleic (18:1) and Linoleic (18:2), saturated fatty acids Myristic (14:0), palmitic (16:0) and stearic (18:0). All FFAs and the reagent wortmannin were obtained from Sigma Aldrich (St Louis, MO). Ceramide standards were purchased from Avanti Polar Lipids (Alabaster, AL, USA). All organic solvents were HPLC grade, American Chemical Society (ACS) certified.
Cell Culture
L6 myoblasts (ATCC) were maintained in 100mm dishes at 37°C, 95% air and 5% CO2 in low glucose Dulbecco’s modified Eagle’s medium (DMEM) media with 10% CBS serum and antibiotics. For individual experiments, myoblasts were subcultured onto 6-well or 12 well culture plates, grown to 70–80% confluence and then differentiated into fused myotubes for 5 days by switching to culture media with 2% horse serum before use in subsequent experiments. All cells used were within 5 passages.
FFAs treatment
FFAs were administered to myotubes by conjugating them with 2% FFA- free bovine serum albumin. To quantify accumulation of lipid metabolites and insulin resistance, L6 myotubes were pretreated for 24 hr with BSA or BSA complexed with 200 μM fatty acids. Cultures were extracted for lipids and used to quantify monoglycerides, diglycerides, triglycerides and ceramides as outlined in sections below. To examine effect of FFAs on insulin signaling, myotubes were serum starved in DMEM media containing 0.2% BSA and treated with fatty acids for 16 hours. Insulin was added at a final concentration of 100 nM for 10 minutes before subsequent tests.
Extraction of Lipids for Lipid metabolite quantitation
Cells grown in 6 well plates were collected into microtubes with 200ul ice cold DI water. After sonication, 2ul of the solution was removed for protein determination.. An aliquot equivalent to 300ug protein for each sample was extracted: for samples aimed for ceramide analysis only, 4ul of a 10ug/ml ceramide C17 was added to the remaining cells as the extraction standard. C17 does not occur naturally but has properties similar to naturally occurring ceramides in mammalian cells. Lipids were extracted using Folch’s partition. 300ul of methanol/chloroform (1:2) was added to the cells and the suspension was vortexed for 10s and then placed on a shaker at 4°C for one hour. Lysates were spun for 10 min at 10000 rpm. The lower chloroformic layer was transferred to a new tube and placed on ice. The upper methanolic and the middle proteinous layers were sonicated and subjected to a second extraction. The lower chloroformic layer was added to the first one and stored at −80°C until analysis.
Quantitative Analysis of intracellular Acylglycerides
Lipid extracts were dried under nitrogen gas at room temperature, reconstituted with 100ul chloroform and silylated by adding 100ul N-methyl-N-trimethylsilyltrifluoracetamide (MSTFA) then allowed to stand for 30 minutes at room temperature. Acylglycerides (monoglycerides, diglycerides and triglycerides) were analysed simultaneously by gas chromatography coupled by a flame ionization detector (GC-FID). Calibration was performed using internal standards monoolein, diolein, and and triolein at 500ug/ml to analyse mono-, di-, and triglycerides respectively. The system used was a Model 8610C gas chromatograph (SRI instruments California). The column was a MXT®-Biodiesel TG 13m, 0.53mm ID, 0.16μm film thickness with built-in 2m inlet-Gap (total column length 15m). Chromatography gas was hydrogen at 25ml/min and carrier gas was helium at 4ml/min. 1.0ul sample was injected into the column injection port. The temperature program was initial hold of 2min. at 50°C followed by a ramp of 15°C/min to a final temperature of 380°C. Total run time was 29 minutes. Peak areas and retention times were determined by computer integration and used to quantify individual metabolites.
Quantitative Analysis of intracellular Ceramides
Lipid extracts were dried under nitrogen gas at room temperature and reconstituted with 200ul acetonitrile. Liquid chromatography-electrospray ionization tandem-mass spectrometry (LC-ESI-MS/MS) was used to measure intracellular levels of ceramides C16, C18, C18:1, C20, C22, C24 and C24:1 according to the method shown in Obanda et al [7].
Instrumentation and software
LC was performed using a Waters Acquity UPLC with a binary pump and Acquity autosampler according to the method shown in Obanda et al [7].
Protein content and insulin signaling assessments
Protein content for AKt and PTP1B, and AKt phosphorylation and PTP1B phosphorylation were determined by Western blotting. L6 cells were collected 10 min after addition of 100 nM insulin. Cells were collected with 100ul of lysis buffer (1% Triton X-100, 20 mmol Tris (pH 75), 2.5 mmol sodium pyrophosphate, 150 mmol NaCl, 1 mmol EGTA, 1 mmol sodium vanadate, 2 mM beta-glycerophosphate, 1 μg/ml leupeptin and 1 ul/ml aprotinin) at 4°C. Extracts were sonicated and then centrifuged at 10000g at 4°C for 10 minutes. Extracts corresponding to 40 μg of protein, were separated on 8% sodium dodecyl sulfate–polyacrylamide gel electrophoresis minigels. Specific antibodies used were anti-AKt 1 and 2, anti-AKt 1 and 2 phospho, anti-PTP1B (Upstate Biotechnology, Lake Placid, NY). In addition, we used β-actin (Santa Cruz Biotechnology, Santa Cruz, CA).
To examine effect of AKt phosphorylation on PTP1B phosphorylation, a dose response study using palmitic acid (0–200uM) and wortmannin (0–100nM) in a different set of cells was conducted in order to study effect of inhibiting AKt phosphorlation on corresponding activity of PTP1B. Wortmannin is a known PI3K inhibitor and hence inhibits AKt activity.
Total RNA extraction, purification and cDNA sysnthesis
Total RNA was purified from L6 cells using TRIzol® reagent (Invitrogen) according to the manufacturer’s instructions. RNA total content and quality was determined spectrophotometrically by absorbance measurements at 260 and 280nm using the NanoDrop system (NanoDrop Technologies). The cDNAs were synthesized with 2.5ug of DNA for each sample by reverse transcription (Qiagen) following manufactures protocol.
Real-time reverse transcriptase polymerase chain reaction
Synthesized cDNAs were diluted four fold. Five microlitres of each diluted sample was used for PCR reactions of 20ul final volume. Other components making up this final volume for PCR reactions were 5ul of 6uM gene-specific commercial primers (synthesized by IDT, Coralville, IA) and 10ul SYBR Green PCR master mix (Qiagen). PCR amplification was carried out by denaturing at 95°C for 15s, annealing and extension at 60°C for 1 min for 40 cycles. The RTPCR was analyzed by the Sequence Detection System SDS (Rotor Gene 6000). The amounts of the PTP1B, AKT 1 and AKT2 mRNA were normalized to the amount of β-actin mRNA, as an internal control.
PTP1B activity
PTP1B activity was assayed on cells collected with 100ul pNPP buffer (25mM Hepes, pH 7.2, 50 mM Nacl, 5 mM dithiothreitol, 2.5 mM EDTA). The colorimetric pNPP hydrolysis assay based on the ability of phosphatases to catalyze the hydrolysis of PNPP to p-nitrophenol, a chromogenic product was used. The intensity of the color reaction was measured at 410 nm on a Bio-Rad micro plate spectrophotometer. Results were normalized by protein concentration
Glycogen assay
Glycogen hydrolysis and glucose determination were performed on cells grown in 12 well plates according to the method of Gomez-Lechon et al. [14] with modifications shown in Wang et al. [15]. Results were normalized by protein concentration (Bio-Rad protein assay kit: Bio-Rad Laboratories, Hercules, CA), and glycogen content presented as ug glucose equivalent per well.
Statistical analysis
Data are presented as means+SE of three experiments. The difference between means was estimated using an ANOVA with subsequent Fisher’s protected least significant difference tests or a Student’s t-test for unpaired data. The glycogen accumulation data was analysed by a two way ANOVA. A value of P < 0.05 was considered significant. Bands from immunoblots were quantified using Image J software.
RESULTS
Quantification of Acylglycerides and ceramides
All treatments with FFAs resulted in a significant increase in total diglycerides and triglycerides (TAGs), irrespective of whether the fatty acid was saturated or unsaturated (Figure 1). Ceramide profiles after treatment by each FFA is shown in Figure 2. Only the saturated FFAs C16:0 (palmitic) and C 18:0 (Stearic) resulted in a significant change in total ceramides and individual ceramide profiles. Saturated myristic acid (14:0) as expected resulted in no change in ceramide profile and total ceramides. Although oleic acid resulted in a significant increase in ceramide C18:1, total ceramide levels were not different from the control. Ceramide species C16 was the most abundant species formed followed by and 24:1.
Figure 1. Total Acylglycerols in L6 cells after FFA treatment.
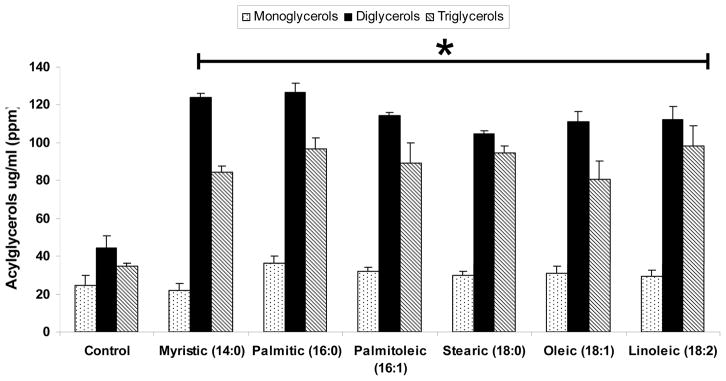
As demonstrated, the amount of DAGs and TAGs significantly increased in all FFA treated cells compared to the control * (Values are means +SEM *p<0.05 compared with control; No significant differences between all FFA treated groups was observed (P=ns).
Figure 2. Ceramide profiles by Different FFA treatments.
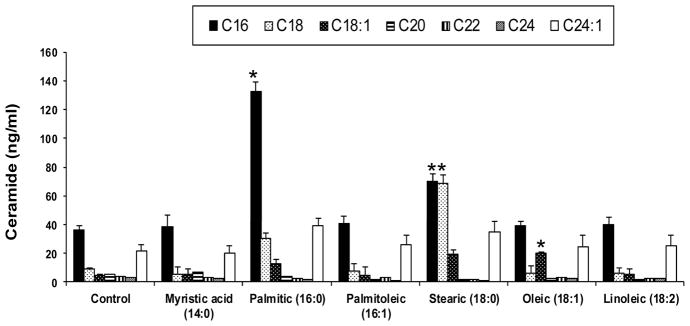
Demonstrates intracellular levels of ceramides C16, C18, C18:1, C20, C22, C24 and C24:1 and C17 from different FFA treatments. Values are means +SEM *p<0.05 compared with control; Only 16:0 and 18:0 resulted in a significant increase in total ceramides formed and a significant change in ceramide profile.
Insulin Signaling and PTP1B expression and phosphorylation
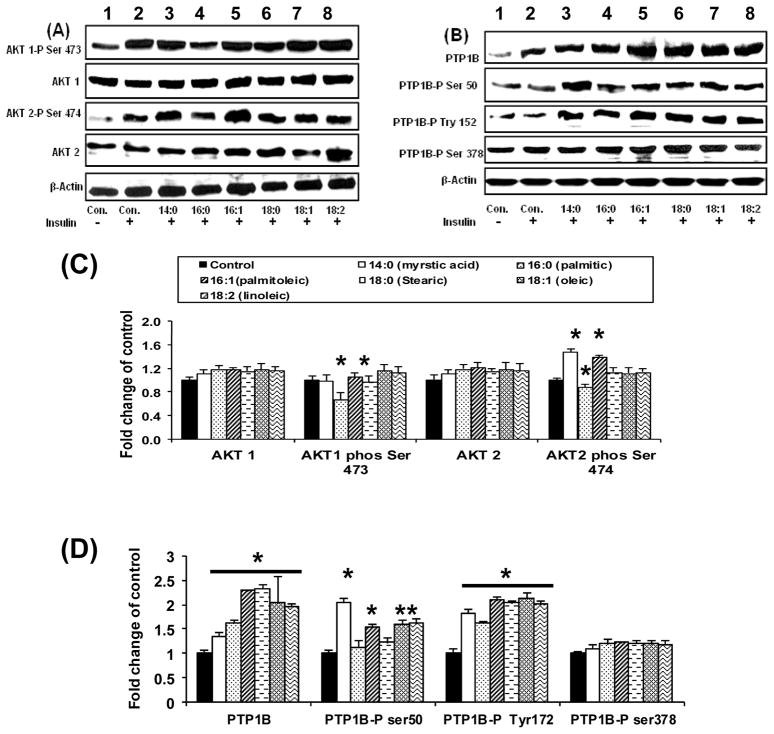
As shown in Figure 3A and 3C, only the saturated palmitic (16:0) and stearic acids (18:0) affected both AKt 1 and 2 phosphorylation negatively (p<0.05) (Fig 3A, lanes 4 and 6). Saturated myristic acid and all unsaturated fatty acids had no negative effect on AKt phosphorylation. In fact Akt-2 phosphorylation was improved in presence of myristic and palmitoleic acid (16:1) (Fig 3A Lanes 3 and 5) while the effect of oleic acid (18:1) and linoleic acid (18:2) was not different from that of the control (p=ns). There was no change in total AKt protein content.
Figure 3. Western blotting after exposure to FFAs.
Insulin Signaling response to FFAs
Figure 3A and C demonstrate variation of Akt expression and phosphorylation with FFA type. Figure 3B and D demonstrate variation of PTP1B expression and phosphorylation with FFA type.
Lower panels (3C and 3D) shows quantification of the blots from three separate experiments (Values are means +SEM *p<0.05 compared with control (insulin stimulated only);
All FFAs irrespective of saturation level or carbon chain resulted in an increase in PTP1B protein expression significantly from the control (Fig 3B and 3D). PTP1B was phosphorylated highly at Ser 50 in the treatments with myristic acid and unsaturated FFAs, i.e those that result in no reduction in AKt phosphorylation (Fig 3B, lanes 3, 5,7 and 8). Phosphorylation of PTP1B at Ser 378 and Tyr 152 did not vary with FFA treatment type but was higher in all FFA treated cells compared to the control because of increased PTP1B expression. Decreased phosphorylation at Ser 50 results in a decrease in insulin sensitivity.
Real-time reverse transcriptase polymerase chain reaction
To investigate effect of FFAs on PTP1B or AKt mRNA level, differentiated myotubes were treated with 200uM of each FFA or 1% BSA for 24 h. As shown in Figure. 4, all fatty acids significantly increased PTP1B mRNA levels (1.25 to 1.4 fold, p<0.05) in L6 myotubes compared control cells. Interestingly, unsaturated FFAs caused significant increases in PTP1B levels shown both in western blotting and by PTP1B mRNA levels in myotubes (p<0.01).
Figure 4. mRNA gene expression after FFA treatment.
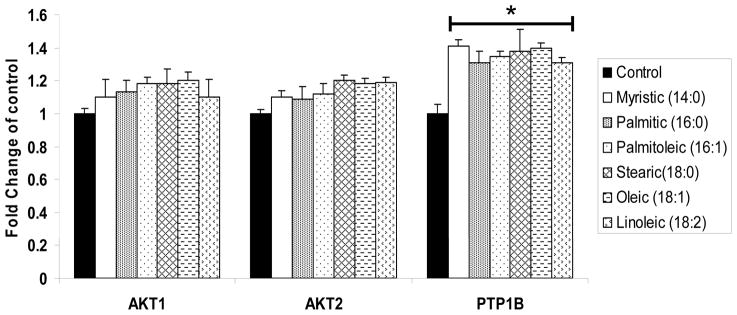
The effects of Fatty acids on AKt 1, AKt 2 and PTP1B mRNA expression.
All FFAs caused significant increases in PTP1B mRNA expression shown as fold induction compared to the control. Data are means±SEM. * p<0.05 vs. control;
Effect of inhibiting AKT phosphorylation on PTP1B phosphorylation
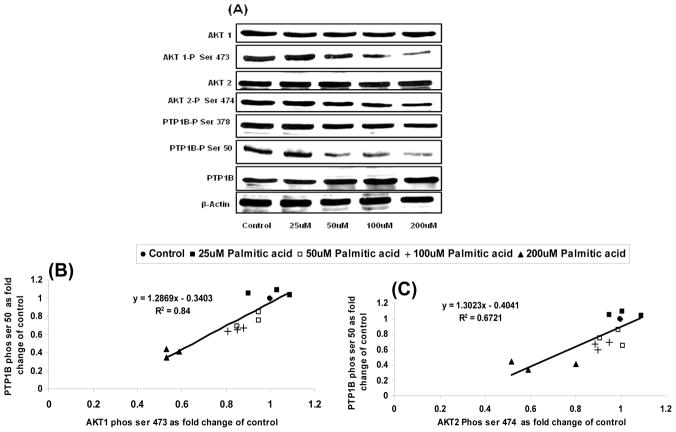
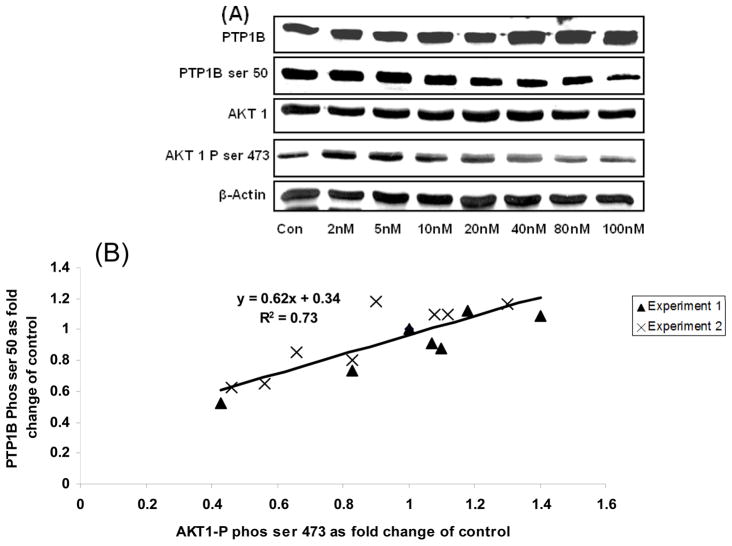
Increasing palmitic acid dose resulted in both a decrease in AKt phosphorylation and increased total PTP1B content. PTP1B phosphorylation at Ser 50 was correlated to a reduction in Akt-1 and 2 phosphorylation (Figure 5B and 5C). The regression coefficient for the correlation between AKt phosphorylation and PTP1B Ser 50 phosphorylation was significant (R=0.84, p<0.05; and R=0.67, p<0.05), for AKt 1 and AKt 2 respectively. Inhibiting AKt phosphorylation using wortmannin also resulted in a decrease in PTP1B Ser 50 phosphorylation (Figure 6; R=0.78;p<0.05). Phosphorylation of PTP1B at Ser 378 and Tyr 172 increased with increased PTP1B protein expression but did not vary with AKt phosphorylation (Figure 3B and 5A). Cells treated with wortmannin at doses above 40nM did increase PTP1B expression but still had significantly reduced PTP1B phosphorylation (Figure 6A).
Figure 5. Effect of varying AKT phosphorylation by Palmitic acid dose (0–200uM) on PTP1B phosphorylation at ser 50.
The effects of a varying dose of palmitic acid on AKt 1, AKt 2 and PTP1B phosphorylation in L6 cells.
As demonstrated, AKt phosphorylation was reduced with increasing palmitic acid dose. Reduction in AKt phosphorylation was accompanied by reduction in PTP1B phosphorylation at Ser 50 despite increased amounts of total PTP1B.
Figure 6. Effect of varying AKT 1 phosphorylation by wortmainin dose (0–100nM) on PTP1B phosphorylation at ser 50.
The effects of a varying dose of Wortamainin on AKt 1 and PTP1B phosphorylation in L6 cells.
AKt phosphorylation was reduced with increasing Wortamannin dose. Reduction in AKt phosphorylation was accompanied by reduction in PTP1B phosphorylation at Ser 50 despite increased amounts of total PTP1B.
PTP1B activity
Treatment with 200uM of each fatty acid irrespective of fatty acid chain length and saturation level significantly increased PTP1B activity 1.28–1.4 fold (p<0.05) in L6 myotubes compared to myotubes treated with BSA only. This increase most likely corresponds to increase in total PTP1B expression levels and phosphorylation at all sites but is not specific to activity towards the insulin receptor (Figure 7).
Figure 7. Change in PTP1B Activity after treatment with FFAs.
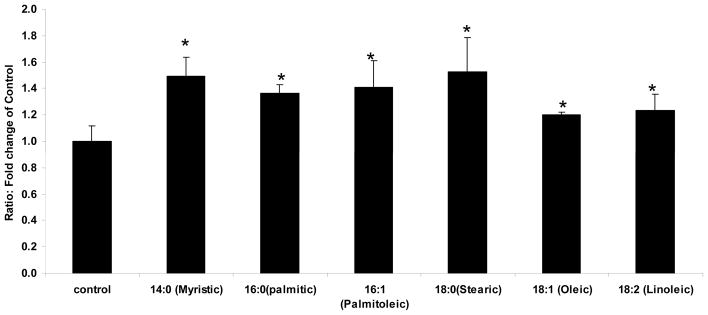
PTP1B activity
As demonstrated, All FFAs significantly increased PTP1B activity. Data are means±SEM. * p<0.05 vs. control; N=18.
Glycogen assay
Saturated fatty acids resulted in a significant decrease in glycogen synthesis (Figure 8). The saturated fatty acid myristic acid and the unsaturated fatty acids did not result in a significant decrease in glycogen synthesis compared to the control even though both formed significant amounts of TAGs and DAGs and resulted in significant overexpression of PTP1B.
Figure 8. Glycogen synthesis on L6 myotubes.
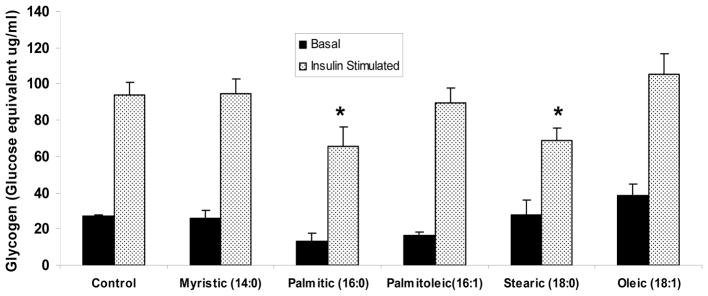
Glycogen synthesis
As demonstrated, only saturated palmitic and stearic acid resulted in a significant reduction in insulin stimulated glycogen synthesis as compared to the control. Data are means ±SEM. * p<0.05 vs. control.
DISCUSSION
In this study, we demonstrate that in L6 myotubes, fatty acids irrespective of saturation level or carbon chain, result in a significant increase in diglycerides (DAGs) and triglycerides (TAGs). Only saturated fatty acids had a significant increase in ceramides and had insulin signaling compromised, confirming the role of ceramides but not DAGs and TAGs in reducing insulin signaling. All FFAs enhanced PTP1B gene expression and protein expression. However in cells treated with unsaturated fatty acids, increased PTP1B levels did not translate into reduced insulin signaling. In the presence of robust AKt phosphorylation, manipulations that increase cellular levels PTP1B did not necessarily produce insulin resistance in our in vitro system. PTP1B had a negative effect on insulin sensitivity only when phosphorylation at Ser 50 was reduced. A clear positive correlation between AKt phosphorylation levels and PTP1B Ser 50 phosphorylation levels and their effect on insulin signaling was established. AKt may phosphorylate PTP1B at Ser 50 making it less effective in dephosphorylating the insulin receptor or inhibit its association with the activated insulin receptor. This is an important finding when considering the role of excess lipid supply in the pathogenesis of insulin resistance and formulation of potential interventions.
There has been great interest in dissecting and understanding the process linking muscle lipid accumulation to defective insulin signaling and many possible mechanisms have been proposed. Much attention has focused on Long Chain Acyl Co-As (LCACoAs), DAGs, TAGs and ceramides as the lipid metabolites involved in insulin resistance because they are elevated in insulin resistance states [1,5] and also because they have been shown to act as ligands for several stress-responsive serine kinases in vitro. DAGs interfere with insulin signaling at the IRS1 step while ceramides are proposed to interfere downstream at the PKB/AKt step [2,4,5,7]. DAGs also activate DAG sensitive PKCs θ and ε. Ceramides and DAGs have been observed to be lowered when insulin sensitivity is enhanced with effects of metformin or exercise in Zucker diabetic fat rats [16]. In this study we quantified ceramides, DAGs and TAGs in L6 cells pretreated with the selected FFAs and explored their role in inducing insulin resistance. It is relevant to note that the concentrations of FFAs used in our experiment appeared to be in line with levels that may be seen physiologically [17,18]. By analyzing cell extracts using gas chromatography coupled with flame ionization detection (GC-FID) we demonstrated that pre-treatment of myotubes with all fatty acids irrespective of carbon chain length or saturation level resulted in a significant increase in DAGs by 30–40% and TAGs by 15–40% compared to the control (Figure 1).
In agreement with Chavez et al [6] our study shows that myristic acid and all the unsaturated acids caused accumulation of DAGs and TAGs but had no adverse effect on insulin signaling and subsequently glycogen synthesis (Figures 3 and 8). This observation is also in agreement with some studies that have disputed the theory purporting that lipid metabolites induce insulin resistance, by showing that genetic manipulations that increase tissue levels of these lipid metabolites do not necessarily produce insulin resistance [19, 20]. It may also explain the observation by Koves et al [1] and Hirabara et al. [3] who showed that impaired insulin-stimulated glucose metabolism elicited by saturated FFAs in skeletal muscle was primarily associated with mitochondrial dysfunction due to mitochondrial rather than cytosolic lipid overload accompanied by incomplete fatty acid oxidation. An et al [19] found that insulin-mediated phosphorylation of AKt and GSK-3 in muscle of high fat fed rats was restored by a genetic maneuver that increased intramuscular levels of TAGs and long chain-CoAs while Liu et al [21] demonstrated that direct upregulation of the TAGs’ synthesis enzyme DGAT1 in muscle of mice resulted in increased intramuscular triglycerides (IMTG) but with improved muscle insulin sensitivity and interpreted this as a consequence of reduced DAGs and ceramides. Other studies have shown that muscles from exercise-trained subjects are highly insulin sensitive despite IMTG levels that are similar or even higher than those found in association with obesity and diabetes [22, 23]. Our results contrast several studies that have pointed towards importance of intermuscular triglycerides (IMTG) as a correlate of insulin resistance [2, 4, 24, 25] and when insulin sensitivity is unaltered by various interventions there is also no change in IMTG [26, 27]. In our in vitro system, our data suggest that while TAGs and DAGs may be useful markers of the level of cytosolic lipid accumulation, they should not be regarded as markers definitively identifying an insulin resistant state. An interesting concept is that increased TAGs may be indicative of a protective mechanism maintaining insulin sensitivity if it is associated with reduction in DAGs and ceramides in skeletal muscle. This is suggested by reports showing resistance of 3T3-L1 adipocytes to the inhibitory effects of palmitate may be proposed to result from their ability to effectively convert fatty acyl-co-As into triglyceride, thus preventing their conversion into other inhibitory metabolites [5].
The adverse effects of palmitate are attributed to its low rate of incorporation into triacylglycerol leading to more accumulation of palmitoyl-CoA, DAG, and/or ceramide because it provides palmotyl Co-A the precussor for ceramides [1]. Using tandemn mass spectrometry we show a consistent increase in ceramide content, with saturated FFAs palmitic acid (16:0) and stearic acid (18:0) (Figure 2). In agreement with work of Chavez and Summers [5] and Chavez et al. [6], the saturated acid myristic acid (14:0) and unsaturated acids palmitoleic (16:1), oleic (18:1) and linoleic (18:2) did not result in significant change in total ceramide content or ceramide profile. Saturated myristic acid (14:0) did not increase ceramides because serine palmitoyl transference (SPT) the enzyme involved in the first step in ceramide synthesis enzyme is highly specific to FFAs with 16 carbons and above. In presence of excess palmitic acid, fatty acyl-CoAs derived from the FFAs are suggested to be diverted away from β-oxidation, and may be preferentially partitioned toward the synthesis of ceramides in an SPT catalysed condensation reaction of palmitoyl CoA and serine or activation of sphingomyelinases under physiological stress [28]. Palmitic acid (16:0) increased total ceramide content 3 fold whereas stearic acid (C18:0) increased ceramide content 2 fold. The ceramides’ level and their effect on AKt appears to be most associated with attenuation in insulin action at the cellular level in skeletal muscle.
In the absence of fatty acids, insulin triggered robust phosphorylation of AKt, a downstream component of the insulin signaling pathway that regulates translocation of the insulin-responsive glucose transporter, GLUT4. AKt activation is dependent on the phosphorylation of two key residues: Thr308 and Ser473. Phosphorylation at Ser473 is necessary for the full activation [29]. Phosphorylation, the attachment of a phosphate moiety to a biological molecule through the action of enzymes (kinases), represents one course by which intracellular signals are propagated resulting in a cellular response. Saturated fatty acids 16:0 and 18:0 caused impairment in AKt phosphorylation (Figure 3) and also changed the ceramide profile with significant increases in ceramides C16 and C18 (Figure 2). Unlike saturated FFAs, the effects of unsaturated FFA on insulin sensitivity are poorly characterized. Some studies suggest improvement in insulin sensitivity by unsaturated fatty acids [8, 10, 12, 30, 31], others report observing no effects [5, 31]. v-3 polyunsaturated fatty acids, have been reported to have positive effects on insulin sensitivity in skeletal muscle [30, 32]. In this study only FFAs that formed ceramides were associated with reduced AKt phosphorylation, reduced PTP1B phosphorylation at Ser 50 (Figure 3) and attenuated insulin-dependent glucose metabolism (Figure 8). We did not observe any deleterious effects of unsaturated FFAs on insulin-dependent glucose metabolism and we observed improved AKt and PTP1B Ser 50 phosphorylation in myristic acid and palmitoleic acid treated cells despite elevated amounts of TAGs and DAGs. There was no difference from the control in cells treated with oleic or linoleic acid. Total AKt remained unchanged with all treatments (Figure 3A). Reducing Akt phosphorylation inactivates the kinase and results in a decrease in insulin sensitivity.
The second part of the study explored effects of the lipid metabolites on PTP1B (PTPN1) expression. Factors responsible for regulating PTP1B expression in different tissues include glucose, leptin, inflammatory cytokines such as TNF (α) and interleukins. FFAs have been reported to induce the expression of PTP1B in liver and muscle. In this study, we have shown that treatment with all FFAs irrespective of saturation level and carbon chain resulted in an increase in mRNA expression and protein level of PTP1B (Figures 3B and 3D and 4) and PTP1B activity in myotubes (Figure 7). These suggest that the metabolites derived from the FFAs alter the transcriptional regulation of PTP1B in the myotubes. Although all lipid metabolites significantly upregulated PTP1B, increased abundance of PTP1B did not translate into negative modulation of insulin signaling in cells treated with unsaturated FFAs and myristic acid which are the FFAs that do not result in the formation of ceramides. Thus, our data suggests that the increased PTP1B expression induced by fatty acids in L6 cells is not related to the degree of fatty acid unsaturation or carbon chain length. The activity and expression of PTP1B were elevated 1.6 to 2.0 fold by treatment with all FFAs. The data showed that PTP1B elevation in the cell per se does not reduce insulin sensitivity unless accompanied by a reduction in Akt phosphorylation (Figure 3A and 3B).
A large body of data from cellular, biochemical, mouse and human genetic and chemical inhibitor studies have identified PTP1B an endoplasmic reticulum associated enzyme as a major negative regulator of both insulin and leptin signaling [33]. While DAGs and TAGs seem not to affect AKt phosphorylation directly, they may be involved in stimulating the accumulation of PTP1B. All FFAs caused accumulation of these metabolites accompanied by significant PTP1B accumulation. PTP1B interacts with and dephosphorylates the activated insulin receptor as well as its substrates insulin receptor (IRS)-1 and (IRS)-2 both in vitro and in intact cells resulting in the downregulation of the signaling pathway [34, 35, 36]. PTP1B exhibits a high activity toward the tyrosine dephosphorylation of IRS-1 as compared with other PTPase enzymes [34,35] and dephosphorylates IRS-1 more readily than the insulin receptor when simultaneously exposed to both proteins as substrates [35,36]. Insulin-stimulated GLUT4 translocation requires a cascade of protein phosphorylations that commence with autophosphorylation of the insulin receptor (IR) tyrosine kinase followed by tyrosine phosphorylation of its immediate substrate IRS-1 [11]. PTP1B may negatively regulate insulin action at the receptor as well as post receptor sites. Coordinated tyrosine phosphorylation is essential for signaling pathways regulated by insulin and leptin. PTPs catalyze the removal of phosphate groups from tyrosine residues and directly oppose the actions of kinases and phosphorylases and therefore play an integral role in many signal transduction pathways (37). PTP1B also targets Jak2 and Stat in the leptin pathway, thereby impeding leptin signals. Mice lacking PTP1B are resistant to both diabetes and obesity [37] and several studies have shown that decreasing the PTP1B protein level by shRNA can enhance the activity of important elements of insulin signaling [7,39]. Mice harboring a disrupted PTP1B gene show increased insulin sensitivity, increased phosphorylation of the insulin receptor and when placed on a high-fat diet, PTP1B −/− mice were resistant to weight gain and remained insulin sensitive. Based on the above, PTP1B is therefore an attractive therapeutic target for the treatment of both Type 2 diabetes and obesity and a huge body of research has been dedicated to finding its inhibitors [38–42].
In this study, overexpression of PTP1B by treatment with free fatty acids did not translate into negative modulation of insulin signaling in cells treated with unsaturated FFAs and myristic acid. These FFAs result in elevated levels of TAGs and DAGs but not ceramides (Figure 2). We therefore concluded that PTP1B elevation in the cell per se does not reduce insulin sensitivity. Insulin sensitivity is affected when PTP1B interacts with the insulin receptor. Our data may suggest that while unsaturated FFAs increase PTP1B, the association of PTP1B with the activated insulin receptor may be prevented by robust Akt phosphorylation levels. This finding may explain why Johnson et al [41] noted that elevated PTP1B activity in obese and T2DM individuals is a point of some controversy, related to the sensitivity of the protein towards oxidative inactivation. Insulin stimulation also causes a significant increase in tyrosine phosphorylation of PTP1B although it is not clear whether this modification activates or inhibits its enzyme activity [42,43]. The overall balance of the phosphorylation state of PTP1B is critical for its counter regulation and effect on signaling [44,45]. Our data shows that while PTP1B is phosphorylated at several sites, only phosphorylation at Ser 50 correlated with phosphorylation of AKt at Ser473 and Ser474 and therefore insulin sensitivity of the cells (Figure 3 and Figure 5). In cells treated with myristic acid and all unsaturated fatty acids, robust AKt phosphorylation was also accompanied by robust PTP1B phosphorylation at ser 50. With saturated 16:0 and 18:0 FFAs, reduced AKt phosphorylation was observed in tandem with reduced PTP1B phosphorylation at ser 50. Varying the magnitude of AKt phosphorylation using palmitic acid dose showed this same trend with Akt and PTP1B ser 50 phosphorylation both being reduced with palmitic acid dose (Figure 5; R=0.84). Inhibiting AKt phosphorylation using wortmainin also resulted in a decrease in PTP1B ser 50 phosphorylation (Figure 6; R=0.73).
Conclusion
In summary, our data confirmed the importance of ceramides but not DAGs and TAGs as a metabolite linking lipid oversupply to the antagonism of insulin signaling and glucose metabolism. DAGs and TAGs had no direct effect on these parameters. Our findings fit with a growing body of evidence that disassociates muscle insulin resistance from glycerolipid and/or LC-CoA content. Collectively, this data indicates that while PTP1B overexpression in a model of muscle insulin resistance can mainly result from high FFA levels, presence of robust PTP1B phosphorylation at Ser 50 may reduce its ability to dephosphorylate the insulin receptor. While a very clear relationship between AKt phosphorylation levels and PTP1B phosphorylation levels were shown, this experiment does not establish a cause and effect relationship between the two parameters. However it is clear that PTP1B overexpression per se may not play a direct role in the causation of insulin resistance.
Acknowledgments
Supported in part by P50AT002776-01 from the National Center for Complementary and Alternative Medicine (NCCAM) and the Office of Dietary Supplements (ODS) which funds the Botanical Research Center of Pennington Biomedical Research Center and the Biotech Center of Rutgers University. Supported in part by the T32AT004094-01A2 Training grant.
Abbreviations
- FFAs
free fatty acids
- PTP1B
protein tyrosine phosphatase 1B
- C14: 0
Myristic acid
- C16:0
palmitic acid
- C16:1
palmitoleic acid
- C18:0
stearic acid
- C18:1
oleic acid
- C18:2
Linoleic acid
- C2 to C24
ceramide C2 to ceramide C24
- TAGs
triglycerides
- DAGs
Diglycerides
- AKt
Protein Kinase B
- PTP1B
Protein Tyrosine Phosphotase 1B
- Ser
serine
- Tyr
Tyrosine
Footnotes
Publisher's Disclaimer: This is a PDF file of an unedited manuscript that has been accepted for publication. As a service to our customers we are providing this early version of the manuscript. The manuscript will undergo copyediting, typesetting, and review of the resulting proof before it is published in its final citable form. Please note that during the production process errors may be discovered which could affect the content, and all legal disclaimers that apply to the journal pertain.
References
- 1.Koves TR, Ussher JR, Noland RC, Slentz D, Mosedale M, Ilkayeva O, et al. Mitochondrial overload and incomplete fatty acid oxidation contribute to skeletal muscle insulin resistance. Cell Metab. 2008;7:45–56. doi: 10.1016/j.cmet.2007.10.013. [DOI] [PubMed] [Google Scholar]
- 2.Kraegen EW, Cooney GJ, Gregory J. Free fatty acids and skeletal muscle insulin resistance. Current Opinion in Lipidology. 2008;9 (3):235–241. doi: 10.1097/01.mol.0000319118.44995.9a. [DOI] [PubMed] [Google Scholar]
- 3.Hirabara SM, Curi R, Maechler P. Saturated fatty acid-induced insulin resistance is associated with mitochondrial dysfunction in skeletal muscle cells. J Cell Physiol. 2010;222:187–194. doi: 10.1002/jcp.21936. [DOI] [PubMed] [Google Scholar]
- 4.Kraegen EW, Cooney GJ, Ye J, Thompson AL. Triglycerides, fatty acids and insulin resistance-hyperinsulinemia. Exp Clin Endocrinol Diabetes. 2001;109(4):516–526. doi: 10.1055/s-2001-15114. [DOI] [PubMed] [Google Scholar]
- 5.Chavez JA, Summers SA. Characterizing the effects of saturated fatty acids on insulin signaling and ceramide and diacylglycerol accumulation in 3T3-L1 adipocytes and C2C12 myotubes. 2003a. Arch Biochem Biophys. 2003;419:101–9. doi: 10.1016/j.abb.2003.08.020. [DOI] [PubMed] [Google Scholar]
- 6.Chavez JA, Knotts TA, Wang LP, Li G, Dobrowsky RT, Florant GL, Summers SA. A role for ceramide, but not diacylglycerol, in the antagonism of insulin signal transduction by saturated fatty acids. J Biol Chem. 2003;13:10297–303. doi: 10.1074/jbc.M212307200. [DOI] [PubMed] [Google Scholar]
- 7.Obanda DN, Hernandez A, Ribnicky D, Yu Y, Zhang XH, Wand ZQ, Cefalu W. Bioactives of Artemisia dracunculus L. mitigate the role of ceramides in attenuating insulin signaling in rat skeletal muscle cells. Diabetes. 2012;61 doi: 10.2337/db11-0396. [DOI] [PMC free article] [PubMed] [Google Scholar]
- 8.Dimopoulos N, Watson M, Sakamoto K, Hundal HS. Differential effects of palmitate and palmitoleate on insulin action and glucose utilization in rat L6 skeletal muscle cells. Biochem J. 2006;399:473–481. doi: 10.1042/BJ20060244. [DOI] [PMC free article] [PubMed] [Google Scholar]
- 9.Krebs M, Roden M. Molecular mechanisms of lipid-induced insulin resistance in muscle, liver and vasculature. Diabetes Obes Metab. 2005;7:621–632. doi: 10.1111/j.1463-1326.2004.00439.x. [DOI] [PubMed] [Google Scholar]
- 10.Sabin MA, Stewart CE, Crowne EC, Turner SJ, Hunt LP, Welsh GI, Grohmann MJ, Holly JM, Shield JP. Fatty acid-induced defects in insulin signalling, in myotubes derived from children, are related to ceramide production from palmitate rather than the accumulation of intramyocellular lipid. J Cell Physiol. 2007;211:244–252. doi: 10.1002/jcp.20922. [DOI] [PubMed] [Google Scholar]
- 11.Morino K, Petersen KF, Shulman GI. Molecular mechanisms of insulin resistance in humans and their potential links with mitochondrial dysfunction. Diabetes. 2006;55 (Suppl 2):S9–S15. doi: 10.2337/db06-S002. [DOI] [PMC free article] [PubMed] [Google Scholar]
- 12.Montell E, Turini M, Marotta M, Roberts M, Noe V, Ciudad CJ, Mace K, Gomez-Foix AM. DAG accumulation from saturated fatty acids desensitizes insulin stimulation of glucose uptake in muscle cells. Am J Physiol. 2001;280:E229–E237. doi: 10.1152/ajpendo.2001.280.2.E229. [DOI] [PubMed] [Google Scholar]
- 13.Powell DJ, Turban S, Gray A, Hajduch E, Hundal HS. Intracellular ceramide synthesis and protein kinase C zeta activation play an essential role in palmitate-induced insulin resistance in rat L6 skeletal muscle cells. Biochem J. 2004;382:619–629. doi: 10.1042/BJ20040139. [DOI] [PMC free article] [PubMed] [Google Scholar]
- 14.Gomez-Lechon MJ, Ponsoda X, Cadtell JV. A microassay for measuring glycogen in 96-well cultured cells. Anal Biochem. 1996;236:296–301. doi: 10.1006/abio.1996.0170. [DOI] [PubMed] [Google Scholar]
- 15.Wang ZQ, Ribnicky D, Zhang XH, Raskin I, Yu Y, Cefalu WT. Bioactives of Artemisia dracunculus L enhance cellular insulin signaling in primary human skeletal muscle culture. Metabolism Clinical and Experimental. 2008;57(Suppl 1):S58–S64. doi: 10.1016/j.metabol.2008.04.003. [DOI] [PMC free article] [PubMed] [Google Scholar]
- 16.Smith AC, Mullen KL, Junkin KA, et al. Metformin and exercise reduce muscle FAT/CD36 and lipid accumulation and blunt the progression of high-fat diet induced hyperglycemia. Am J Physiol Endocrinol Metab. 2007;293:E172–E181. doi: 10.1152/ajpendo.00677.2006. [DOI] [PubMed] [Google Scholar]
- 17.Mathew M, Tay E, Cusi K. Elevated plasma free fatty acids increase cardiovascular risk by inducing plasma biomarkers of endothelial activation, myeloperoxidase and PAI-1 in healthy subjects. Cardiovascular Diabetology. 2010;9:9. doi: 10.1186/1475-2840-9-9. [DOI] [PMC free article] [PubMed] [Google Scholar]
- 18.Frayn KN, Williams CM, Arner P. Are increased plasma non-esterified fatty acid concentrations a risk marker for coronary heart disease and other chronic diseases? Clin Sci (Lond) 1996;90:243–253. doi: 10.1042/cs0900243. [DOI] [PubMed] [Google Scholar]
- 19.An J, Muoio DM, Shiota M, Fujimoto Y, Cline GW, Shulman GI, Koves TR, Stevens R, Millington D, Newgard CB. Hepatic expression of malonyl-CoA decarboxylase reverses muscle, liver and whole animal insulin resistance. Nat Med. 2004;10:268–274. doi: 10.1038/nm995. [DOI] [PubMed] [Google Scholar]
- 20.Monetti M, Levin MC, Watt MJ, Sajan MP, Marmor S, Hubbard BK, Stevens RD, Bain JR, Newgard CB, Farese RV, Sr, et al. Dissociation of hepatic steatosis and insulin resistance in mice overexpressing DGAT in the liver. Cell Metab. 2007;6:69–78. doi: 10.1016/j.cmet.2007.05.005. [DOI] [PubMed] [Google Scholar]
- 21.Liu L, Zhang Y, Chen N, et al. Upregulation of myocellular DGAT1 augments triglyceride synthesis in skeletal muscle and protects against fat-induced insulin reistsnce. J Clin Invest. 2007;117:1679–1689. doi: 10.1172/JCI30565. [DOI] [PMC free article] [PubMed] [Google Scholar]
- 22.Goodpaster BH, He J, Watkins S, Kelley DE. Skeletal muscle lipid content and insulin resistance: evidence for a paradox in endurance-trained athletes. J Clin Endocrinol Metab. 2001;86:5755–5761. doi: 10.1210/jcem.86.12.8075. [DOI] [PubMed] [Google Scholar]
- 23.Bruce CR, Kriketos AD, Cooney GJ, Hawley JA. Disassociation of muscle triglyceride content and insulin sensitivity after exercise training in patients with Type 2 diabetes. Diabetologia. 2004;47:23–30. doi: 10.1007/s00125-003-1265-7. [DOI] [PubMed] [Google Scholar]
- 24.Jazet IM, Schaart G, Gastaldelli A, et al. Loss of 50% of excess weight using a very low energy diet improves insulin-stimulated glucose disposal and skeletal muscle insulin signaling in obese insulin-treated type 2 diabetic patients. Diabetologia. 2008;51:309–319. doi: 10.1007/s00125-007-0862-2. [DOI] [PubMed] [Google Scholar]
- 25.Lara-Castro C, Newcomer BR, Rowell L, et al. Effects of short term very low calerie diet on intramyocellular lipid and insulin sensitivity in nondiabetic and type 2 diabetic subjects. Metab Clin Exp. 2008;57:1–8. doi: 10.1016/j.metabol.2007.05.008. [DOI] [PMC free article] [PubMed] [Google Scholar]
- 26.Bajaj M, Madina-Navarro R, Suraamornkul S, et al. Paradoxical changes in muscle gene expression in insulin–resistant subjects after sustained reduction in plasma free fatty acid concentration. Diabetes. 2007;56:743–752. doi: 10.2337/db06-0840. [DOI] [PubMed] [Google Scholar]
- 27.Lê KA, Faeh D, Stettler R, et al. A 4-wk high fructose diet alters lipid metabolism without affecting insulin sensitivity or ectopic lipids in healthy humans. Am J Clin Nutr. 2006;84:1374–1379. doi: 10.1093/ajcn/84.6.1374. [DOI] [PubMed] [Google Scholar]
- 28.Summers SA. Ceramides in insulin resistance and lipotoxicity. Progress in Lipid Research. 2006;45 (1):42–72. doi: 10.1016/j.plipres.2005.11.002. [DOI] [PubMed] [Google Scholar]
- 29.Wadley GD, Konstantopoulos N, Macaulay L, Howlett KF, Garnham A, Hargreaves M, Cameron-Smith D. Increased insulin-stimulated AKt pSer473 and cytosolic SHP2 protein abundance in human skeletal muscle following acute exercise and short-term training. J Appl Physiol. 2007;102(4):1624–31. doi: 10.1152/japplphysiol.00821.2006. [DOI] [PubMed] [Google Scholar]
- 30.Gingras AA, White PJ, Chouinard PY, Julien P, Davis TA, Dombrowski L, Couture Y, Dubreuil Long-chain omega-3 fatty acids regulate bovine whole-body protein metabolism by promoting muscle insulin signalling to the AKt-mTOR-S6K1 pathway and insulin sensitivity. J Physiol. 2007;579:269–284. doi: 10.1113/jphysiol.2006.121079. [DOI] [PMC free article] [PubMed] [Google Scholar]
- 31.Lee JS, Pinnamaneni SK, Eo SJ, Cho IH, Pyo JH, Kim CK, Sinclair AJ, Febbraio MA, Watt MJ. Saturated, but not n-6 polyunsaturated, fatty acids induce insulin resistance: Role of intramuscular accumulation of lipid metabolites. J Appl Physiol. 2006;100:1467–1474. doi: 10.1152/japplphysiol.01438.2005. [DOI] [PubMed] [Google Scholar]
- 32.Storlien LH, Hulbert AJ, Else PL. Polyunsaturated fatty acids, membrane function and metabolic diseases such as diabetes and obesity. Curr Opin Clin Nutr Metab Care. 1998;1:559–56. doi: 10.1097/00075197-199811000-00014. [DOI] [PubMed] [Google Scholar]
- 33.Zhang Zhong-Yin, Lee Seung-Yub. PTP1B inhibitors as potential therapeutics in the treatment of Type 2 diabetes and obesity. Expert Opinion on Investigational Drugs. 2003;12 (2):223–233. doi: 10.1517/13543784.12.2.223. [DOI] [PubMed] [Google Scholar]
- 34.Goldstein BJ, Bittner-Kowalczyk A, White MF, et al. Tyrosine dephosphorylation and deactivation of insulin receptor substrate-1 by protein phosphatase 1B. Possible facilitation by the formation of a ternary complex with the GRB2 adaptor protein. J Biol Chem. 2000;275:4283. doi: 10.1074/jbc.275.6.4283. [DOI] [PubMed] [Google Scholar]
- 35.Goldstein B. Protein-tyrosine phosphatase 1B (PTP1B): a novel therapeutic target for type 2 diabetes mellitus, obesity and related states of insulin resistance. Current drug targets Immune endocrine and metabolic disorders. 2001;1(3):265–275. doi: 10.2174/1568008013341163. [DOI] [PubMed] [Google Scholar]
- 36.Taghvaei NM, Meshkani R, Taghikhani M, Larijani B, Adeli K. Palmitate Enhances Protein Tyrosine Phosphatase 1B (PTP1B) Gene Expression at Transcriptional Level in C2C12 Skeletal Muscle Cells. Inflammation. 2011;34:1. doi: 10.1007/s10753-010-9206-3. [DOI] [PubMed] [Google Scholar]
- 37.Calera MR, Vallega G, Pilch PF. Dynamics of protein-tyrosine phosphatases in rat adipocytes. J Biol Chem. 2000;275:6308. doi: 10.1074/jbc.275.9.6308. [DOI] [PubMed] [Google Scholar]
- 38.Seely BL, Staubs PA, Reichart DR, et al. Protein tyrosine phosphatase 1B interacts with the activated insulin receptor. Diabetes. 1996;45:1379. doi: 10.2337/diab.45.10.1379. [DOI] [PubMed] [Google Scholar]
- 39.Jiang G, Zhang BB, Moller DE. Diabetes Mellitus: A Fundamental and Clinical Text. 3. Chapter 84. Lippincott Williams & Wilkins; 2004. New Therapies to Promote Insulin Action. [Google Scholar]
- 40.Bakhtiyari S, Meshkani R, Taghikhani M, Larijani B, Adeli K. Protein tyrosine phosphatase-1B (PTP-1B) knockdown improves palmitate-induced insulin resistance in C2C12 skeletal muscle cells. Lipids. 2010;45(3):237–244. doi: 10.1007/s11745-010-3394-3. [DOI] [PubMed] [Google Scholar]
- 41.Johnson TO, Ermolieff J, Jirousek MR. Protein tyrosine phosphatase 1B inhibitors for diabetes. Nature Reviews Drug Discovery. 2002;1:696–709. doi: 10.1038/nrd895. [DOI] [PubMed] [Google Scholar]
- 42.Bhanot S, Monia BP, Geary RS, Kjems LL. Antisense modulation of PTP1B expression. US2009/0036355 A1. US Patent No. 2009
- 43.Bandyopadhyay D, Kusari A, Kenner KA, et al. Protein-tyrosine phosphatase 1B complexes with the insulin receptor in vivo and is tyrosine-phosphorylated in the presence of insulin. J Biol Chem. 1997;272:1639. doi: 10.1074/jbc.272.3.1639. [DOI] [PubMed] [Google Scholar]
- 44.Dadke S, Kusari A, Kusari J. Phosphorylation and activation of protein tyrosine phosphatase (PTP) 1B by insulin receptor. Mol Cell Biochem. 2001;221:147. doi: 10.1023/a:1010909031310. [DOI] [PubMed] [Google Scholar]
- 45.Ravichanran LV, Chen H, LI Y, Quon MJ. Phosphorylation of PTP1B at Ser(50) by AKt impairs its ability to dephosphorylate the insulin receptor. Mol Endocrinol. 2001;15 (10):1768–80. doi: 10.1210/mend.15.10.0711. [DOI] [PubMed] [Google Scholar]


