

Abstract
Purpose
To show the feasibility of using magnetic resonance imaging (MRI) to quantify superparamagnetic iron oxide (SPIO)-labeled cells.
Materials and Methods
Lymphocytes and 9L rat gliosarcoma cells were labeled with Ferumoxides-Protamine Sulfate complex (FE-PRO). Cells were labeled efficiently (more than 95%) and iron concentration inside each cell was measured by spectrophotometry (4.77-30.21 picograms). Phantom tubes containing different number of labeled or unlabeled cells as well as different concentrations of FE-PRO were made. In addition, labeled and unlabeled cells were injected into fresh and fixed rat brains.
Results
Cellular viability and proliferation of labeled and unlabeled cells were shown to be similar. T2-weighted images were acquired using 7 T and 3 T MRI systems and R2 maps of the tubes containing cells, free FE-PRO, and brains were made. There was a strong linear correlation between R2 values and labeled cell numbers but the regression lines were different for the lymphocytes and gliosarcoma cells. Similarly, there was strong correlation between R2 values and free iron. However, free iron had higher R2 values than the labeled cells for the same concentration of iron.
Conclusion
Our data indicated that in vivo quantification of labeled cells can be done by careful consideration of different factors and specific control groups.
Keywords: Magnetic Resonance Imaging (MRI), Magnetically Labeled Cells, Quantification, Reproducibility, Superparamagnetic Iron Oxide (SPIO)
INTRODUCTION
In recent years, numerous studies have been published on the use of different contrast agents for cell labeling and tracking by magnetic resonance imaging (MRI). These studies demonstrate that superparamagnetic iron oxides (SPIO) particles are taken up by cells 1-8. T lymphocytes 9, dendritic cells 10, monocytes 11,12, cancer cells 5,13, and most importantly stem cells 14,15 are the labeled cells used the most in different studies. The majority of the initial studies examined a large number of cells (105-106 cells) 3. Recent studies moved towards detection of small number of cells or even single cells, to open a new window in cell biology utilizing non-invasive in vivo MRI studies. Hoehn et al 16 demonstrated an in vivo detection limit of 500 stem cells implanted in the rat brain. Dahnke and Schaeffter 17 predicted the detection limit to be 600 labeled cells per voxel in the brain and 28000 labeled cells per voxel in the liver, using 3T MRI. Kircher et al 18 showed that as few as 3 SPIO-labeled cytotoxic lymphocytes/voxel could be detected at 8.5 Tesla in a tumor of the live mice. Single SPIO-labeled cells were observed in vitro studies at high field strength (7 T) 14,19,20.
There are studies that compare the effect of intracellular versus free iron 21-23 on cellular MRI for different-cell types7,24. In spite of these studies, the detection threshold for different SPIO-labeled cells and the parameters that affect it have not been explicitly determined. Finally, quantitative models have not been developed for estimating the number of incorporated cells in different tissue types. The purpose of this study was to further study MRI for detection and quantitation of different labeled cells. In particular, this work has focused on the feasibility of estimating the number of labeled cells using MRI, comparing MRI parameters of different labeled cells, as well as the reproducibility of the results.
MATERIALS AND METHODS
Cell Preparation
Rat Gliosarcoma Cells (9L)
9L rat gliosarcoma cells (generous gift from Dr. Stephen Brown’s lab) were cultured in 75 cm2 tissue culture flasks with Dulbecco’s Modified Eagles Medium (DMEM) supplemented with 10% fetal bovine serum, penicillin (100 IU/ml), and streptomycin (100 μg/ml), until they were 80-90% confluent. The media was changed every two days. 10 flasks were prepared, 5 for unlabeled control cells and 5 for labeled cells. Cells were prepared 3 different times with the same method.
Non-adherent Human Lymphocytes
Fresh whole blood was obtained from the American Red Cross from healthy donors. Blood remaining in apheresis columns was used for our purpose. Blood was collected in heparinized tubes. The blood was diluted 1:2 in phosphate buffered saline (PBS), layered onto lymphocyte separation medium (Ficoll, density 1.077 g/ml, ICN Biomedicals, Aurora, OH) and centrifuged for 30 minutes at 1,700 RPM, and at a temperature of 20°C (35 ml blood was very gently added onto 15 ml lymphocyte separation medium in every 50 ml sterile tube). Then the white ring fraction (mononuclear cell layer) was transferred to a new 50 ml tube using a sterile pasteur pipette, PBS was added and the solution was centrifuged for 10 minutes at 1,400 RPM at room temperature. After discarding the supernatant, the pellet was resuspended in 4 ml ACK lysing buffer to get rid of the remaining erythrocytes. Cells were incubated in the ACK lysing buffer for no more than 3 minutes on ice. After 3 minutes 20 ml PBS was added to the solution, the cells were washed twice (centrifuge at 1200 RPM), resuspended in DMEM with 10% fetal bovine serum, penicillin (100 IU/mL), and streptomycin (100 μg/mL) and were transferred to a 75 cm2 tissue culture flasks for overnight culture. The non-adherent cells were separated and collected for our study. We collected the floating cells and subjected them to FACS analysis to determine the percent of cells showing CD3 (T-lymphocytes) and CD14 (monocyte-macropahges) positive markers. We placed the gate to include all the cells except the very small cells that remain below the size of lymphocytes population (could be dead cells, debri, or platelets). Our analysis indicated that there were over 45% of T-cells (CD3 positive) and only about 7% of monocyte-macrophage lineages (CD14 positive). The rest of the cell could be B lymphocytes and other cells. Lymphocytes were prepared 3 different times with the same method.
Cell Labeling
Cells were labeled with a Ferumoxides-Protamine Sulfate complex (FE-PRO). The commercially available ferumoxides suspension (Feridex IV, Berlex Laboratories, Wayne, NJ) contains particles approximately 80 to 150 nm in size and has a total iron concentration of 11.2 mg/ml (11.2 μg/μl). Protamine sulfate (American pharmaceuticals partners, shaumburg, IL) supplied at 10 mg/ml, was prepared as a fresh stock solution of 1 mg/ml in distilled water at the time of use. Ferumoxides, at a concentration of 100 μg/ml was put in a tube containing serum free RPMI 1,640 medium (Mediatech, Herndon, VA) supplemented with MEM nonessential amino acid, and sodium pyruvate. Protamine sulfate was then added to the solution at 4.5 μg/ml. The solution containing ferumoxides and protamine sulfate was mixed for 3-5 minutes with intermittent hand shakings. Old media in culture flasks of adherent cells (9L rat gliosarcoma cells) was replaced by 10 ml solution containing the FE-PRO complex. Cells grown in suspension (human lymphocytes) were resuspended in the FE-PRO complex (10 ml) at 4 ×10⁶ cells/ml. Flasks were incubated for 2 hours after which time equal volumes of the complete medium were added to the cells for a final concentration of 50 μg ferumoxides/ml and 2.25 μg protamine sulfate/ml of medium. The cell suspension and adherent cells were then incubated overnight (37°C in a 5% CO2 humidified atmosphere). Adherent labeled cells (Rat 9L gliosarcoma) were trypsinized, washed 3 times with PBS to dispose of extra FE-PRO complex in solution, and resuspended at 4 × 10⁶ cell/ml concentration. Unlabeled control cells were also trypsinized, washed and resuspended at 4 × 10⁶ cell/ml concentration. Cells were counted with a counting chamber (hemocytometer). Since cells were prepared at 3 different times, cell labeling was also repeated 3 times for each cell type.
Staining for Intracellular Iron
After incubation with FE-PRO complex overnight, one flask from each labeled group (9L rat gliosarcoma and lymphocytes) was washed 3 times to remove extra FE-PRO complex, trypsinized (for adherent cells) and transferred to slides. Slides were fixed with 4% paraformaldehyde. Prussian blue (with or without DAB enhancement) staining was performed using a mixture of 4% potassium ferrocyanide and 3.7% hydrochloric acid. After incubating for 30 minutes, slides were washed and counter stained with nuclear fast red. The cells were evaluated using a microscope to determine the efficiency of labeling. Any cells that showed blue or brown particles inside were considered labeled (see Figure 1).
Figure 1.
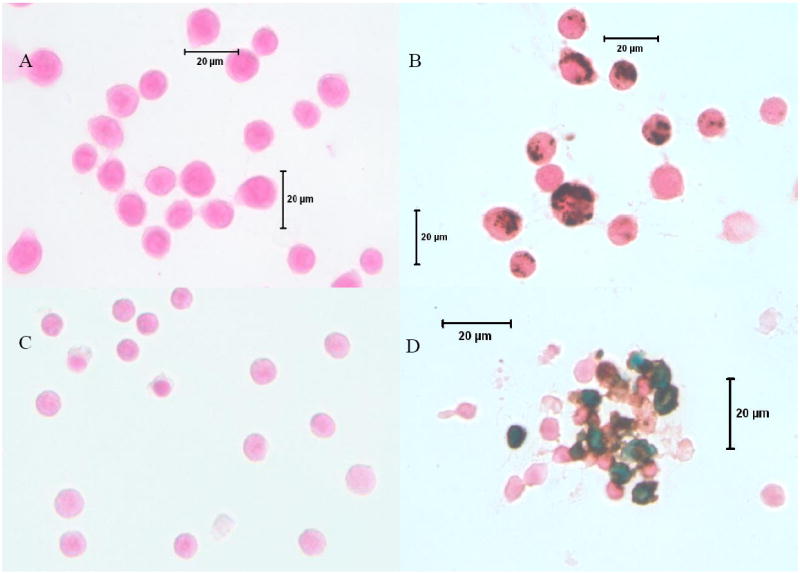
Microphotography of DAB-enhanced Prussian blue stained labeled and unlabeled gliosarcoma and lymphocytes. A) Unlabeled gliosarcoma cells, 40X. B) Labeled gliosarcoma cells, 40X. C) Unlabeled lymphocytes, 40X. D) Labeled lymphocytes 40X. Note the clean preparation of the labeled cells. There are no free iron particles seen away from the cells. However, a few particles are seen attached to the cell membrane especially on lymphocytes. Gliosarcoma cells are 11-15 μm and lymphocytes are 6-8 μm in sizes.
Cellular Viability and Proliferation Capacity
Cellular viability and proliferation of labeled and unlabeled cells were evaluated using the trypan blue dye exclusion test and the MTT (3-[4,5-dimethylthiazol-2-yl]-2,5-diphenyl tetrazolium bromide) assay (Roche Molecular Biochemicals, Indianapolis, IN) at different time points. The same numbers of labeled and unlabeled rat gliosarcoma cells (9L) and lymphocytes were exposed to trypan blue dye (1×10⁶) and the relative number of non-stained viable cells to the number of stain non-viable cells was calculated. For MTT, after labeling and washing, a specific number of unlabeled (control) and FE-PRO labeled cells were allowed to grow in 96-well plates and the MTT assay was performed at specific time intervals. The absorbance of the formazan product was then measured at a wavelength of 570 nm with 750 nm (subtracted) as reference.
Labeling Efficiency
DAB enhanced Perussian blue stained cells were evaluated by light microscope (40X) to see the labeling efficiency. Cells were considered Prussian blue positive if intracytoplasmic blue or brown granules could be detected. The percentage of labeled cells was determined from the average of the labeled cells to the total number of cells from randomly selected 4-5 field of views.
Cellular Iron Quantification
After labeling, cells were washed 3 times with PBS to dispose extra FE-PRO complex (iron) in solution. Three tubes from each group of labeled and unlabeled cells: glioscarcoma cells, and lymphocytes containing 5 × 10⁵ cells each, were centrifuged at 3,000 RPM for 5 minutes. After discarding the supernatant, 0.5 ml hydrochloric acid (5M) was added to all of the tubes and kept at room temperature for one hour. The microcentrifuge tubes were centrifuged again at 3,000 RPM for 5 minutes and supernatants were collected in a 1.5 ml micro cuvettes, 0.5 ml of freshly prepared 5% potassium ferrocyanide solution was added to each cuvette and were kept for 30 minutes in the dark. After 30 minutes, the absorbance was measured at 700 nm using a UV-VIS Spectrophotometer (Shimadzu, Japan). For unlabeled cells, all steps were the same and the spectrophotometry was done at the same wavelength. The average absorbance of each sample (three tubes for each sample) was divided by the number of cells per ml to determine the iron concentration per cell for both labeled and unlabeled cells. Iron concentration was determined by normalizing the obtained absorbance with a previously prepared standard curve. To generate the standard curve, sample tubes containing iron from 0.25 to 12μg/ml were prepared. Then 0.5 ml hydrochloric acid (5M) was added in each tube. After one hour incubation at room temperature, 0.5 ml 5% potassium ferrocyanide was added and incubated for 30 minutes in the dark. The absorbance was read at 700 nm and the standard curve created for normalization of measured iron in cells.
Phantom Preparation
All cells (labeled and unlabeled gliosarcoma, labeled and unlabeled lymphocytes) were counted and put in NMR tubes (tubes with no magnetic effects) from 7.5×10³ to 2×10⁶ cells in 1 ml PBS. Then the cells were mixed thoroughly with 1 ml 8% gelatin in the tubes and quickly (after a short delay to let the bubbles rise) solidified in ice. The final concentration of cells was 3.75 × 10³ to 1 × 10⁶ per ml, which corresponded to 0.1125 to 30 μg (for gliosarcoma) and 0.0255 to 6.8 μg (for lymphocytes) iron per tube. Phantoms were also made by mixing free ferumoxides with gelatin to match the corresponding iron concentration in each tube containing labeled cells. For each experiment, the iron concentration was measured first from the labeled cells. Based on the measured iron concentration per cell in each batch, we made the phantoms from the labeled cells and the free iron oxides. Thus, in each experimental setting, the concentration of iron in the phantoms (amount of iron in the voxel) was identical for the corresponding free and intracellular iron phantoms.
Brain Preparation
Rat brains were collected from other ongoing animal user committee approved protocols with the permission of the principal investigator of the protocol. Usually, the following methods were applied during the collection of rat brains. Fisher adult rats (n=3) with a mean weight of 250 g were put in CO2 chamber for 2 to 3 minutes and euthanized. Chests were opened and the auricles were cut. 100 ml phosphate buffer saline (PBS) was injected directly to the left ventricle. The skulls were removed and the brains were separated from all attachments with a surgical scissor. Brains were put in phosphate buffer saline.
Labeled Cell Injection inside Brain
Freshly prepared labeled gliosarcoma cells were injected in the rat brains. Different concentrations of labeled cells, ranging from 2×10³ to 2×10⁷ per ml, were prepared. Brains were placed on a stereotatic device (Model 902, Kopf Instruments, Tujunga, CA) and different number of cells (1×10² to 1×10⁵) in 2 μl fluid were injected with a micro injector needle about 3.5 mm deep into the left side of the brain from anterior to posterior direction, respectively. Just before injection, the needle was pulled back 1 mm and the cells were administered at a rate of 0.5 μl per 2 minutes to prevent reflux. Similar procedures were repeated for unlabeled gliosarcoma cells but on the opposite side (right brain). After injections, the brains were fixed in 3% paraformaldehyde and 3% sucrose.
Magnetic Resonance Imaging (MRI)
MRI was performed with a whole body 3 T (Signa Excite, GE Medical Systems, Milwaukee, WI) and a 20 cm bore superconducting magnet 7 T (Magnex Scientific, Abingdon, UK) interfaced to a BRUKER console (Billerica, MA). T2-weighted images were obtained to create R2 maps. For the brain studies, FIESTA images were also acquired using the 3 T MRI systems.
For the phantoms, the following parameters were used to acquire T2-weighted images with the 7 T system: TR = 1,000 ms, TE = 15, 30, 45, 60, 75, 90, 105, and 120 ms using a 128 × 128 matrix, FOV = 40 mm, and voxel = 1.95 × 10⁻⁴ cm3. A custom built animal head coil (5 cm diameter) was used to acquire the images. Multi-echo T2-weighted images were also acquired with the 3 T system using the following parameters: TR = 1,500 ms, TE = 15, 30, 45, and 60 ms using a 128 × 128 matrix, FOV = 30 mm, NEX = 2, and voxel = 1.1 × 10⁻⁴ cm3. A wrist coil (10 cm diameter) was used to acquire the images. Effective slice thickness was 2 mm for both of the 3 T and 7 T systems and 10 slices were imaged for each tube.
For the rat brains, they were fixed and put in 20 ml syringes, filled with perfluoropolyether (Ausimont, Thorofare, NJ), cleared of all air bubbles from the syringe and images were obtained using both 3 T and 7 T systems. A T2-weighted spin-echo sequence was applied along the short axis of the brain using the following imaging parameters: for the 7 T system: TR = 3,000 ms, TE = 12, 18, 24, and 36 ms using a 128 × 128 matrix, FOV = 40 mm, and voxel = 1.95 × 10⁻⁴ cm3; For the 3 T system: TR = 1,500 ms, TE = 15, 30, 45, and 60 ms using a 256 × 192 matrix, FOV = 30 mm, NEX = 2, and voxel = 1.1 × 10⁻⁴ cm3. Effective slice thickness was 2 mm for both 3 T and 7 T protocols and 10 slices were imaged for each brain. The FIESTA images were also obtained with the following parameters: TR = 12.3 ms, TE = 2.9 ms using a 128 × 128 matrix, FOV = 6 cm, NEX = 4, and slice thickness = 0.5 mm with no spacing. Rat brains were imaged before and after injection of the cells to rule out any artifacts.
Image Processing
R2 maps were calculated from the T2-weighted images of the tubes. Mean signal intensities and mean R2 values were measured in 3 different slices within a region of interest (ROI). The ROI size was fixed (317 pixels) for all of the analysis but due to different FOV for the 3 and 7 T systems, the voxel sizes were not the same. The mean values of T2 in the ROI (in seconds) of all tubes, were inverted to estimate the R2 values (per second).
To generate the T2 maps, the MR images were exported as DICOM images from 3 T and as Bruker images from the 7 T to a personal computer. Eigentool image analysis software (Henry Ford Health System, Detroit, MI) was used to perform the image analysis. Eigentool has a comprehensive set of functions for displaying, restoring, enhancing, and analyzing images (21,22) 25,26. R2 maps were calculated as the reciprocal of the negative slope of the logarithms of the T2-weighted images (see Figure 2). Care was taken to analyze only data with high signal-to-noise ratio (SNR). A standard deviation more than 10% of the mean was not accepted. The same method was used for the rat brains except that an irregular ROI was used to show the area of the injected labeled cells. The percentage of change in the R2 value (ΔR2) was calculated using the equation:
where R2, labeled is the R2 value of the injected labeled cells and R2, normal is the R2 value of the normal brain.
Figure 2.
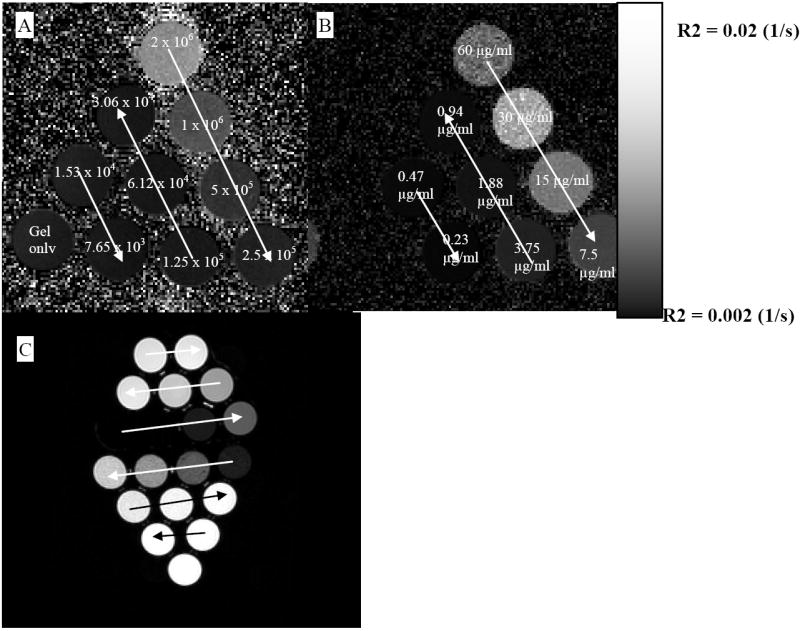
R2 and T2-weighted images of different phantoms. A) R2 maps for gliosarcoma cells using 7 T MRI; number of cells decreases following the arrows. B) R2 maps for the free iron in gelatin using 7 T MRI; concentration of iron decreases following the arrows. C) T2-weighted image of the gliosarcoma cells using 3 T MRI; concentration decreases following the arrows; upper part free iron, lower part labeled lymphocytes.
Evaluation of Reproducibility
To show the reproducibility of the results, for the phantom studies (labeled gliosarcoma cells, lymphocytes, and free iron), the phantoms were made 3 separate occasions and MRI was obtained (both 3 T and 7 T) the day after preparation. Linear regression analysis was performed to compare the correlation between the numbers of the labeled cells and the corresponding R2 values. P-values less than 0.05 were considered to indicate a statistically significant difference. The student’s t-test was performed to compare differences between the means. Statistical analysis was done using SPSS software (version 10, Chicago, Illinois). Bland-Altman plot was used to show the agreement between different data (different measurements).
RESULTS
Cell Growth and Viability
Cell division and viability were unaltered after labeling with Fe-PRO complexes (See Table 1). Both labeled and unlabeled 9L and lymphocytes grew symmetrically. There was no significant change in cell viability. Both labeled and unlabeled cells showed more than 98% viable cells from day 1 to day 5. Proliferative activity of labeled gliosarcoma cells and lymphocytes showed no significant changes in the MTT proliferative assay compared with that of the corresponding unlabeled cells at different days (day 7 for gliosarcoma cells and day 3 for lymphocytes) after labeling. The measured optical density for the labeled and unlabeled gliosarcoma were 1.825±0.081 and 1.761±0.066, respectively. The measured optical density for the labeled and unlabeled lymphocytes were 0.577±0.019 and 0.532±0.004, respectively.
Table 1.
Viability and division comparison for labeled and unlabeled rat gliosarcoma cells (9L).
| Labeled Cells | Unlabeled Cells | |||||
|---|---|---|---|---|---|---|
| Days after labeling | viable | Non-viable | % Dead | viable | Non-viable | % Dead |
| Day 1 | 8.4 × 10⁶ | 1 × 10⁵ | 1.19 | 8.6 × 10⁶ | 5 × 10⁴ | 0.58 |
| Day 3 | 20.4 × 10⁶ | 2 × 10⁵ | 0.98 | 20.2 × 10⁶ | 2 × 10⁵ | 0.99 |
| Day 5 | 36.3 × 10⁶ | 2.8 × 10⁵ | 0.77 | 36.4 × 10⁶ | 2.7 × 10⁵ | 0.11 |
Efficiency of Labeling
More than 95% of the cells (gliosarcoma and lymphocytes) were labeled. There was a significant difference between the 9L and lymphocytes sizes. The average size of the 9L cells was 11-15 μm whereas for the lymphocytes it was 6-8 μm (Figure 1).
Intracellular Iron Concentration (Quantification)
Depending on the percent of confluency and days in culture, the measured intracellular iron in the 9L cells varied from 20.46pg to 30.21pg per cell. However, iron in the labeled lymphocytes did not vary as much because of consistent conditions during labeling; the measured intracellular iron was in the range of 4.77pg to 6.80pg per cell.
Labeled and Unlabeled Cells
Figure 2 shows the R2 maps and T2-weighted images of phantoms made from labeled cells and free iron oxides. Both of the maps and the T2-weighted images show dose dependent changes. All types of labeled cells (in repeating studies) showed significantly different R2 values compared to those of the unlabeled control cells (P-value=0.039657). Figure 3 shows the representative lymphocytes data. The difference between the R2 values of the labeled and unlabeled cells increases as the number of cells increases.
Figure 3.
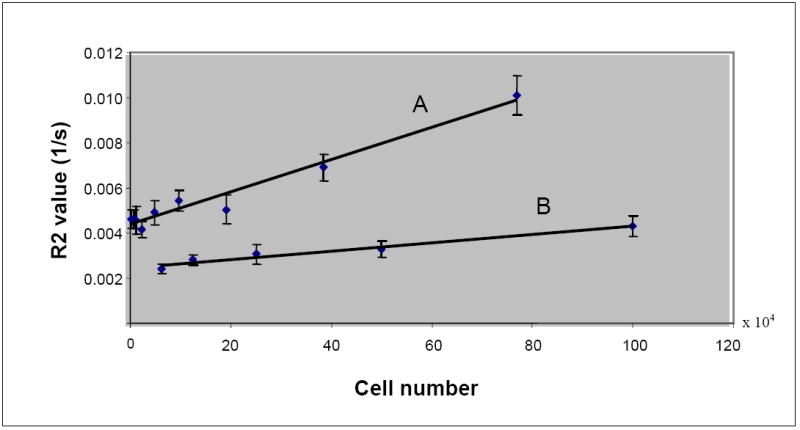
Difference in the R2 values of labeled and unlabeled lymphocytes. Regression line A: labeled lymphocytes, y = 7.1639E-09x + 4.3762E-03, R2 = 0.9634; Regression line B: unlabeled lymphocytes, y = 1.8345E-09x + 2.4616E-03, R2 = 0.9635.
R2 Maps of Labeled Cells
Figure 4A illustrates the effect of increasing number of labeled cells on the R2 values and the R2 differences between the labeled lymphocytes and gliosarcoma cells. Note the linear correlation between the number of labeled cells and the R2 value (R2 = 0.9998) Despite linear correlation between the R2 values and cell numbers, there is a significant difference in the R2 values of lymphocytes and gliosarcoma cells for an equal number of labeled cells (P-value = 0.000691). R2 values of gliosarcoma cells are about twice that of the lymphocytes at each cellular concentration. Our data do not show significant difference between R2 values calculated using 3 T and 7 T (P-value=0.493425).
Figure 4.
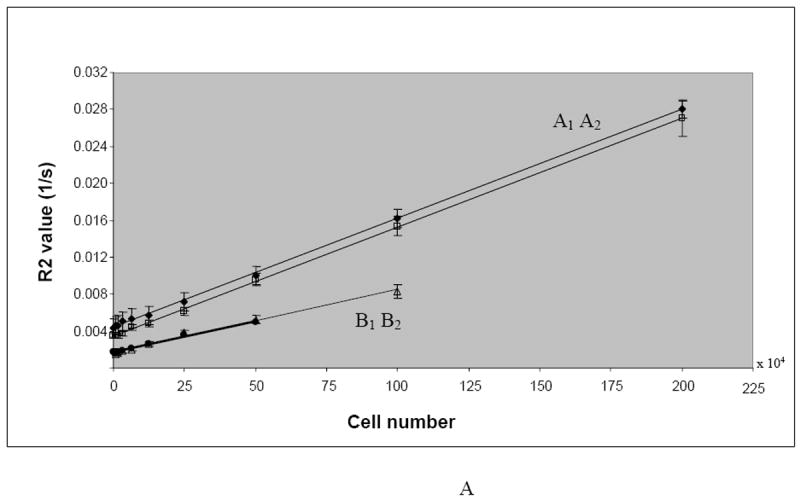
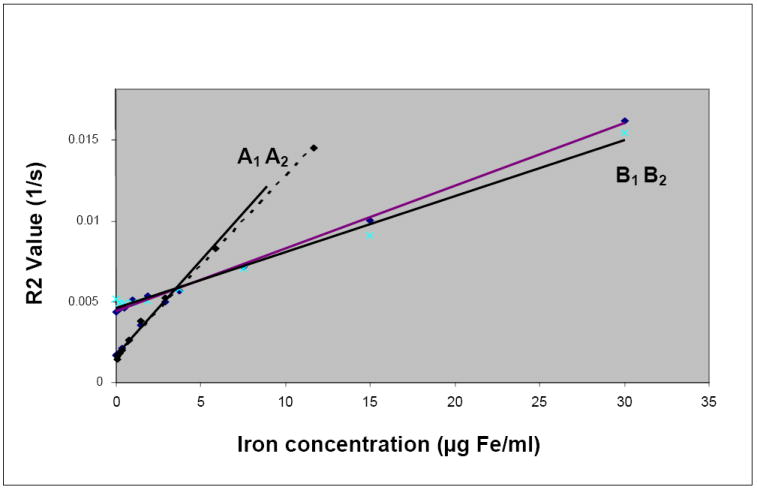
A. Increase in the R2 values as a function of the number of labeled cells (intracellular iron, cell/ml).
Regression line A1: labeled gliosarcoma cells (R2 values for 7 T), y = 1E-08x + 0.0034, R2 = 0.9995; Regression line A2: labeled gliosarcoma cells (R2 values for 3 T), y = 1E-08x + 0.0044, R2 = 0.9994; Regression line B1: labeled lymphocytes (R2 values for 7 T), y = 7E-09x + 0.0017, R2 = 0.9912; Regression line B2: labeled lymphocytes (R2 values for 3 T), y = 7E-09x + 0.0017, R2 = 0.9949.
B. Lymphocytes Study: Positive correlations of R2 values and iron concentrations (intracellular and free iron) in gelatin and significant difference between the iron effect on R2 values when iron is inside or outside the cell (P-value = 0.000548). All values are for lymphocytes with 5.8 picogram iron per cell.
Regression line A: extracellular iron (7 T), y = 0.0026x + 0.0016, R2 = 0.9992;
Regression line B: extracellular iron (3 T), y = 0.0021x + 0.0034, R2 = 0.9647;
Regression line C: Intracellular iron (7 T), y = 0.0011x + 0.0017, R2 = 0.9966;
Regression line D: Intracellular iron (3 T), y = 0.0012x + 0.0017, R2 = 0.9949.
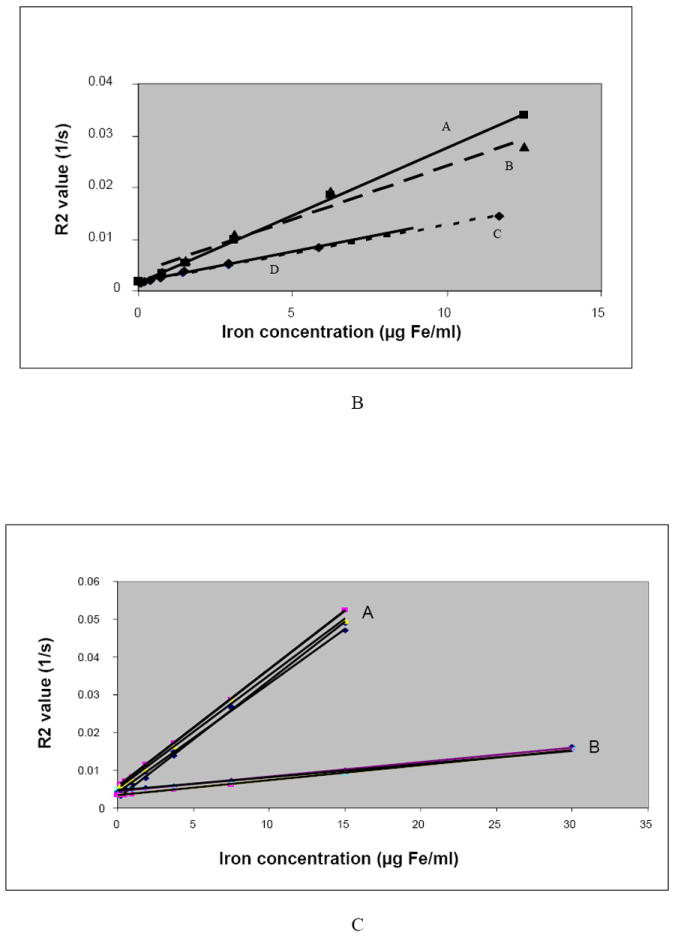
C. Gliosarcoma study: Positive correlations of R2 values and iron concentrations and significant difference between the intracellular and extracellular iron. All values are for gliosarcoma cells with average 30.21 picogram iron per cell.
Group A: R2 values of the free iron concentration in gelatin (3 T and 7 T),
Regression lines for group A: y = 0.0031x + 0.0025, R2 = 0.9993; y = 0.003x + 0.0051, R2 = 0.9849; y = 0.0029x + 0.0041, R2 = 0.9991; y = 0.0031x + 0.0056, R2 = 0.9999;
Group B: R2 values of the intracellular iron concentration (3 T and 7 T),
Regression lines for group B: y = 0.0004x + 0.0044, R2 = 0.9995; y = 0.0003x + 0.0046, R2 = 0.9826; y = 0.0004x + 0.0034, R2 = 0.9994.
R2 Maps of Intracellular and Free Iron
Intracellular iron for all concentrations, both in lymphocytes (Figure 4B) and gliosarcoma cells (Figure 4C), showed lower R2 values than the corresponding free iron in gelatin. However, there was a strong positive correlation (R2 > 0.9694) between the plotted graphs of iron concentrations versus R2 values for the intracellular and free iron.
R2 Maps of Rat Brains
Injected labeled cells into the brains presented differences in the size and intensity of voxels in the corresponding MRI. However, injected unlabeled cell were not seen on MRI. There was no linear correlation between the number of labeled cells and R2 values. 100 labeled cells were the minimum number of cells that were detected on the T2-weighted and FIESTA images (Figures 5).
Figure 5.
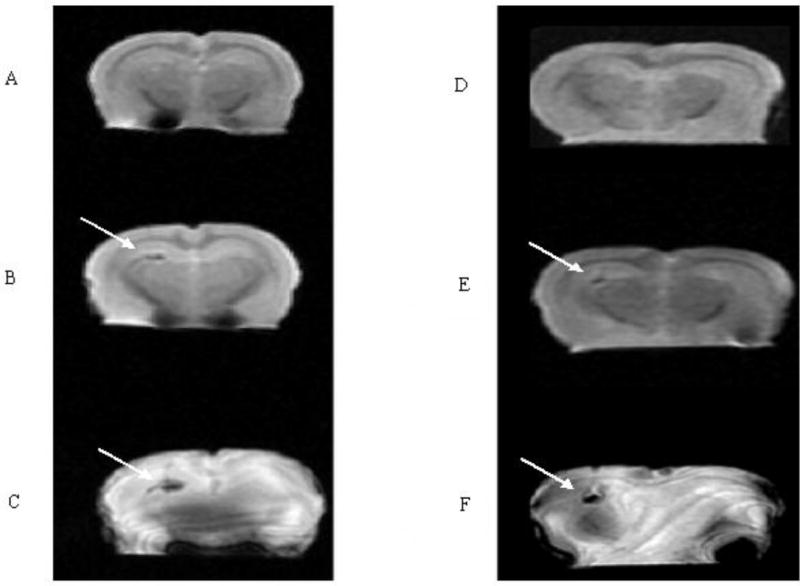
MRI of two rat brains before and after injection of labeled cells: A, D) a T2-weighted image (3 T) of a normal rat brain before injection, B) a T2-weighted image (3 T) of the rat brain after injection of 900 cells, C) a Fiesta image (3T) of the rat brain after injection of 900 iron-oxide labeled cells. E) T2-weighted image (3 T) of the rat brain after injection of 100 cells, F) a Fiesta image (3T) of the rat brain after injection of 100 iron-oxide labeled cells. Arrows show the injection site of the tumor cells. Note that there is no a definite change in the susceptibility effect nor the region size.
Effects of Different Cells on R2 Map
As demonstrated in Figure 6, both the intercepts and the slopes of the regression lines for the R2 values versus intracellular iron concentration for the labeled lymphocytes and gliosarcoma cells were different. The slope for lymphocytes was 3 times greater than the slope for gliosarcoma cells (P-value = 0.001175). However, due to their larger intercept, the labeled gliosarcoma cells, with intracellular iron concentrations of less than 3.86μg/ml, showed larger R2 values than those of the lymphocytes.
Figure 6.
Comparison of the effects of labeled lymphocytes and gliosarcoma cells on R2 values. Regression line A1: Labeled lymphocytes, y = 0.0011x + 0.0017, R2 = 0.9966, 3 T MRI; Regression line A2: Labeled lymphocytes, y = 0.0012x + 0.0017, R2 = 0.9949; 7 T MRI; Regression line B1: Labeled gliosarcoma cells, y = 0.0004x + 0.0044, R2 = 0.9976, 3 T MRI; Regression line B2: Labeled gliosarcoma cells, y = 0.0003x + 0.0046, R2 = 0.9881, 7 T MRI.
Reproducibility and Agreement
As mentioned previously, all experiments were repeated at different times and the results were compared. The results showed no significant difference for R2 values estimated at different times. To evaluate their agreement, besides comparing their mean and standard deviations (see Figure 7), we used the Bland-Altman plots 27,28 for the data pairs (see Figures 8A-B). The Bland-Altman plot evaluates the agreement between two quantitative measurements. It plots the differences between the two measurements (the Y-axis) against the average of the measurements (the X-axis). If the data points agree, then at least 95% of the data points lie within ± 2 standard deviations of the mean differences. There was complete agreement between the 3T and 7T data for both of the free and intracellular iron.
Figure 7.
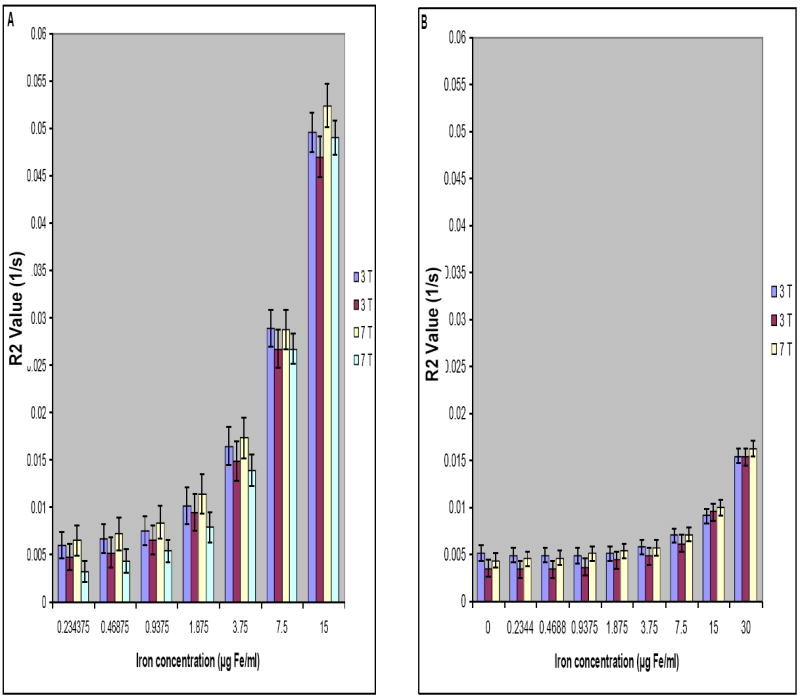
Reproducibility of R2 values measured using 3 T and 7 T systems for phantoms made with free iron in gelatin (A) and labeled gliosarcoma cells with intracellular iron (B). Error bars show standard deviations of the R2 values at different concentrations.
Figure 8.
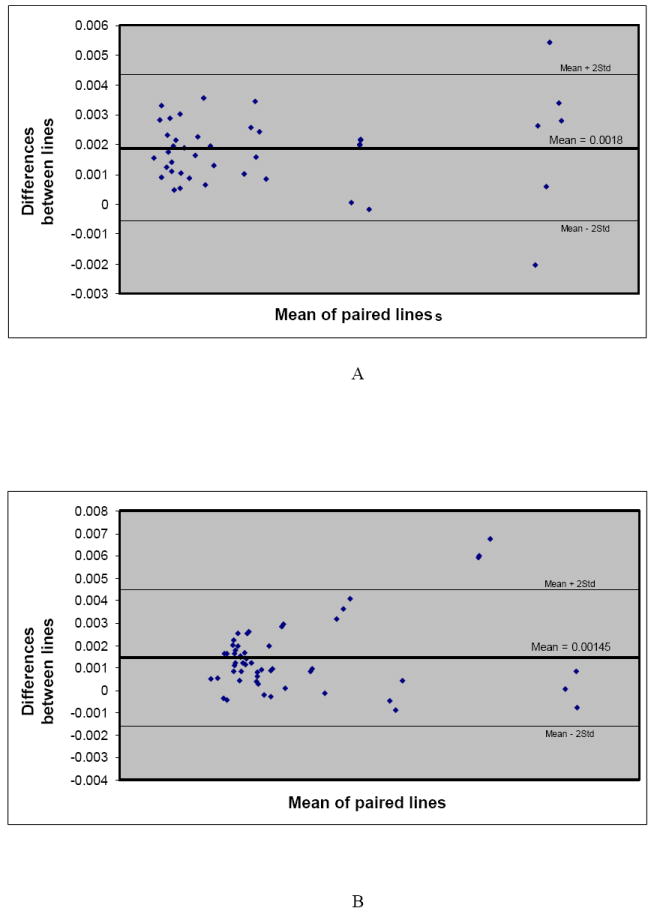
A. Bland-Altman plots showing the agreement of the results (reproducibility of imaging) at 3 T and 7 T for free iron in phantom gels. More than 95% agreement (falling at least 95% of the data points within the two standard deviations of the mean differences) is considered as insignificant difference in our study.
B. Bland-Altman plots showing the agreement of the results (reproducibility of imaging) at 3 T and 7 T for intracellular iron in phantom gels. More than 95 % agreement (falling at least 95% of the data points within the two standard deviations of the mean differences) is considered as insignificant difference in our study.
DISCUSSION
There are different methods of labeling using different iron particles and transfect agents. Our method is one of the most straightforward and efficient methods of labeling. Both feridex and protamine sulfate (labeling and transfection agents) are FDA-approved agents. A variety of cells are labeled including T-cells, stem cells, gliosarcoma cells, macrophages and tracked with MRI in vivo and ex vivo 5,8,10,15-20. Several earlier studies 2,4,5,7,8 as well as our studies have shown no short or long term effects on cell viability, proliferation. However, there is a new study showing immunomodulatory effects of iron particles on the labeled macrophages 29. More than 95% of cells were labeled with iron using FE-PRO complex in our study, which is in accordance with previously reported studies 2. However, the amount of iron in our study in lymphocytes was higher that the reported values 2, which might be due to the source of lymphocytes (human vs animal), change in the composition of ferumoxides-protamine sulfate complexes, method of iron measurement, and moreover due to the presence of other non-specific cells. Intracellular iron concentration has a direct positive linear correlation with the incubation time (early phase of incubation, before reaching to saturation), days of culture, confluency of cells in the culture flask, and the size and charge of the complex SPIO-transfection agent (FE-PRO complex in this study)7.
In imaging applications, the mass of iron inside the cell is predictable when the characteristics of SPIO and pinocytic cell types are known. Protamine sulfate changes the negative charge of feridex, causing it to adhere to the cell membrane, and facilitates more efficient labeling. Intracellular iron concentration is not the same for all cell types. Size, electrostatic charge, and the intrinsic behavior of cells are some of the determining parameters.
Detection limits for MRI varies based on the method of labeling and the dosage of iron nanoparticles investigated. Recently, even single labeled cells have been depicted by MR imaging 14,19,20. One of the neglected yet important parameters in tracking labeled cells and detection limits with MRI, specifically in quantitative studies, is the existence of free iron in the labeling solution post-labeling because it is difficult to completely separate extracellular iron from the labeled cells. Another place for free iron is at the injection site, where hemorrhage and labeled dead cells are often found. Most studies have assumed that all iron detected is intracellular and therefore the fluctuation in the MR signal is solely due to intracellular iron concentration (labeled cells) 16. This assumption decreases the accuracy of the results especially in quantitative studies both in vivo and ex vivo.
It is believed that MRI tracking of labeled cells will move from basic experiments to clinical trials in the near future. Therefore, all aspects of the labeling procedure should be reconsidered and confounding effects identified. Changes in the MR signal, and hence its visualization by MR imaging as well as the cell behavior are determining parameters for the suitability of an agent for molecular imaging. Different studies have cited field strength, SNR, pulse sequences, and acquisition parameters (resolution and echo time TE) as important factors for optimal imaging results. For the labeled cells studies, in addition to the above factors, the size of cells, the amount of intracellular iron, the existence of extracellular iron in the tissue of interest, and the volumetric distribution of the labeled cells should be considered for accurate quantitative analysis.
In our study, we have shown the difference between intracellular iron and free iron influences on the R2 values, inline with other studies 23, although they did not report that equal amounts of iron particles in different cell types show different relaxation properties. The mechanism by which iron particles influence NMR relaxation properties has been well studied 30,31. However, to the best of our knowledge, we are the first to show that R2 values depend on the cell type and size even with the same amount of intracellular iron. This is due to the dependency of the iron particles distribution on the cells architecture and size. Relaxivity changes depend on the spatial distribution of iron particles and their surrounding molecules. Although we had cleaned our cell preparation thoroughly not to include any free iron in the cell suspensions, there were few iron particles attached to the cell membrane but extracellular. This attached but extracellular iron might have some influence on the R2 and T2 values of the cell phantoms in our studies. However, considering the total iron concentration in cells, this small number of particles might not have high impact on the results.
For a given iron oxide concentration, the more cells in the voxel, the more spread of iron particles and the higher R2 value. Previous studies have explained this trend based on static dephasing regime conditions 30. In this theory, the large cells (compartmental magnetic moment) produces a strong enough out-sphere dipolar field such that diffusion has a minimal effect on the NMR signal decay 30. Our results confirmed this theory with the intracellular iron concentrations higher than 3.86μg/ml. In lower concentrations, larger cells had higher R2 values. The result for lower concentrations can be explainable based on more intrinsic iron in larger cells or more place for motion of free protons.
Our ex vivo brain study did not show a linear correlation between the number of labeled cells and R2 values. This can be due to our different anatomical place of injection (gray matter, white matter, and their border) and time duration of injection. The volume of injection can also be a confounder. Even though we injected the same volume (containing cells), T2-weighted and FIESTA images showed regions with different sizes. A more robust and accurate injection method should be employed for these studies.
Different cell types are being labeled with iron oxides and considered for clinical trials. However, it is important to keep in mind that different cells containing the same iron concentration per ml of tissue will not produce the same R2 and T2 values. The values will be dependent on the cell size. For any quantitative evaluation of the migrated cells at a site of interest, one should consider making phantoms using the corresponding labeled cells before their injection.
In conclusion, in vivo quantification of labeled cells requires considering several variants. Hemorrhage, existence of dead cells, possible extracellular iron, characteristics of labeled cells (size and membrane charge), cellular specifications (texture) of the target organ, distribution of labeled cells, and partial volume effects are some of these variants. Although reproducibility of the R2 values at different field strengths were examined and confirmed, for the quantitative analysis, especially for in vivo studies, a control group as similar as possible to each experiment may be needed to obtain accurate results.
Acknowledgments
The authors would like to thank Mohammad-Reza Siadat, Hassan Bagher-Ebadian, and Karyn Alayne Ledbetter for their generous help with MRI processing. They also would like to thank nursing staff of the Department of Obstetrics and Gynecology for their help with cell preparation.
This work was supported in part by DOD grant BC-052268.
References
- 1.Anderson SA, Glod J, Arbab AS, et al. Noninvasive MR imaging of magnetically labeled stem cells to directly identify neovasculature in a glioma model. Blood. 2005;105(1):420–425. doi: 10.1182/blood-2004-06-2222. [DOI] [PubMed] [Google Scholar]
- 2.Arbab AS, Yocum GT, Kalish H, et al. Efficient magnetic cell labeling with protamine sulfate complexed to ferumoxides for cellular MRI. Blood. 2004;104(4):1217–1223. doi: 10.1182/blood-2004-02-0655. [DOI] [PubMed] [Google Scholar]
- 3.Daldrup-Link HE, Brasch RC. Macromolecular contrast agents for MR mammography: current status. Eur Radiol. 2003;13(2):354–365. doi: 10.1007/s00330-002-1719-1. [DOI] [PubMed] [Google Scholar]
- 4.Daldrup-Link HE, Rudelius M, Piontek G, et al. Migration of iron oxide-labeled human hematopoietic progenitor cells in a mouse model: in vivo monitoring with 1.5-T MR imaging equipment. Radiology. 2005;234(1):197–205. doi: 10.1148/radiol.2341031236. [DOI] [PubMed] [Google Scholar]
- 5.Fleige G, Nolte C, Synowitz M, Seeberger F, Kettenmann H, Zimmer C. Magnetic labeling of activated microglia in experimental gliomas. Neoplasia. 2001;3(6):489–499. doi: 10.1038/sj.neo.7900176. [DOI] [PMC free article] [PubMed] [Google Scholar]
- 6.Frank JA, Zywicke H, Jordan EK, et al. Magnetic intracellular labeling of mammalian cells by combining (FDA-approved) superparamagnetic iron oxide MR contrast agents and commonly used transfection agents. Acad Radiol. 2002;9(Suppl 2):S484–487. doi: 10.1016/s1076-6332(03)80271-4. [DOI] [PubMed] [Google Scholar]
- 7.Frank JA, Miller BR, Arbab AS, et al. Clinically applicable labeling of mammalian and stem cells by combining superparamagnetic iron oxides and transfection agents. Radiology. 2003;228(2):480–487. doi: 10.1148/radiol.2281020638. [DOI] [PubMed] [Google Scholar]
- 8.Arbab AS, Bashaw LA, Miller BR, et al. Characterization of biophysical and metabolic properties of cells labeled with superparamagnetic iron oxide nanoparticles and transfection agent for cellular MR imaging. Radiology. 2003;229(3):838–846. doi: 10.1148/radiol.2293021215. [DOI] [PubMed] [Google Scholar]
- 9.Dodd CH, Hsu HC, Chu WJ, et al. Normal T-cell response and in vivo magnetic resonance imaging of T cells loaded with HIV transactivator-peptide-derived superparamagnetic nanoparticles. J Immunol Methods. 2001;256(1-2):89–105. doi: 10.1016/s0022-1759(01)00433-1. [DOI] [PubMed] [Google Scholar]
- 10.Ahrens ET, Feili-Hariri M, Xu H, Genove G, Morel PA. Receptor-mediated endocytosis of iron-oxide particles provides efficient labeling of dendritic cells for in vivo MR imaging. Magn Reson Med. 2003;49(6):1006–1013. doi: 10.1002/mrm.10465. [DOI] [PubMed] [Google Scholar]
- 11.Zelivyanskaya ML, Nelson JA, Poluektova L, et al. Tracking superparamagnetic iron oxide labeled monocytes in brain by high-field magnetic resonance imaging. J Neurosci Res. 2003;73(3):284–295. doi: 10.1002/jnr.10693. [DOI] [PubMed] [Google Scholar]
- 12.Bendszus M, Stoll G. Caught in the act: in vivo mapping of macrophage infiltration in nerve injury by magnetic resonance imaging. J Neurosci. 2003;23(34):10892–10896. doi: 10.1523/JNEUROSCI.23-34-10892.2003. [DOI] [PMC free article] [PubMed] [Google Scholar]
- 13.Zimmer C, Weissleder R, Poss K, Bogdanova A, Wright SC, Jr, Enochs WS. MR imaging of phagocytosis in experimental gliomas. Radiology. 1995;197(2):533–538. doi: 10.1148/radiology.197.2.7480707. [DOI] [PubMed] [Google Scholar]
- 14.Lewin M, Carlesso N, Tung CH, et al. Tat peptide-derivatized magnetic nanoparticles allow in vivo tracking and recovery of progenitor cells. Nat Biotechnol. 2000;18(4):410–414. doi: 10.1038/74464. [DOI] [PubMed] [Google Scholar]
- 15.Bulte JW, Zhang S, van Gelderen P, et al. Neurotransplantation of magnetically labeled oligodendrocyte progenitors: magnetic resonance tracking of cell migration and myelination. Proc Natl Acad Sci U S A. 1999;96(26):15256–15261. doi: 10.1073/pnas.96.26.15256. [DOI] [PMC free article] [PubMed] [Google Scholar]
- 16.Hoehn M, Kustermann E, Blunk J, et al. Monitoring of implanted stem cell migration in vivo: a highly resolved in vivo magnetic resonance imaging investigation of experimental stroke in rat. Proc Natl Acad Sci U S A. 2002;99(25):16267–16272. doi: 10.1073/pnas.242435499. [DOI] [PMC free article] [PubMed] [Google Scholar]
- 17.Dahnke H, Schaeffter T. Limits of detection of SPIO at 3.0 T using T2 relaxometry. Magn Reson Med. 2005;53(5):1202–1206. doi: 10.1002/mrm.20435. [DOI] [PubMed] [Google Scholar]
- 18.Kircher MF, Allport JR, Graves EE, et al. In vivo high resolution three-dimensional imaging of antigen-specific cytotoxic T-lymphocyte trafficking to tumors. Cancer Res. 2003;63(20):6838–6846. [PubMed] [Google Scholar]
- 19.Asahara T, Murohara T, Sullivan A, et al. Isolation of putative progenitor endothelial cells for angiogenesis. Science. 1997;275(5302):964–967. doi: 10.1126/science.275.5302.964. [DOI] [PubMed] [Google Scholar]
- 20.Heyn C, Bowen CV, Rutt BK, Foster PJ. Detection threshold of single SPIO-labeled cells with FIESTA. Magn Reson Med. 2005;53(2):312–320. doi: 10.1002/mrm.20356. [DOI] [PubMed] [Google Scholar]
- 21.Majumdar S, Zoghbi SS, Gore JC. The influence of pulse sequence on the relaxation effects of superparamagnetic iron oxide contrast agents. Magn Reson Med. 1989;10(3):289–301. doi: 10.1002/mrm.1910100302. [DOI] [PubMed] [Google Scholar]
- 22.Tanimoto A, Pouliquen D, Kreft BP, Stark DD. Effects of spatial distribution on proton relaxation enhancement by particulate iron oxide. J Magn Reson Imaging. 1994;4(5):653–657. doi: 10.1002/jmri.1880040506. [DOI] [PubMed] [Google Scholar]
- 23.Simon GH, Bauer J, Saborovski O, et al. T1 and T2 relaxivity of intracellular and extracellular USPIO at 1.5T and 3T clinical MR scanning. Eur Radiol. 2006;16(3):738–745. doi: 10.1007/s00330-005-0031-2. [DOI] [PubMed] [Google Scholar]
- 24.Daldrup-Link HE, Rudelius M, Oostendorp RA, et al. Comparison of iron oxide labeling properties of hematopoietic progenitor cells from umbilical cord blood and from peripheral blood for subsequent in vivo tracking in a xenotransplant mouse model XXX. Acad Radiol. 2005;12(4):502–510. doi: 10.1016/j.acra.2004.12.021. [DOI] [PubMed] [Google Scholar]
- 25.www.radiologyresearch.org/eigentool.htm
- 26.Soltanian-Zadeh H, Windham JP, Peck DJ, Yagle AE. A Comparative Analysis of Several Transformations for Enhancement and Segmentation of Magnetic Resonance Image Scene Sequences. IEEE Trans Med Imag. 1992;11(3):302–318. doi: 10.1109/42.158934. [DOI] [PubMed] [Google Scholar]
- 27.Bland JM, Altman DG. Statistical methods for assessing agreement between two methods of clinical measurement. Lancet. 1986;1(8476):307–310. [PubMed] [Google Scholar]
- 28.Bland JM, Altman DG. Comparing methods of measurement: why plotting difference against standard method is misleading. Lancet. 1995;346(8982):1085–1087. doi: 10.1016/s0140-6736(95)91748-9. [DOI] [PubMed] [Google Scholar]
- 29.Siglienti I, Bendszus M, Kleinschnitz C, Stoll G. Cytokine profile of iron-laden macrophages: implications for cellular magnetic resonance imaging. J Neuroimmunol. 2006;173(1-2):166–173. doi: 10.1016/j.jneuroim.2005.11.011. [DOI] [PubMed] [Google Scholar]
- 30.Bowen CV, Zhang X, Saab G, Gareau PJ, Rutt BK. Application of the static dephasing regime theory to superparamagnetic iron-oxide loaded cells. Magn Reson Med. 2002;48(1):52–61. doi: 10.1002/mrm.10192. [DOI] [PubMed] [Google Scholar]
- 31.Koenig SH. Solvent relaxation by uniformly magnetized solute spheres. The classical-quantal connection. Invest Radiol. 1998;33(11):822–827. doi: 10.1097/00004424-199811000-00005. [DOI] [PubMed] [Google Scholar]